. 2020 Aug 5;6(32):eabb2745.
doi: 10.1126/sciadv.abb2745. eCollection 2020 Aug.

The Polycomb-associated factor PHF19 controls hematopoietic stem cell state and differentiation

Affiliations

The Polycomb-associated factor PHF19 controls hematopoietic stem cell state and differentiation

Pedro Vizán et al. Sci Adv. .

Abstract

Adult hematopoietic stem cells (HSCs) are rare multipotent cells in bone marrow that are responsible for generating all blood cell types. HSCs are a heterogeneous group of cells with high plasticity, in part, conferred by epigenetic mechanisms. PHF19, a subunit of the Polycomb repressive complex 2 (PRC2), is preferentially expressed in mouse hematopoietic precursors. Here, we now show that, in stark contrast to results published for other PRC2 subunits, genetic depletion of Phf19 increases HSC identity and quiescence. While proliferation of HSCs is normally triggered by forced mobilization, defects in differentiation impede long-term correct blood production, eventually leading to aberrant hematopoiesis. At molecular level, PHF19 deletion triggers a redistribution of the histone repressive mark H3K27me3, which notably accumulates at blood lineage-specific genes. Our results provide novel insights into how epigenetic mechanisms determine HSC identity, control differentiation, and are key for proper hematopoiesis.


Figures

Fig. 1
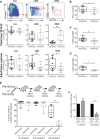
Fig. 1. Characterization of the hematopoietic system in a Phf19-depleted mouse model.
(A) Top: BM gating strategy for phenotypically defining lineage negative (Lin), LSK, and HSCs (LineageSca-1+c-Kit+CD150+CD48). Middle: Quantification from 13 control floxed (Phf19-Flox) and 12 Phf19-KO E14.5 embryos, with percentages shown for the live cells measured as 4′,6-diamidino-2-phenylindole (DAPI) negative (box plot). Bottom: Quantification from 14 control floxed (Phf19-Flox) and 13 to 15 Phf19-KO mice, with percentages shown for the live cells measured as DAPI negative (box plot). (B) Raw number of WBM cells counted per leg in 13 independent experiments (with at least three animals per experiment) (box plot). (C) Percentage of Ki67+ HSC cells in 12 mice for Phf19-Flox and 10 mice for Phf19-KO (box plot). (D) Percentage of BrdU+ HSCs in six Phf19-Flox mice or five Phf19-KO mice at 24 hours after BrdU injection (box plot). (E) Percentage of donor-derived (CD45.2) cells in peripheral blood in serially transplanted recipients 3 months after each transplant (box plot). (F) Normalized number of colonies in the first and second lineage-negative plated cells for colony-forming assay, performed in three independent replicates (means + SEM). *P < 0.05 and **P < 0.01. Unpaired t test (A and C to E). Paired t test (B and F).
Fig. 2
Fig. 2. Characterization of Phf19-KO HSCs after mobilization.
(A) Quantification of phenotypically defined HSCs in young or aged (>60-week-old) mice after transplantation (at 6 months after transplant) and at 14 days after 5-FU injection. The percentage of the live cells measured as DAPI negative is shown (box plot). (B) Schematic representation of a single-cell HSC in vitro functional assay. (C) Proportion of wells of proliferating, nonproliferating, and proliferating and then stopped HSCs in three independent experiments (means + SEM). (D) Gating of lineage-negative marker versus FSC-A (forward scatter area) of pooled wells after 14 days in culture. (E) Percentage of lineage-negative and lineage-positive cells from three independent replicates (means + SEM). *P < 0.05; n.s., not significant. Paired t test (C and E).
Fig. 3
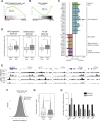
Fig. 3. HSC gene expression control and epigenetic changes associated with Phf19 depletion.
(A) GSEA showing positive enrichment in Phf19-KO transcriptome for HSC gene set [Gazit et al. (25) and Chambers et al. (26)]. (B) GSEA showing negative enrichment in Phf19-KO transcriptome for Myc target gene set. (C) Normalized fold change expression from two independent RNA sequencing (RNA-seq) experiments in relevant genes (means + SD). (D) ChIP-seq levels of H3K27me3 in the transcription start site (TSS) ± 2 kb of specific gene sets: the HSC gene set, the differentiation gene set, and for transcription factors associated with hematopoietic differentiation processes. (E) University of California Santa Cruz (UCSC) genome browser screenshots for H3K27me3 and ATAC of hematopoiesis master regulators in Phf19-Flox and Phf19-KO. (F) Density plot of pairwise distances of cells based on single cell–based HSC (MolO) signature (23) genes for Phf19-Flox and Phf19-KO cells. (G) Distribution shown by violin plot and box plot of absolute number of cells that expressed differentiation genes for 174 Phf19-Flox and Phf19-KO cells. (H) mRNA expression levels of cultured HSCs after 9 days under growth/differentiation conditions depicted in Fig. 2B, relative to Rplp0 and normalized for Phf19-Flox of two replicates (means + SEM). *P < 0.05, **P < 0.01, and ***P < 0.001. Paired t test (D). Wilcoxon rank-sum test (F and G). NES, normalized enrichment score.
Fig. 4
Fig. 4. Lack of Phf19 causes aberrant hematopoiesis over the long term.
(A) Picture depicting splenomegaly at 6 months after transplantation with WBM from aged mice. Photo credit: Pedro Vizán, CRG. (B) Survival curve of all mice (Phf19-Flox versus Phf19-KO) after their last transplant. Time normalized for each experiment to final sacrifice time of all animals. (C) Representative gating of whole spleen analyzed for myeloid, B cell, and T cell proportions (donor CD45.2-positive cells present in the spleen). (D) Quantification of donor CD45.2-positive myeloid, B cell, and T cell proportions in five Phf19-Flox and three Phf19-KO mice. In Phf19-KO conditions, the sum does not reach 100% because of the unspecific population observed in the panel for hematoxylin and eosin staining (means + SEM). (E) Representative hematoxylin and eosin staining of Phf19-KO spleens. Arrowheads indicate mitotic figures. (F) Percentage of Ki67-positive cells in two spleens per condition (more than four white pulp areas per spleen) (means + SEM). (G) GSEA showing positive enrichment in Phf19-KO transcriptome for leukemic stem cell (LSC) differentially up-regulated genes (37). *P < 0.05 and **P < 0.01. Log-rank (Mantel-Cox) test (B). Unpaired t test (D and F).

References

    1. Haas S., Trumpp A., Milsom M. D., Causes and consequences of hematopoietic stem cell heterogeneity. Cell Stem Cell 22, 627–638 (2018). - PubMed
    1. Laurenti E., Gottgens B., From haematopoietic stem cells to complex differentiation landscapes. Nature 553, 418–426 (2018). - PMC - PubMed
    1. Ntziachristos P., Abdel-Wahab O., Aifantis I., Emerging concepts of epigenetic dysregulation in hematological malignancies. Nat. Immunol. 17, 1016–1024 (2016). - PMC - PubMed
    1. Plass C., Pfister S. M., Lindroth A. M., Bogatyrova O., Claus R., Lichter P., Mutations in regulators of the epigenome and their connections to global chromatin patterns in cancer. Nat. Rev. Genet. 14, 765–780 (2013). - PubMed
    1. Di Croce L., Helin K., Transcriptional regulation by Polycomb group proteins. Nat. Struct. Mol. Biol. 20, 1147–1155 (2013). - PubMed

Publication types