

Positive dielectrophoresis-based Raman-activated droplet sorting for culture-free and label-free screening of enzyme function in vivo
- PMID: 32821836
- PMCID: PMC7413728
- DOI: 10.1126/sciadv.abb3521
Positive dielectrophoresis-based Raman-activated droplet sorting for culture-free and label-free screening of enzyme function in vivo
Abstract
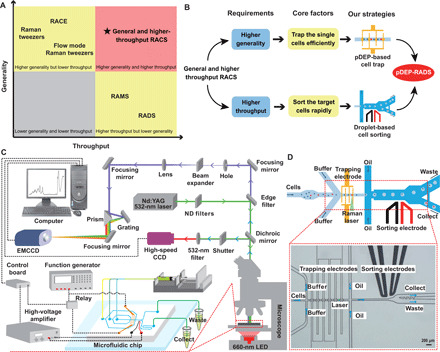
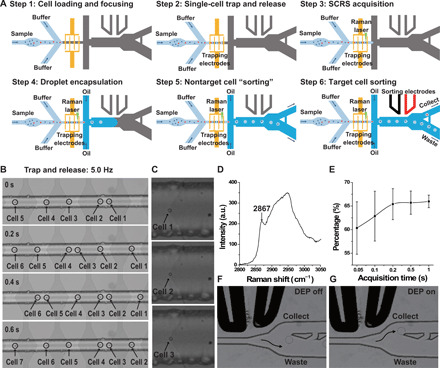
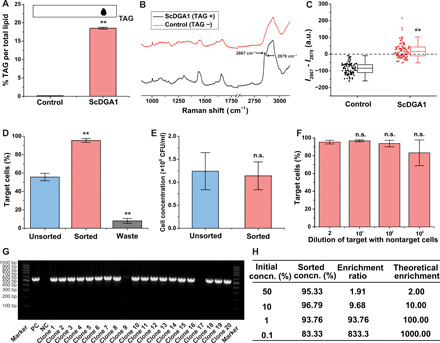
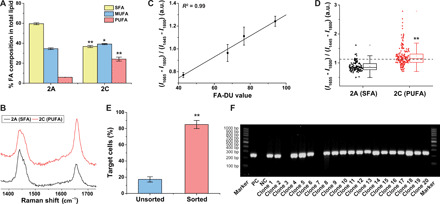
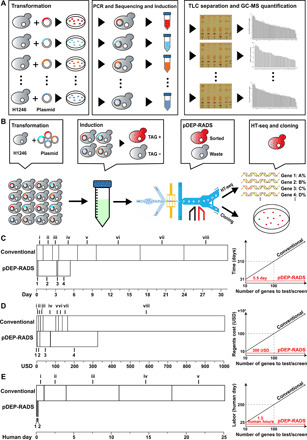
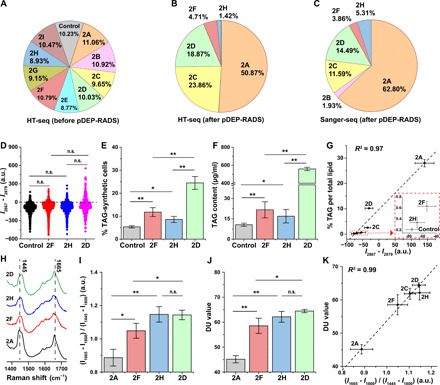
The potential of Raman-activated cell sorting (RACS) is inherently limited by conflicting demands for signal quality and sorting throughput. Here, we present positive dielectrophoresis-based Raman-activated droplet sorting (pDEP-RADS), where a periodical pDEP force was exerted to trap fast-moving cells, followed by simultaneous microdroplet encapsulation and sorting. Screening of yeasts for triacylglycerol (TAG) content demonstrated near-theoretical-limit accuracy, ~120 cells min-1 throughput and full-vitality preservation, while sorting fatty acid degree of unsaturation (FA-DU) featured ~82% accuracy at ~40 cells min-1. From a yeast library expressing algal diacylglycerol acyltransferases (DGATs), a pDEP-RADS run revealed all reported TAG-synthetic variants and distinguished FA-DUs of enzyme products. Furthermore, two previously unknown DGATs producing low levels of monounsaturated fatty acid-rich TAG were discovered. This first demonstration of RACS for enzyme discovery represents hundred-fold saving in time consumables and labor versus culture-based approaches. The ability to automatically flow-sort resonance Raman-independent phenotypes greatly expands RACS' application.
Copyright © 2020 The Authors, some rights reserved; exclusive licensee American Association for the Advancement of Science. No claim to original U.S. Government Works. Distributed under a Creative Commons Attribution NonCommercial License 4.0 (CC BY-NC).
Figures
Similar articles
-
Label-free high-throughput live-cell sorting of genome-wide random mutagenesis libraries for metabolic traits by Raman flow cytometry.Proc Natl Acad Sci U S A. 2025 Jun 3;122(22):e2503641122. doi: 10.1073/pnas.2503641122. Epub 2025 May 30. Proc Natl Acad Sci U S A. 2025. PMID: 40445753
-
Raman-activated cell sorting based on dielectrophoretic single-cell trap and release.Anal Chem. 2015 Feb 17;87(4):2282-9. doi: 10.1021/ac503974e. Epub 2015 Feb 4. Anal Chem. 2015. PMID: 25607599
-
Raman-Activated Droplet Sorting (RADS) for Label-Free High-Throughput Screening of Microalgal Single-Cells.Anal Chem. 2017 Nov 21;89(22):12569-12577. doi: 10.1021/acs.analchem.7b03884. Epub 2017 Nov 9. Anal Chem. 2017. PMID: 29099582
-
Raman activated cell sorting.Curr Opin Chem Biol. 2016 Aug;33:1-8. doi: 10.1016/j.cbpa.2016.04.002. Epub 2016 Apr 18. Curr Opin Chem Biol. 2016. PMID: 27100046 Review.
-
Recent Advances on Sorting Methods of High-Throughput Droplet-Based Microfluidics in Enzyme Directed Evolution.Front Chem. 2021 Apr 23;9:666867. doi: 10.3389/fchem.2021.666867. eCollection 2021. Front Chem. 2021. PMID: 33996758 Free PMC article. Review.
Cited by
-
Intra-Ramanome Correlation Analysis Unveils Metabolite Conversion Network from an Isogenic Population of Cells.mBio. 2021 Aug 31;12(4):e0147021. doi: 10.1128/mBio.01470-21. Epub 2021 Aug 31. mBio. 2021. PMID: 34465024 Free PMC article.
-
Ultrahigh Throughput Evolution of Tryptophan Synthase in Droplets via an Aptamer Sensor.ACS Catal. 2024 Apr 10;14(8):6259-6271. doi: 10.1021/acscatal.4c00230. eCollection 2024 Apr 19. ACS Catal. 2024. PMID: 38660603 Free PMC article.
-
Assessing Efficacy of Clinical Disinfectants for Pathogenic Fungi by Single-Cell Raman Microspectroscopy.Front Cell Infect Microbiol. 2022 Feb 23;12:772378. doi: 10.3389/fcimb.2022.772378. eCollection 2022. Front Cell Infect Microbiol. 2022. PMID: 35281452 Free PMC article.
-
[Application of Droplet-Based Microfluidics in Microbial Research].Sichuan Da Xue Xue Bao Yi Xue Ban. 2023 May;54(3):673-678. doi: 10.12182/20230560303. Sichuan Da Xue Xue Bao Yi Xue Ban. 2023. PMID: 37248604 Free PMC article. Review. Chinese.
-
Light-Responsive Materials in Droplet Manipulation for Biochemical Applications.Adv Mater. 2025 Jan;37(2):e2313935. doi: 10.1002/adma.202313935. Epub 2024 Mar 1. Adv Mater. 2025. PMID: 38379512 Free PMC article. Review.
References
-
- He Y., Wang X., Ma B., Xu J., Ramanome technology platform for label-free screening and sorting of microbial cell factories at single-cell resolution. Biotechnol. Adv. 37, 107388 (2019). - PubMed
-
- Song Y., Yin H., Huang W. E., Raman activated cell sorting. Curr. Opin. Chem. Biol. 33, 1–8 (2016). - PubMed
-
- Zhang Q., Zhang P., Gou H., Mou C., Huang W. E., Yang M., Xu J., Ma B., Towards high-throughput microfluidic Raman-activated cell sorting. Analyst 140, 6163–6174 (2015). - PubMed
-
- Huang W. E., Ward A. D., Whiteley A. S., Raman tweezers sorting of single microbial cells. Environ. Microbiol. Rep. 1, 44–49 (2009). - PubMed
-
- Berry D., Mader E., Lee T. K., Woebken D., Wang Y., Zhu D., Palatinszky M., Schintlmeister A., Schmid M. C., Hanson B. T., Shterzer N., Mizrahi I., Rauch I., Decker T., Bocklitz T., Popp J., Gibson C. M., Fowler P. W., Huang W. E., Wagner M., Tracking heavy water (D2O) incorporation for identifying and sorting active microbial cells. Proc. Natl. Acad. Sci. U.S.A. 112, E194–E203 (2015). - PMC - PubMed
Publication types
LinkOut - more resources
Full Text Sources
Miscellaneous
