. 2020 Aug 5;6(32):eabc0413.
doi: 10.1126/sciadv.abc0413. eCollection 2020 Aug.

Fentanyl vapor self-administration model in mice to study opioid addiction

Affiliations

Fentanyl vapor self-administration model in mice to study opioid addiction

K Moussawi et al. Sci Adv. .

Abstract

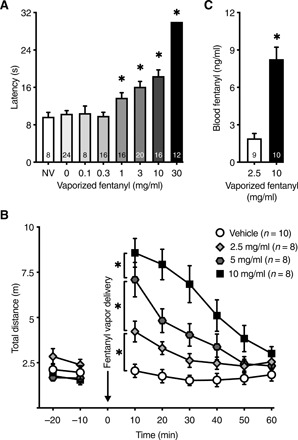
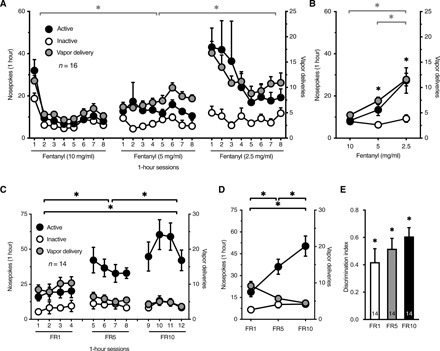
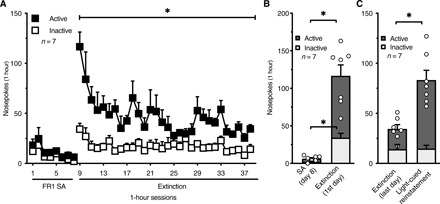
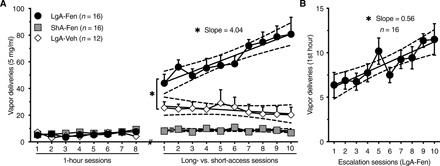
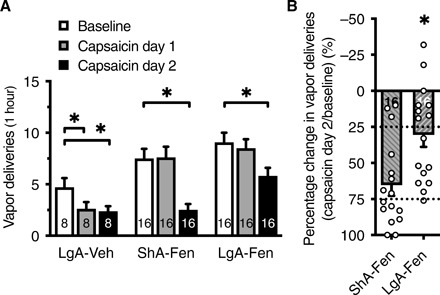
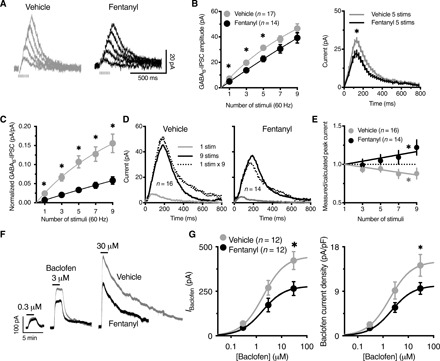
Intravenous drug self-administration is considered the "gold standard" model to investigate the neurobiology of drug addiction in rodents. However, its use in mice is limited by frequent complications of intravenous catheterization. Given the many advantages of using mice in biomedical research, we developed a noninvasive mouse model of opioid self-administration using vaporized fentanyl. Mice readily self-administered fentanyl vapor, titrated their drug intake, and exhibited addiction-like behaviors, including escalation of drug intake, somatic signs of withdrawal, drug intake despite punishment, and reinstatement of drug seeking. Electrophysiological recordings from ventral tegmental area dopamine neurons showed a lower amplitude of GABAB receptor-dependent currents during protracted abstinence from fentanyl vapor self-administration. This mouse model of fentanyl self-administration recapitulates key features of opioid addiction, overcomes limitations of the intravenous model, and allows investigation of the neurobiology of opioid addiction in unprecedented ways.


Figures

Fig. 1
Fig. 1. Vaporized fentanyl induces analgesia and increases locomotor activity.
(A) Passive administration of vaporized fentanyl (four vapor deliveries over 8 min) increased the latency to nociception in the hot-plate test [one-way analysis of variance (ANOVA); F7,112 = 38.45; P < 0.0001] in a concentration-dependent manner. Sidak’s multiple comparisons test shows that the 1, 3, 10, and 30 mg/ml groups were significantly different from vehicle. “NV” indicates mice that were not exposed to fentanyl or vehicle vapor. (B) Locomotor activity in meters was measured at baseline and after passive exposure to different concentrations of vaporized fentanyl (five vapor deliveries over 10 min) versus vehicle vapor (0 mg/ml). Locomotor activity increased with the concentration of vaporized fentanyl [two-way repeated-measures (RM) ANOVA; concentration × time interaction F15,150 = 10.14; P < 0.0001]. Sidak’s multiple comparisons test shows significant differences in locomotion between the different concentrations. (C) Blood fentanyl levels in response to five fentanyl vapor deliveries (2.5 mg/ml: 1.91 ± 0.39 ng/ml; 10 mg/ml: 8.27 ± 0.95 ng/ml) that were passively delivered over 1 hour (unpaired t test; t17 = 5.93; P < 0.0001). The ratio of fentanyl blood levels at 10 and 2.5 mg/ml (8.27/1.91 = 4.3) is a close approximation of the ratio of fentanyl concentrations (10/2.5 = 4). The regression analysis of measured blood fentanyl levels yields a slope a = 0.85 (CI: 0.55 to 1.15; F1,17 = 35.14; r2 = 0.67; P < 0.0001), which is not different from the presumed linear metabolism slope (a=(1.91×4)1.91102.5=0.76; test of equal slopes F1,17 = 0.033; P = 0.86), suggesting that fentanyl metabolism was linear within the range of five vapor deliveries over 1 hour at 2.5 and 10 mg/ml, equivalent to a range of 12.5 to 50 mg/ml per hour. The number of mice (n) is shown in the graphs. The data are expressed as means ± SEM. *P < 0.05.
Fig. 2
Fig. 2. Mice self-administer fentanyl vapor and titrate their intake in response to different vaporized fentanyl concentrations and reinforcement schedules.
(A) Mice self-administered fentanyl vapor in 1-hour sessions on an FR1 schedule and increased their responding when the concentration of vaporized fentanyl was reduced from 10 to 5 to 2.5 mg/ml. The graph shows the number of active and inactive nosepokes (NP) (left y axis) and vapor deliveries (VD) (right y axis) in each self-administration session. Two-way RM ANOVA shows a significant concentration × session interaction (F3.73,55.98 = 4.26; P = 0.005) and significant effect of concentration on the number of VD (F1.38,20.65 = 23.84; P < 0.0001). A similar analysis shows a significant effect of fentanyl concentration on the number of active NP (F1.15,17.21 = 9.73; P = 0.005). The number of inactive NP did not change (P = 0.38). (B) Average of all self-administration sessions at each concentration (the first session at 10 mg/ml was a significant outlier per Grubbs’ test likely because of a novelty effect and was not included in the data analyses). Mice discriminated between active and inactive NP operandum as the fentanyl concentration changed. Two-way RM ANOVA shows a significant concentration × NP interaction (F1.16,17.39 = 10.88; P = 0.003). (C) Mice exhibited an increase in the number of active NP when they were switched from an FR1 to FR5 schedule and then to an FR10 schedule (two-way RM ANOVA; F1.48,19.20 = 19.20; P = 0.0002). The number of inactive NP did not change. The number of VD decreased with increasing FR (two-way RM ANOVA; F1.27,16.51 = 16.35; P = 0.0005). (D) Averaged data from (C) at each FR. (E) The discrimination index of fentanyl vapor self-administration was greater than 0 for FR1, FR5, and FR10 (one-sample t test; FR1: t13 = 4.28, P = 0.0009; FR5: t13 = 6.82, P < 0.0001; FR10: t13 = 9.50, P < 0.0001). The discrimination index increased with increasing FR schedule (one-way RM ANOVA; F1.65,21.39 = 4.17; P = 0.036). The number of mice (n) is shown in the graphs. The data are expressed as means ± SEM. *P < 0.05.
Fig. 3
Fig. 3. Mice extinguish and reinstate fentanyl vapor seeking.
(A) After 8 days of fentanyl vapor self-administration sessions, mice underwent extinction training in the absence of cues for 30 sessions. The number of active NP decreased over sessions, reflecting the extinction of drug seeking. Two-way RM ANOVA shows a significant sessions × NP interaction (F29,348 = 2.23; P = 0.0004) and significant effect of session on the number of NP (F3.24,38.84 = 4.70; P = 0.006). (B) The number of active NP increased significantly on day 1 of extinction training compared with the last day of fentanyl self-administration. Two-way RM ANOVA shows a significant training days × NP interaction (F1,12 = 25.92; P = 0.0003), indicating that day 1 of extinction affected active and inactive NP differently. (C) Mice showed robust light cue–induced reinstatement. Two-way RM ANOVA shows a significant reinstatement × NP interaction (F1,12 = 17.44; P = 0.001). SA, self-administration; n, number of mice. The data are expressed as means ± SEM. *P < 0.05.
Fig. 4
Fig. 4. Mice escalate fentanyl vapor self-administration.
(A) The long-access fentanyl (LgA-Fen) group escalated their intake over time. Linear regression analysis shows a positive slope for the LgA-Fen group (a = 4.04; CI, 2.46 to 5.62), which is significantly greater than 0 (F1,158 = 25.53; r2 = 0.14; P < 0.0001). The calculated slopes for the short-access fentanyl (ShA-Fen) group (a = −0.058; CI, −0.33 to 0.22) and long-access vehicle (LgA-Veh) group (a = −0.64; CI, −1.92 to 0.63) were not different from 0. The slopes from the three groups were different from each other (test of equal slopes; F2,434 = 18.77; P < 0.0001). (B) In the LgA-Fen group, the number of VD during the first hour of self-administration increased across escalation days (slope a = 0.56; CI, 0.31 to 0.82; F1,158 = 18.82; r2 = 0.11; P < 0.0001). n, number of mice. The data are expressed as means ± SEM. *P < 0.05.
Fig. 5
Fig. 5. Mice with a history of LgA-Fen vapor self-administration are more resistant to capsaicin-adulterated fentanyl.
(A) The LgA-Veh group was most susceptible to the suppressive effects of capsaicin vapor, whereas the LgA-Fen group was the most resistant. Two-way RM ANOVA shows a significant capsaicin exposure × group interaction (F4,74 = 3.01; P = 0.02) and a significant effect of capsaicin on the number of VD (F1.98,73.14 = 21.77; P < 0.0001). The number of VD decreased only in the second capsaicin session in the ShA-Fen group (P < 0.0001) and LgA-Fen group (P = 0.01) of mice with a greater reduction in the ShA-Fen group compared with the LgA-Fen group. (B) Data from the second capsaicin session in ShA-Fen and LgA-Fen mice in (A) were normalized to baseline VD to illustrate the greater reduction of VD in the ShA-Fen group compared with the LgA-Fen group in response to the second capsaicin session (unpaired t test; t30 = 3.13; P = 0.004). Half of the LgA-Fen mice exhibited less than a 25% reduction of the number of VD, whereas half of the ShA-Fen mice exhibited greater than a 75% reduction. Dotted lines represent the quartiles. The number of mice (n) is shown in the bars. The data are expressed as means ± SEM. *P < 0.05.
Fig. 6
Fig. 6. Fentanyl vapor self-administration reduces GABAB receptor currents in VTA dopamine neurons through pre- and postsynaptic mechanisms.
(A) Representative traces of GABAB IPSCs evoked by one, three, five, seven, or nine electrical stimuli (60 Hz) in slices from mice with a history of short access to vehicle versus fentanyl self-administration. Stimulus artifacts were blanked for clarity. (B) The amplitude of GABAB IPSCs was reduced in neurons from fentanyl versus vehicle mice, shown as the peak amplitude for one, three, five, seven, or nine stimuli (left; two-way RM ANOVA; F1,29 = 5.44; P = 0.027) and full time course for IPSCs evoked by five stimuli (right) (vehicle area under the curve = 6454, CI: 6117 to 6791; fentanyl area under the curve = 4709, CI: 4476 to 4942). (C) The plot of GABAB IPSC amplitudes that were normalized to the intensity of electrical stimulation shows a greater difference between vehicle and fentanyl GABAB IPSCs (stimulus × treatment interaction F4,116 = 9.12; P < 0.0001). (D) Representative traces of the arithmetically summed GABAB IPSCs (1 stimulus × 9) versus measured GABAB IPSC that were evoked by nine stimuli (9 stims) in slices from vehicle mice (left) (measured < calculated), suggesting paired-pulse depression, and fentanyl mice, (right) (measured > calculated), suggesting paired-pulse facilitation. (E) Ratio of the measured GABAB-IPSC amplitude over the calculated amplitude for each number of stimuli. Linear regression shows a significantly negative slope for vehicle (a = −0.02; F1,63 = 12.3; P = 0.0008) and a significantly positive slope for fentanyl (a = 0.021; F1,55 = 7.282; P = 0.009). (F) Representative traces of whole-cell voltage-clamp recordings (baselined and peak-aligned) from vehicle versus fentanyl mice, demonstrating the concentration-dependent outward current produced by the application of (R)-baclofen. (G) The maximal outward current that was produced by (R)-baclofen was reduced in neurons from fentanyl mice compared with vehicle mice (left). The data were analyzed by nonlinear regression (sigmoidal fit; vehicle, Emax = 446.9 pA; fentanyl, Emax = 279.6 pA; F1,51 = 7.35; P = 0.009). No change in the EC50 was observed (vehicle, EC50 = 1.87 μM; fentanyl, EC50 = 1.77 μM). When the amplitude of the outward current was normalized to membrane capacitance (current density, pA/pF), the response to (R)-baclofen was still lower in fentanyl neurons (right). Solid lines represent the sigmoidal fit of the data. n, number of cells. The data are expressed as means ± SEM. *P < 0.05.

References

    1. GBD 2016 Alcohol; Drug Use Collaborators , The global burden of disease attributable to alcohol and drug use in 195 countries and territories, 1990-2016: A systematic analysis for the Global Burden of Disease Study 2016. Lancet Psychiatry 5, 987–1012 (2018). - PMC - PubMed
    1. Larney S., Tran L. T., Leung J., Santo T. Jr., Santomauro D., Hickman M., Peacock A., Stockings E., Degenhardt L., All-cause and cause-specific mortality among people using extramedical opioids: A systematic review and meta-analysis. JAMA Psychiat. 77, 1–10 (2019). - PMC - PubMed
    1. Jones C. M., Einstein E. B., Compton W. M., Changes in synthetic opioid involvement in drug overdose deaths in the United States, 2010-2016. JAMA 319, 1819–1821 (2018). - PMC - PubMed
    1. Kuczyńska K., Grzonkowski P., Kacprzak Ł., Zawilska J. B., Abuse of fentanyl: An emerging problem to face. Forensic Sci. Int. 289, 207–214 (2018). - PubMed
    1. Belin-Rauscent A., Fouyssac M., Bonci A., Belin D., How preclinical models evolved to resemble the diagnostic criteria of drug addiction. Biol. Psychiatry 79, 39–46 (2016). - PMC - PubMed

Publication types

LinkOut - more resources