. 2020 Sep 3;182(5):1125-1139.e18.
doi: 10.1016/j.cell.2020.07.019. Epub 2020 Aug 20.

Decidual NK Cells Transfer Granulysin to Selectively Kill Bacteria in Trophoblasts

Affiliations

Decidual NK Cells Transfer Granulysin to Selectively Kill Bacteria in Trophoblasts

Ângela C Crespo et al. Cell. .

Abstract

Maternal decidual NK (dNK) cells promote placentation, but how they protect against placental infection while maintaining fetal tolerance is unclear. Here we show that human dNK cells highly express the antimicrobial peptide granulysin (GNLY) and selectively transfer it via nanotubes to extravillous trophoblasts to kill intracellular Listeria monocytogenes (Lm) without killing the trophoblast. Transfer of GNLY, but not other cell death-inducing cytotoxic granule proteins, strongly inhibits Lm in human placental cultures and in mouse and human trophoblast cell lines. Placental and fetal Lm loads are lower and pregnancy success is greatly improved in pregnant Lm-infected GNLY-transgenic mice than in wild-type mice that lack GNLY. This immune defense is not restricted to pregnancy; peripheral NK (pNK) cells also transfer GNLY to kill bacteria in macrophages and dendritic cells without killing the host cell. Nanotube transfer of GNLY allows dNK to protect against infection while leaving the maternal-fetal barrier intact.

Keywords: Listeria monocytogenes; cytotoxic granule; decidual NK cells; extravillous trophoblast; granulysin; maternal-fetal tolerance; nanotube; pregnancy.


Conflict of interest statement

Declaration of Interests The authors declare no competing interests.

Figures
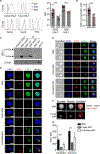
Figure 1.
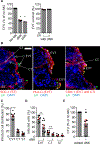
Figure 1.. dNK express GNLY within cytotoxic granules and in the cytosol
(A) Representative flow cytometry histograms (left) of GNLY (9 kDa (clone DH2) and total (clone RB1)), GzmA, GzmB and PFN and mean fluorescence intensity (MFI) (right) of GNLY staining of human dNK and pNK. (B) GNLY in 12 h culture supernatants of human dNK (n=18) and pNK (n=13) by ELISA. (C) Representative immunoblot, probed with GNLY polyclonal rabbit antisera, of purified GNLY or clone DH10 (which recognizes 9 kDa and 15 kDa GNLY)-immunoprecipitated (IP) GNLY from dNK or pNK cell lysates or supernatants (sup). JEG-3 lysate is a negative control. (D) Confocal images of representative dNK, fresh pNK and activated pNK stained for total GNLY (RB1) and PFN, acquired with a Zeiss LSM 700 microscope. Scale bars, 5 μm. (E) Representative raw images from imaging flow cytometry of NK stained for total GNLY (RB1), PFN and DAPI. Scale bars, 7 μm. (F, G) Examples of cytoplasmic and granule masks (F) used to measure GNLY localization in (G). Scale bars, 7 μm. Cytoplasmic and granule GNLY MFI were measured in 1,000–6,000 cells from 3–5 donors by imaging flow cytometry. Data show median with interquartile range (A, B) or mean ± s.e.m (G). ** p<0.01, ***p<0.001 by Mann-Whitney rank test or Kolmogorov-Smirnov test (A, B) or unpaired one-way ANOVA, followed by Tukey’s post-test of each cell type compared with every other type (G). See also Figure S1A–E.
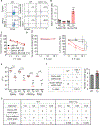
Figure 2.
Figure 2.. NK kill Lm within a trophoblast-like cell line without killing the host cell
(A) Cell-free Lm (left) or Lm CFU in infected JEG-3 (right) after 3 h culture with medium or supernatants from dNK or pNK overnight cultures. (B) Intracellular CFU (left) and JEG-3 viability (right), normalized to medium control samples, after 3 h coincubation of Lm-infected JEG-3 with medium or dNK or pNK (effector:target (E:T) ratio 10:1). (C) Representative dNK and pNK flow cytometry dot plots (left) and percent of NK with externalized CD107a (right) after 4 h incubation with 721.221 (221) or uninfected or Lm-infected JEG-3. (D) Intracellular CFU in Lm-infected JEG-3 (left) or 721.221 viability (right), after incubation with dNK or pNK that were pretreated with anti-GNLY or control IgG, BFA, EGTA, or DCI. Antibodies and EGTA were also present during the co-culture. (E) Intracellular CFU in Lm-infected JEG-3 in the bottom chamber after co-culture for 12 h with dNK or pNK in the same chamber or separated by a Transwell membrane. CFU was normalized to Ctrl samples without NK. Shown are median with interquartile range. *p<0.05, ** p<0.01, ***p<0.001; by non-parametric unpaired one-way ANOVA (Kruskall-Wallis test) (A, B left, D, E) followed by Dunn’s post-tests comparing each NK type with medium (A, B left), or treatment within pNK or dNK with untreated control (D, E) and Kolmogorov-Smirnov test (B right, C). See also Figure S1F.
Figure 3.
Figure 3.. dNK kill Lm in 1° trophoblasts in vitro and in 3D villous cultures in situ
(A) Intracellular CFU in HLA-G+ EVT (left) and EVT survival (right) after co-culture with dNK, pNK or medium for 3 h. (B) Representative immunofluorescence images of three consecutive 5 μm cryosections of a placental villous tree infected with Lm and stained for DAPI, Lm, SDC-1 (ST marker, left), HLA-G (EVT marker, middle) and E-cadherin (CDH-1, CT and EVT marker, right), acquired with an Axio Observer spinning disk confocal microscope. Cell types were identified by staining, nuclear size and localization. Scale bar, 50 μm. (C) Distribution of Lm-infected cells amongst trophoblast cell types 72 h after infection of villous explants. (D) Percentage of infected EVT, CT and ST in villi cultured with or without autologous dNK or medium for 72 h. Percentages in (C,D) were calculated in 10 imaging fields (217x magnification) from a representative donor. (E) Lm CFU in villous cultures incubated for 72 h with dNK or medium. For each donor sample CFU were normalized to the tissue size estimated by DNA quantification and CFU in dNK samples were normalized to samples without added NK. Shown are median ± interquartile range (A) or mean ± s.e.m. (C-E). *p<0.05, ** p<0.01, ***p<0.001; by unpaired non-parametric one-way ANOVA (Kruskall-Wallis test followed by Dunn’s post-test (A left, comparing cells co-cultured with and without NK), Wilcoxon rank test (A right), one-way ANOVA followed by Tukey’s post-test comparing each cell type with each other (C) and paired t-test (D-E).
Figure 4.
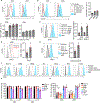
Figure 4.. dNK transfer GNLY, but not GzmB, into JEG-3 and 1° trophoblasts
(A) Representative flow cytometry histograms (top) and GNLY MFI (bottom) in NK or JEG-3 cultured without or with dNK or pNK for the indicated times. (B) Representative flow cytometry histograms (left) of GzmB in NK or JEG-3 cultured without or with dNK or pNK for the indicated times. Graph (right) shows GzmB MFI in JEG-3 after coculture for 45 min. (C) Representative flow cytometry histograms of dNK and isolated human 1° trophoblasts (mixture of HLA-G+ EVT and HLA-G ST and CT) cultured with or without dNK for 3 h (left). GNLY MFI in trophoblasts after 3 h culture with dNK or pNK (right). (D) Representative flow cytometry histogram (left) and GNLY MFI (right) in freshly isolated pNK and after 6 d of cytokine activation. (E) Representative flow cytometry histogram (left) and GNLY MFI (right) in activated pNK and JEG-3 cultured without or with activated pNK. (F) Flow cytometry histograms of intracellular GNLY in dNK or indicated target cells cultured for 3 h with or without dNK. (Data are representative of 3 dNK samples.) (G, H) Host cell viability (G) and mean change in intracellular Lm CFU (H) when Lm-infected cells were incubated for 3 h with dNK or pNK from 3–5 donors or medium. In all experiments, E:T ratio, 10:1. Graphs show median ± interquartile range (A-C) or mean ± s.e.m. (D, E, G, H). *p<0.05, ** p<0.01, ***p<0.001; by paired non-parametric one-way ANOVA (Friedman’s test followed by Dunn’s post-test comparing each time point with time 0 (A), unpaired non-parametric one-way ANOVA (Kruskal-Wallis followed by Dunn’s post-test of each NK type compared to no NK (B), each target with NK compared to sample without NK (G, H), Wilcoxon rank sum test (C) and paired t-test (D, E). See also Figures S2 and S3.
Figure 5.
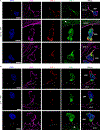
Figure 5.. NK form nanotubes to JEG-3 and EVT that contain GNLY
(A, B) Representative single channel SIM images showing GNLY (RB1 - green) in the cytoplasmic connections (actin, magenta) between dNK and JEG-3 (A) or 1° EVT (B). Images were fixed after 60 min co-culture and acquired with a Zeiss ELYRA microscope. LFA-1 (red) is only expressed in dNK. JEG-3 and EVT cell membranes outlined in white. Arrows indicate GNLY in the target cell. Scale bars, 5 μm. See also Figure S4.
Figure 6.
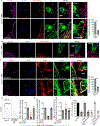
Figure 6.. Nanotubes originate from dNK and transfer GNLY in an actin-dependent manner
(A) Representative single channel SIM images of DiO-labeled dNK co-cultured with CellTracker® Deep Red-labeled JEG-3 and stained for CD56 (dNK marker) and CD49f (JEG-3 integrin). The top panel show membrane projections originating from both cells, while the bottom shows projections only from dNK. Scale bars, 10 μm. JEG-3 membrane is delineated. Shown at right is mean ± s.e.m percentage of membrane projections staining with DiO (dNK) or CD49f (JEG-3) from analysis of 25 contacts in each of 2 donors. (B) Representative single channel SIM images of CellTracker-labeled 1° EVT co-cultured with DiO-labeled dNK stained for CD56 and B7-H3 (EVT marker, magenta). Scale bar, 5 μm. EVT membrane is outlined. (C) Representative single channel SIM images of dNK co-cultured for 1 h with JEG-3, stained for CD56 (dNK), CD49f (JEG-3), actin and tubulin. In the bottom panel both tubulin and actin stain the nanotubes, while in the top, only actin. JEG-3 membrane is delineated. Scale bars, 5 μm. Shown at right is mean ± s.e.m. percentage of nanotubes staining for actin or tubulin from analysis of 20–45 contacts in each of 3 donors. All co-cultures lasted 1 h. Images were acquired with the Zeiss ELYRA microscope. (D) Representative flow cytometry histograms (left) and (median ± interquartile range) fold change in GNLY MFI in JEG-3 after culture for 15 min with NK (E:T ratio, 3:1) from 3–5 donors in the presence or absence of cytochalasin D (cytoD) or Dynasore. (E) Effect of inhibitors on the percentage of dNK:JEG-3 interactions with visible nanotube connections (left) and the percentage of NK in contact with JEG-3 (right) after 15 min co-culture. Shown is fold change compared to no inhibitors (mean ± s.e.m). For each condition, at least 24 dNK:JEG-3 contacts per donor in 3–5 donors were analyzed. (F) Effect of inhibitors on NK suppression of intracellular Lm CFU in JEG-3 after 3 h co-culture. Shown are mean ± s.e.m of percentages relative to culture without NK in 3 donors. *p<0.05, **p˂0.01, ***p<0.001, by χ2 test (A, C, E), paired non-parametric one-way ANOVA (Friedman’s test) followed by Dunn’s post-test comparing each treatment with no inhibitor (D) and unpaired non-parametric one-way ANOVA (Kruskal-Wallis test) followed by Dunn’s post-test, comparing each treatment with no inhibitor (F). See also Figure S5.
Figure 7.
Figure 7.. GNLY-Tg mouse NK kill intracellular bacteria without killing a mouse trophoblast cell line and protect GNLY-Tg dams from abortion after Lm infection
(A) Flow cytometry dot plots showing the percentage of murine splenic NK (sNK) and uterine NK (uNK) within CD45+ cells (left) and the percentage of NK staining for GNLY (clone RB1) (right). (Data are representative of 3 mice analyzed on g.d. 10.) (B) Secreted GNLY in WT and GNLY-Tg mice (n=3) sNK and uNK 12 h culture supernatants. (C, D) Viability of YAC-1 (C) or Lm-infected SM9–1 (left) and intracellular Lm CFU in SM9–1 (right) (D) after 3 h co-culture with sNK or uNK from WT or GNLY-Tg animals (n=3). (E, F) Bacterial CFU on g.d. 9 (E) and dams with live pups (left) and mean number of pups/litter in mice that had viable pups (right) (F) in WT (n=10) and GNLY-Tg (n=11) mice that were infected with Lm on g.d. 6. (G) Pregnancy outcome in WT and GNLY-Tg mice depleted of lymphocyte subsets using control antibody (Ctrl) or NK, CD4 or CD8 depleting antibodies (starting at g.d. 3) and then infected with Lm on g.d. 6. Depletion was verified on g.d. 6 (Figure S6D). χ2 test compared pregnancy outcome in WT and GNLY-Tg mice (F) or in depleted mice with mice treated with the control (Ctrl) antibody (G). Shown are mean ± s.e.m (B-D, F). Red lines in (E) represent median values. ns, not significant, *p<0.05, ** p<0.01, ***p<0.001; by unpaired one-way ANOVA (B) or unpaired non-parametric one-way ANOVA (Kruskal-Wallis test (C, D)) followed by post-tests comparing each NK type in each mice group with every other group (B) and area under the curves (C, D); and Mann-Whitney/Kolmogorov-Smirnov test (comparing WT with GNLY-Tg for each tissue (E)). See also Figure S6.

Comment in

References

    1. Apps R, Murphy SP, Fernando R, and Ahad T (2009). Human leucocyte antigen (HLA) expression of primary trophoblast cells and placental cell lines, determined using single antigen beads to characterize allotype specificities of anti-HLA antibodies. Immunology 127, 26–39. - PMC - PubMed
    1. Berges C, Naujokat C, Tinapp S, Wieczorek H, Ho A, Sadeghi M, Opelz G, and Daniel V (2005). A cell line model for the differentiation of human dendritic cells. Biochem. Biophys. Res. Commun 333, 896–907. - PubMed
    1. Błaszkowska J, and Góralska K (2014). Parasites and fungi as a threat for prenatal and postnatal human development. Ann. Parasitol 60, 225–234. - PubMed
    1. Cao B, and Mysorekar IU (2014). Intracellular bacteria in placental basal plate localize to extravillous trophoblasts. Placenta 35, 139–142. - PubMed
    1. Chauveau A, Aucher A, Eissmann P, Vivier E, and Davis DM (2010). Membrane nanotubes facilitate long-distance interactions between natural killer cells and target cells. Proc. Natl. Acad. Sci. U. S. A 107, 5545–5550. - PMC - PubMed

Publication types

MeSH terms

Substances