

Comparison of molecular testing strategies for COVID-19 control: a mathematical modelling study
- PMID: 32822577
- PMCID: PMC7434438
- DOI: 10.1016/S1473-3099(20)30630-7
Comparison of molecular testing strategies for COVID-19 control: a mathematical modelling study
Abstract
Background: WHO has called for increased testing in response to the COVID-19 pandemic, but countries have taken different approaches and the effectiveness of alternative strategies is unknown. We aimed to investigate the potential impact of different testing and isolation strategies on transmission of severe acute respiratory syndrome coronavirus 2 (SARS-CoV-2).
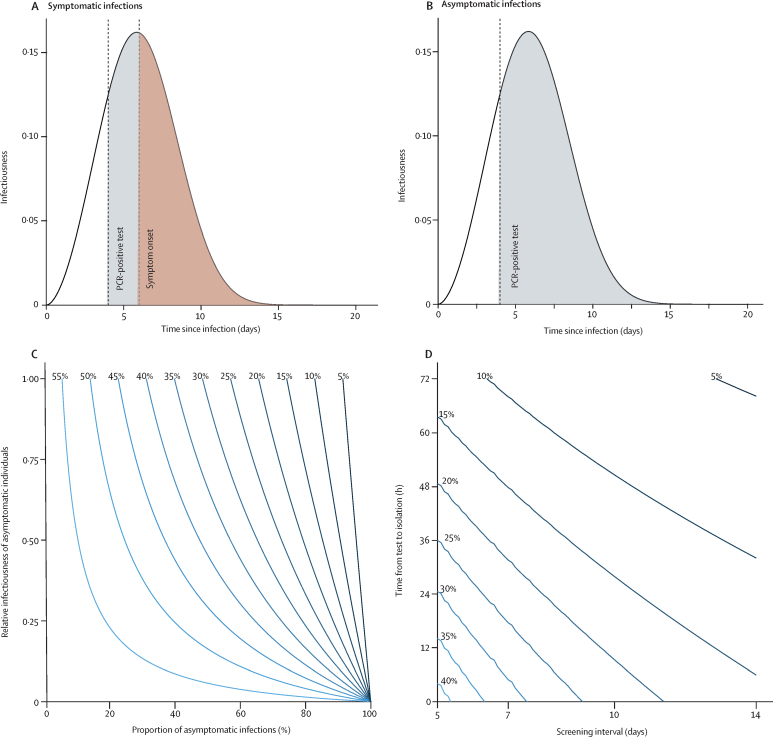
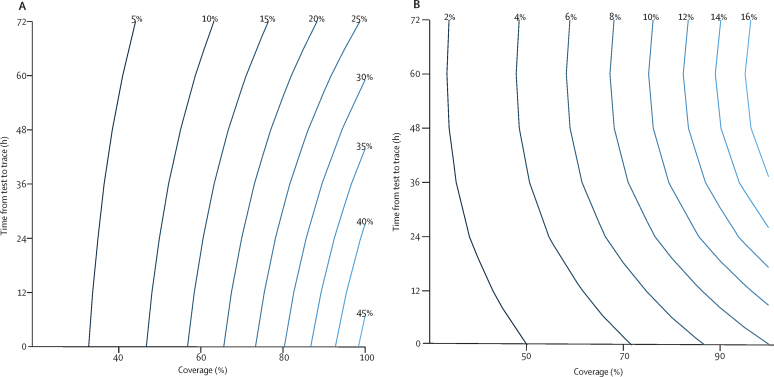
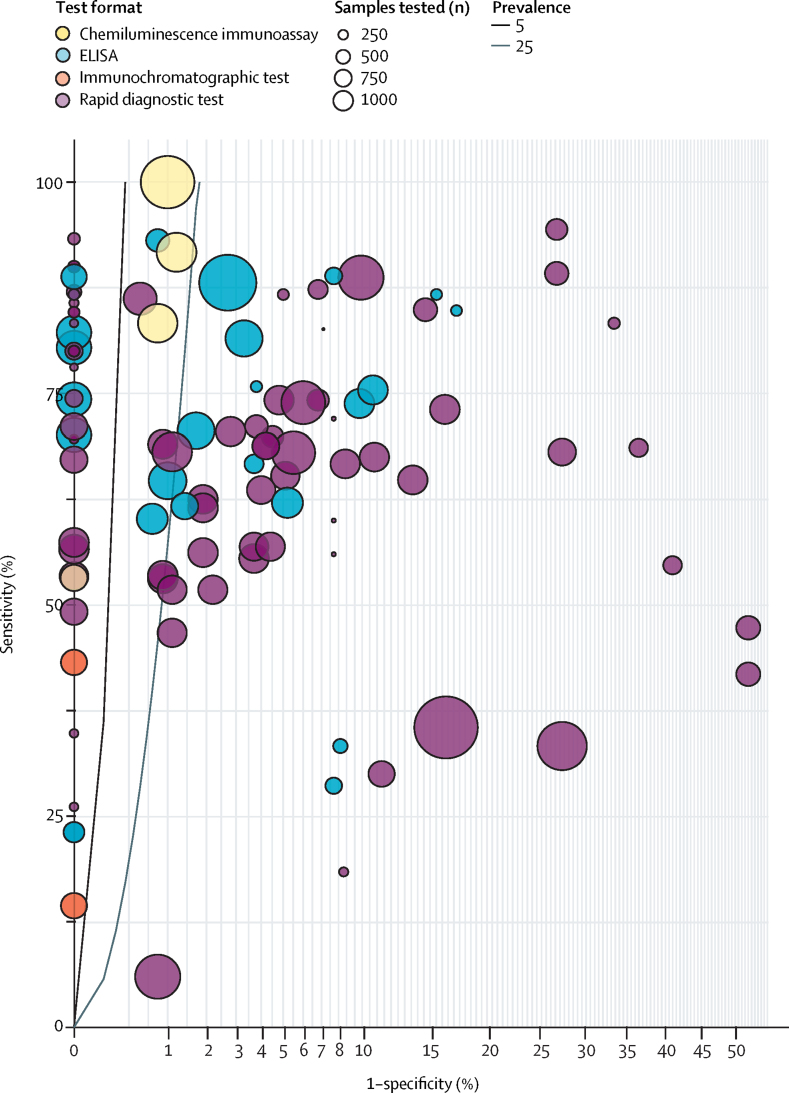
Methods: We developed a mathematical model of SARS-CoV-2 transmission based on infectiousness and PCR test sensitivity over time since infection. We estimated the reduction in the effective reproduction number (R) achieved by testing and isolating symptomatic individuals, regular screening of high-risk groups irrespective of symptoms, and quarantine of contacts of laboratory-confirmed cases identified through test-and-trace protocols. The expected effectiveness of different testing strategies was defined as the percentage reduction in R. We reviewed data on the performance of antibody tests reported by the Foundation for Innovative New Diagnostics and examined their implications for the use of so-called immunity passports.
Findings: If all individuals with symptoms compatible with COVID-19 self-isolated and self-isolation was 100% effective in reducing onwards transmission, self-isolation of symptomatic individuals would result in a reduction in R of 47% (95% uncertainty interval [UI] 32-55). PCR testing to identify SARS-CoV-2 infection soon after symptom onset could reduce the number of individuals needing to self-isolate, but would also reduce the effectiveness of self-isolation (around 10% would be false negatives). Weekly screening of health-care workers and other high-risk groups irrespective of symptoms by use of PCR testing is estimated to reduce their contribution to SARS-CoV-2 transmission by 23% (95% UI 16-40), on top of reductions achieved by self-isolation following symptoms, assuming results are available at 24 h. The effectiveness of test and trace depends strongly on coverage and the timeliness of contact tracing, potentially reducing R by 26% (95% UI 14-35) on top of reductions achieved by self-isolation following symptoms, if 80% of cases and contacts are identified and there is immediate testing following symptom onset and quarantine of contacts within 24 h. Among currently available antibody tests, performance has been highly variable, with specificity around 90% or lower for rapid diagnostic tests and 95-99% for laboratory-based ELISA and chemiluminescent assays.
Interpretation: Molecular testing can play an important role in prevention of SARS-CoV-2 transmission, especially among health-care workers and other high-risk groups, but no single strategy will reduce R below 1 at current levels of population immunity. Immunity passports based on antibody tests or tests for infection face substantial technical, legal, and ethical challenges.
Funding: UK Medical Research Council.
Copyright © 2020 The Author(s). Published by Elsevier Ltd. This is an Open Access article under the CC BY 4.0 license. Published by Elsevier Ltd.. All rights reserved.
Figures
References
-
- Semple C, Docherty A, Green C. Dynamic CO-CIN report to SAGE and NERVTAG. May 13, 2020. https://assets.publishing.service.gov.uk/government/uploads/system/uploa...
-
- Ministerio de Sanidad Espana Informe sobre la situación de COVID-19 en España. Informe COVID-19 no 22. April 13, 2020. https://www.isciii.es/QueHacemos/Servicios/VigilanciaSaludPublicaRENAVE/...
-
- Office for National Statistics Coronavirus (COVID-19) infection survey pilot. 5 June 2020. https://www.ons.gov.uk/peoplepopulationandcommunity/healthandsocialcare/...
Publication types
MeSH terms
LinkOut - more resources
Full Text Sources
Medical
Miscellaneous
