. 2020 Nov 5;27(5):732-747.e7.
doi: 10.1016/j.stem.2020.08.001. Epub 2020 Aug 20.

Single-Cell Analysis of Neonatal HSC Ontogeny Reveals Gradual and Uncoordinated Transcriptional Reprogramming that Begins before Birth

Affiliations

Single-Cell Analysis of Neonatal HSC Ontogeny Reveals Gradual and Uncoordinated Transcriptional Reprogramming that Begins before Birth

Yanan Li et al. Cell Stem Cell. .

Abstract

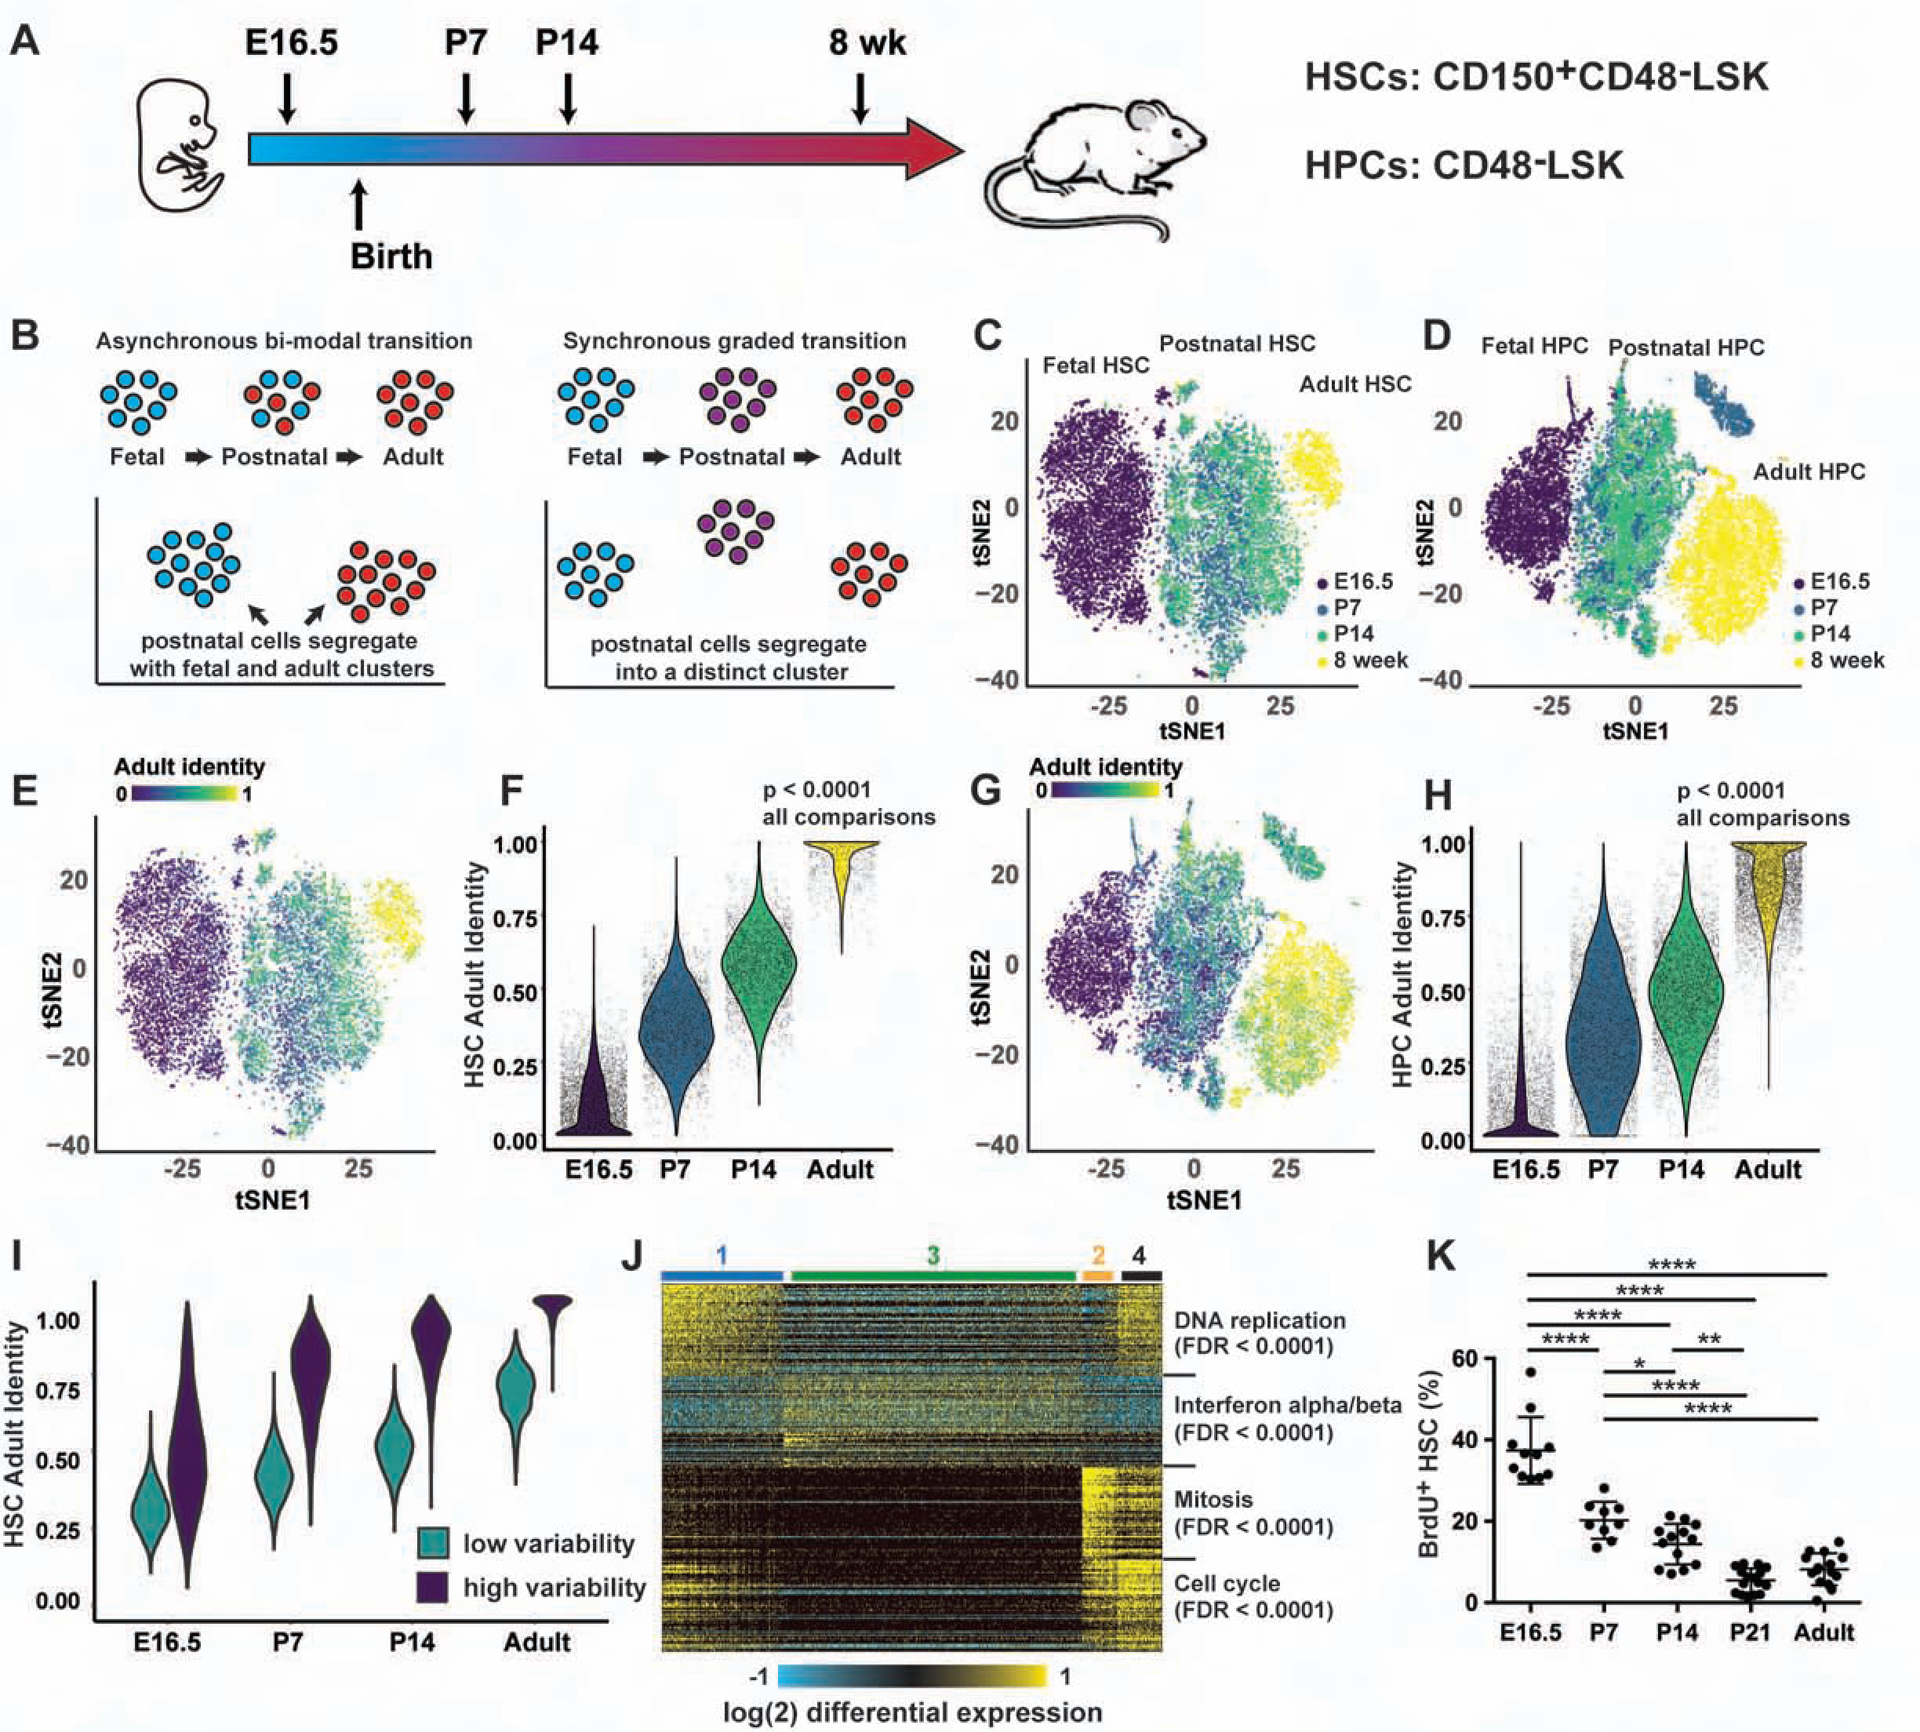
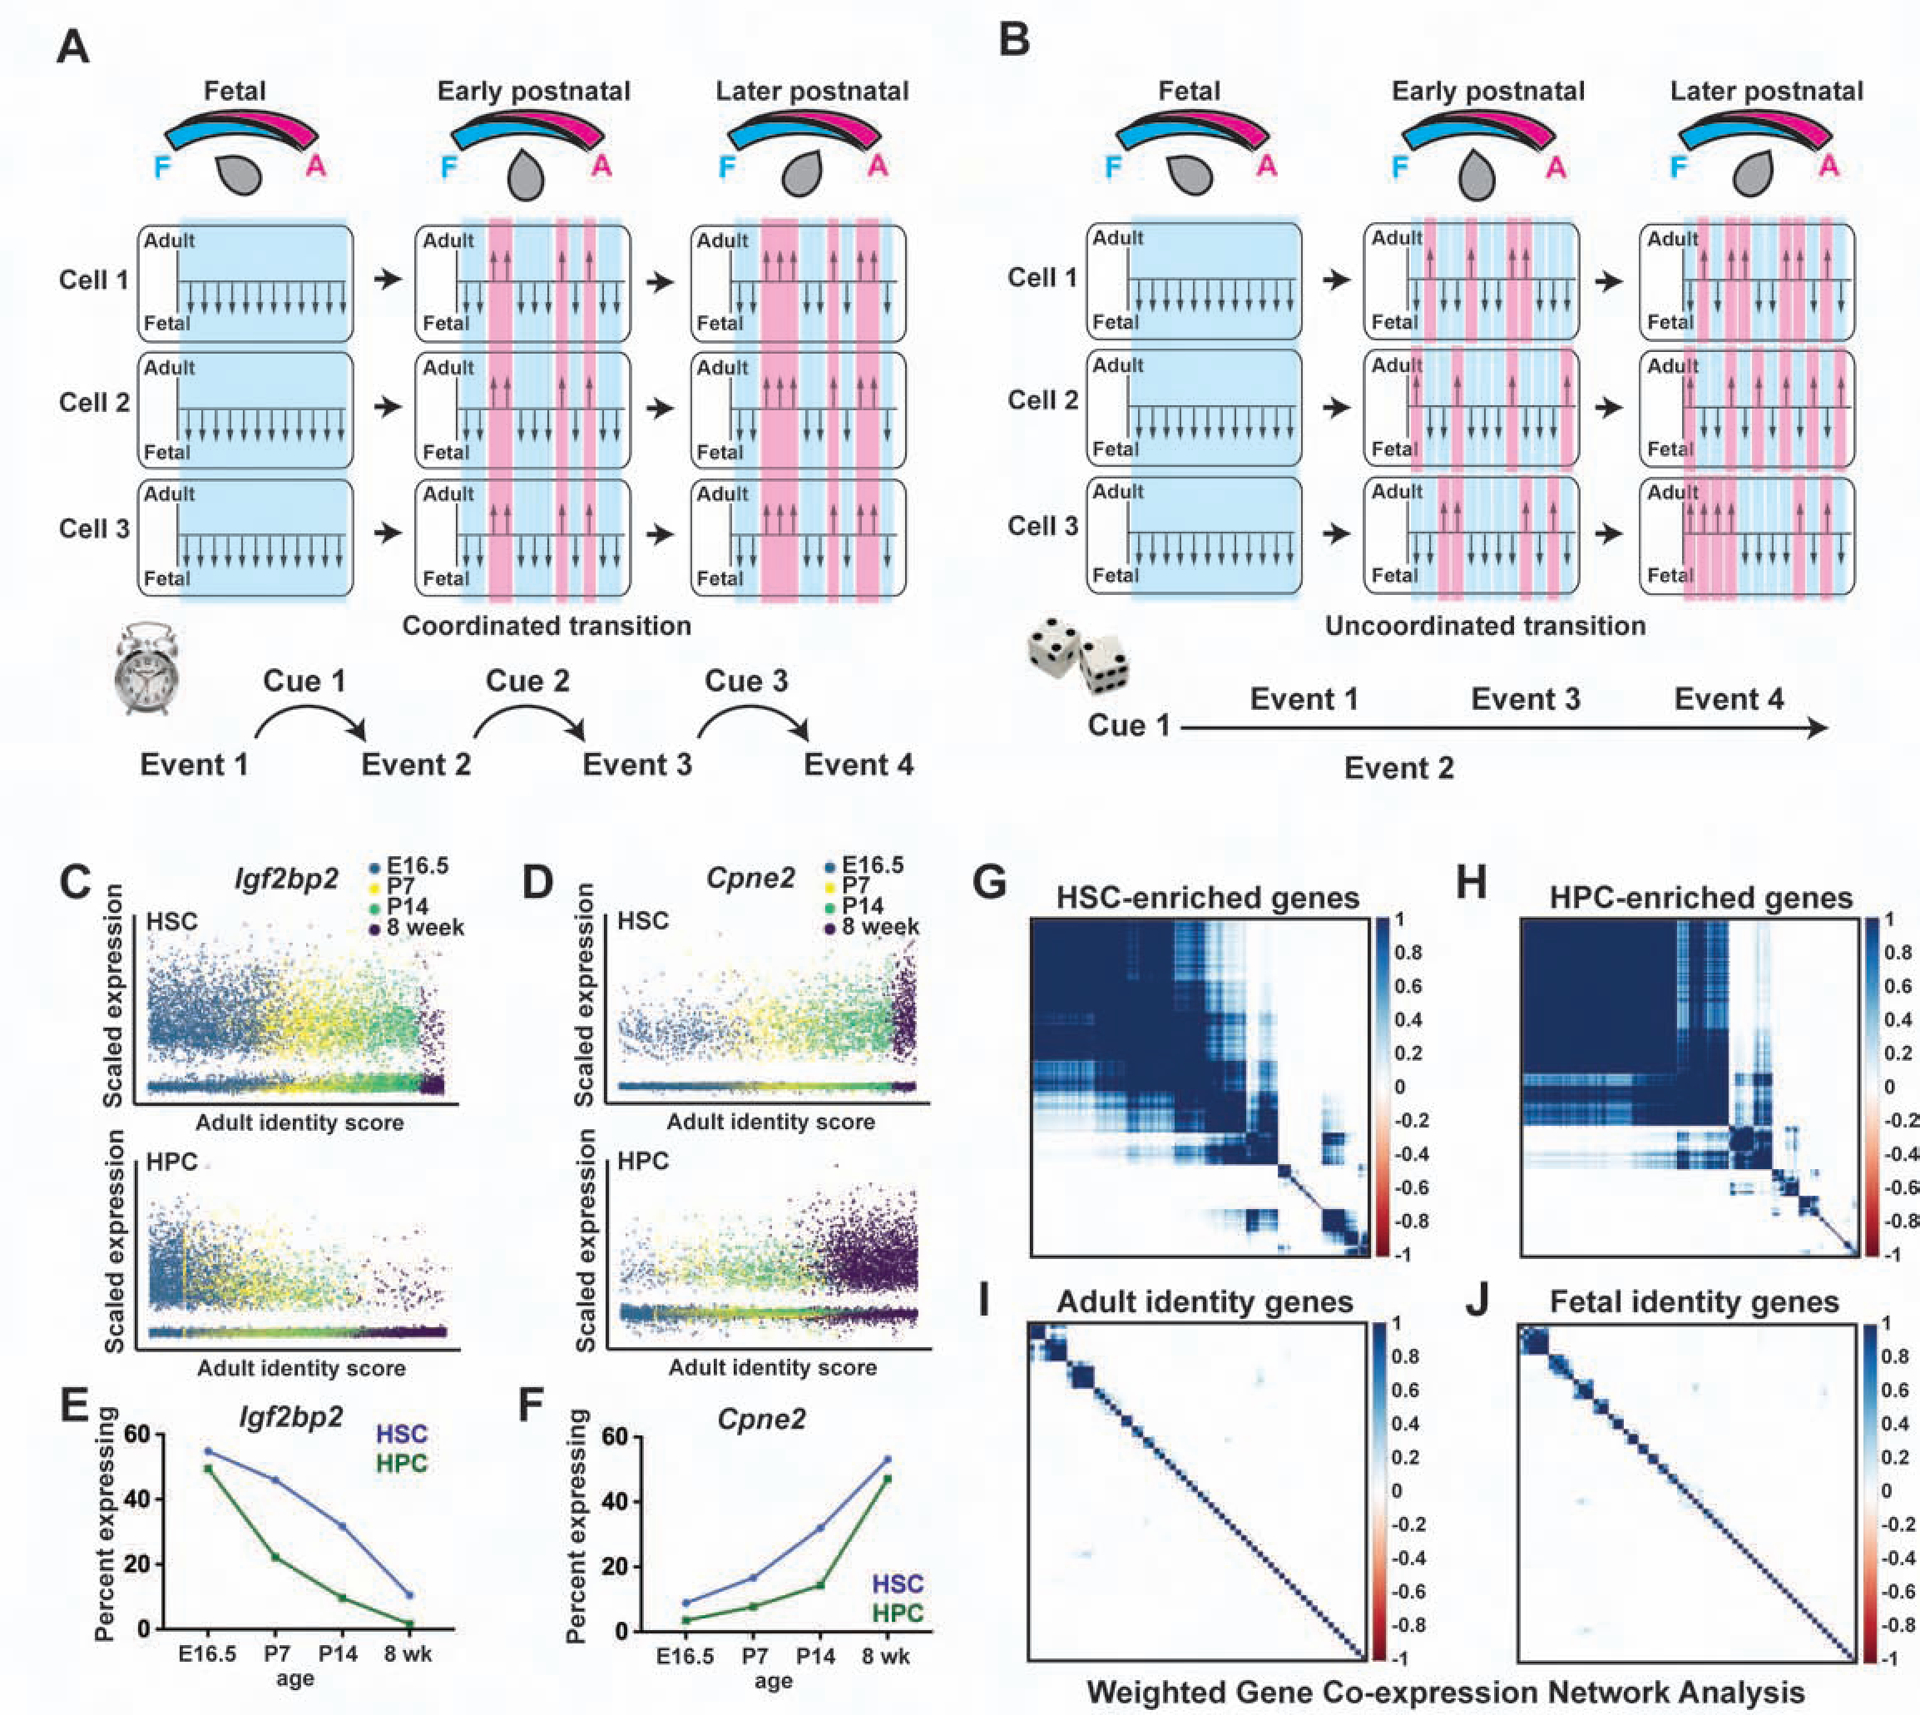
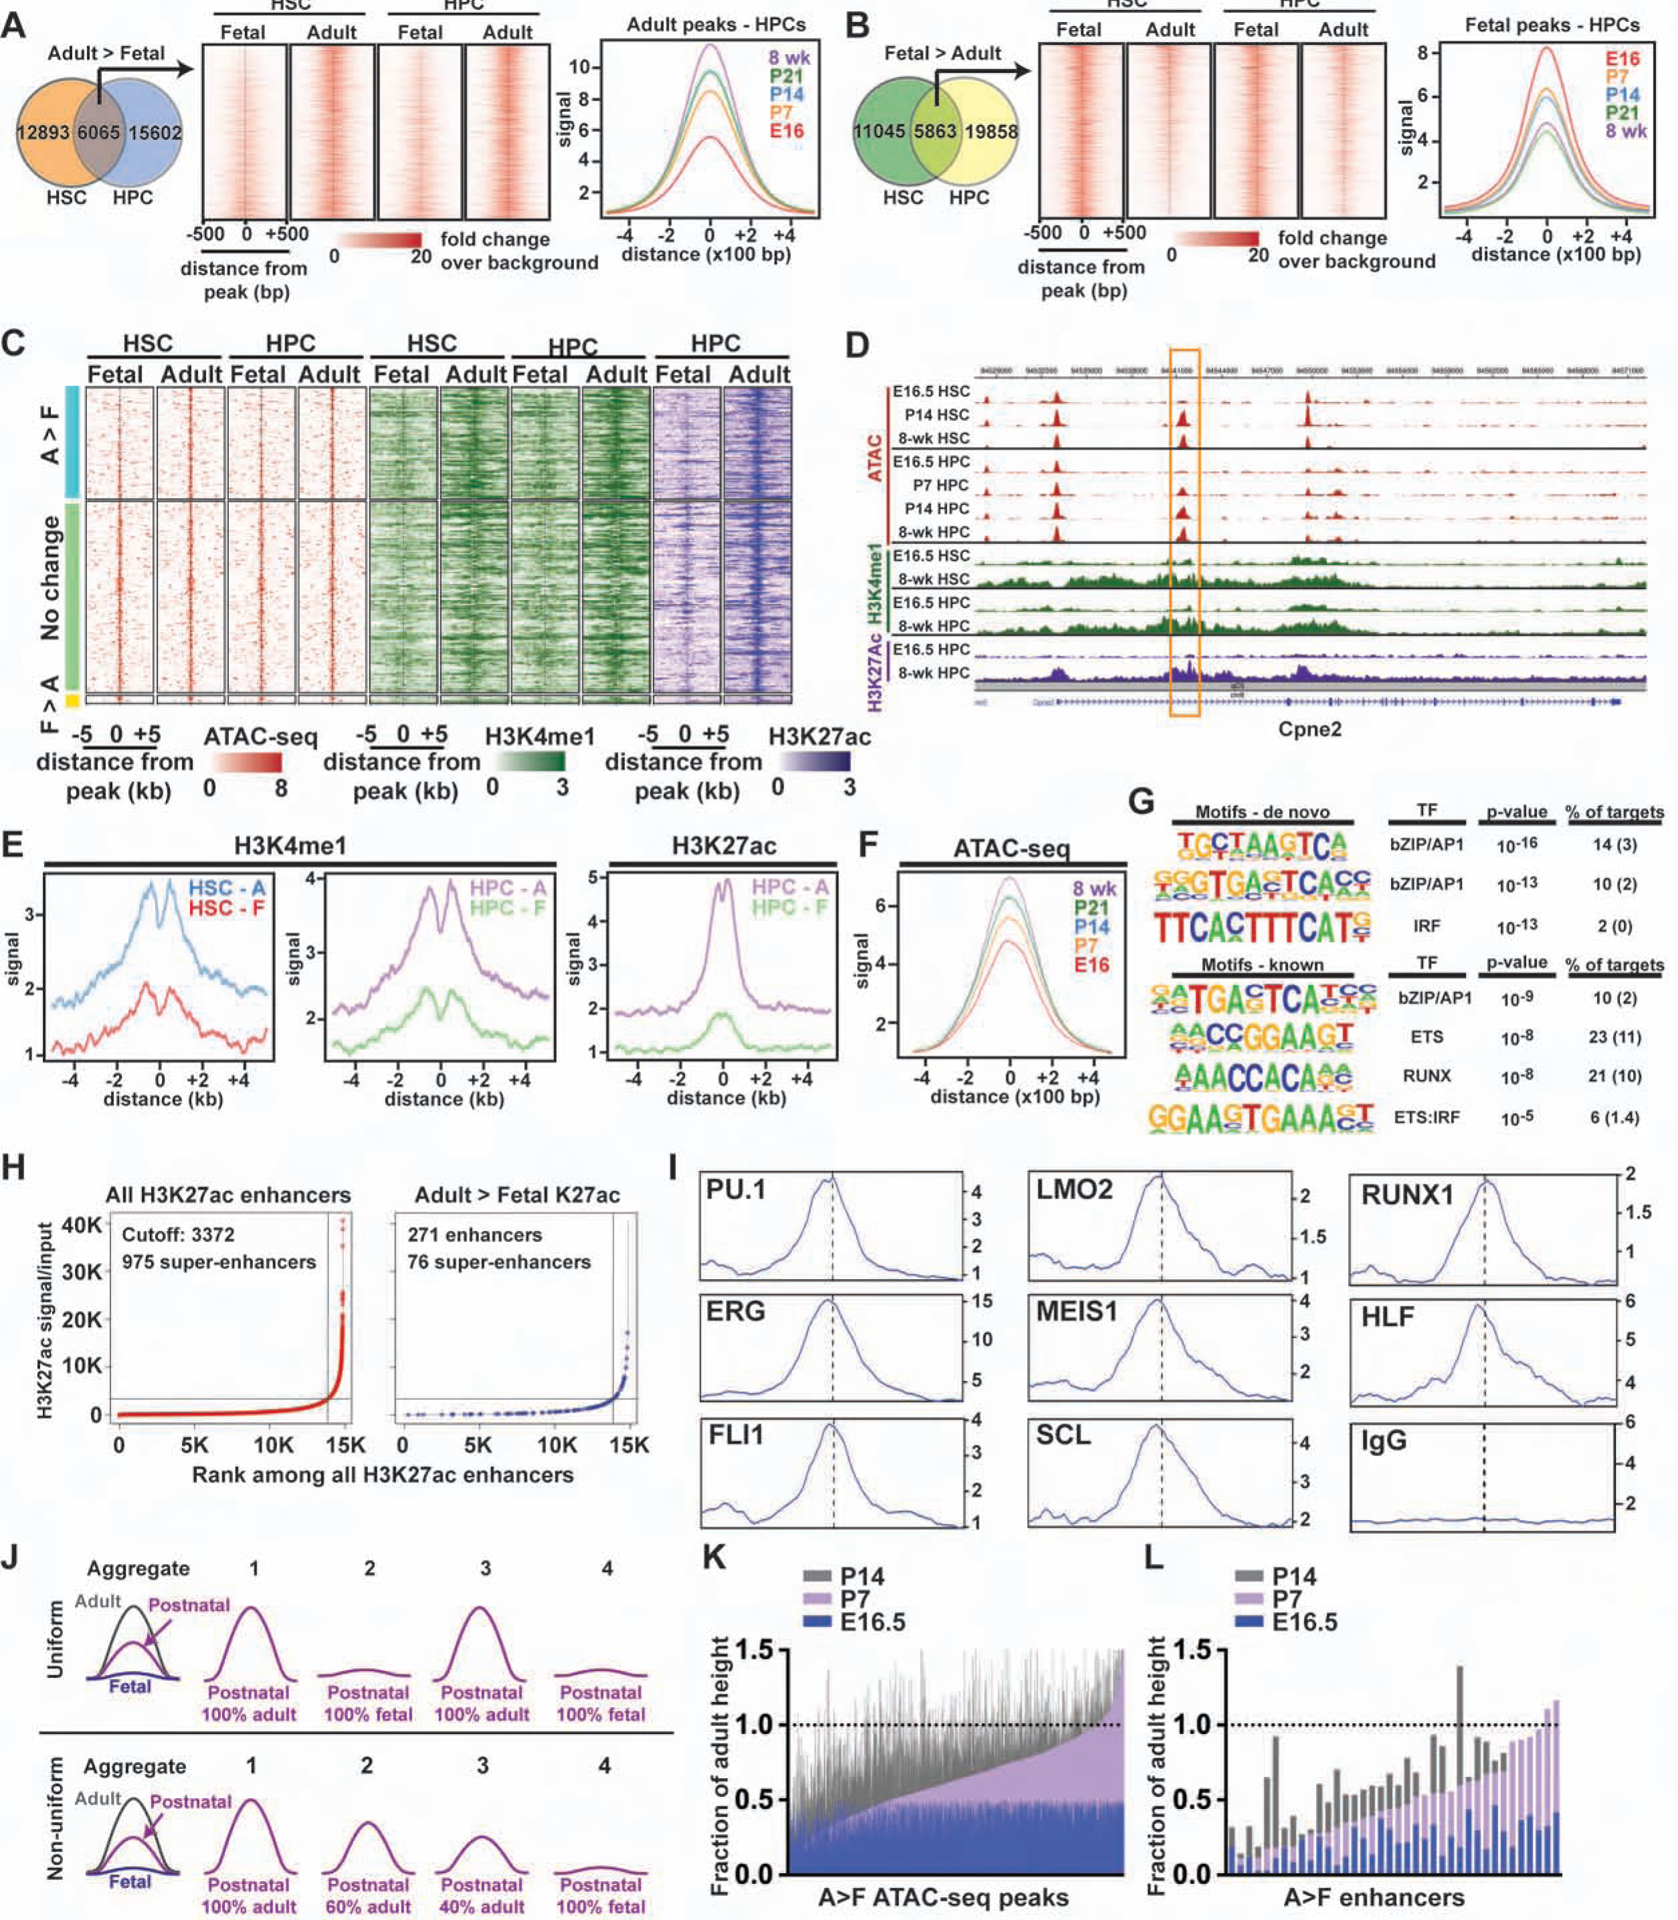
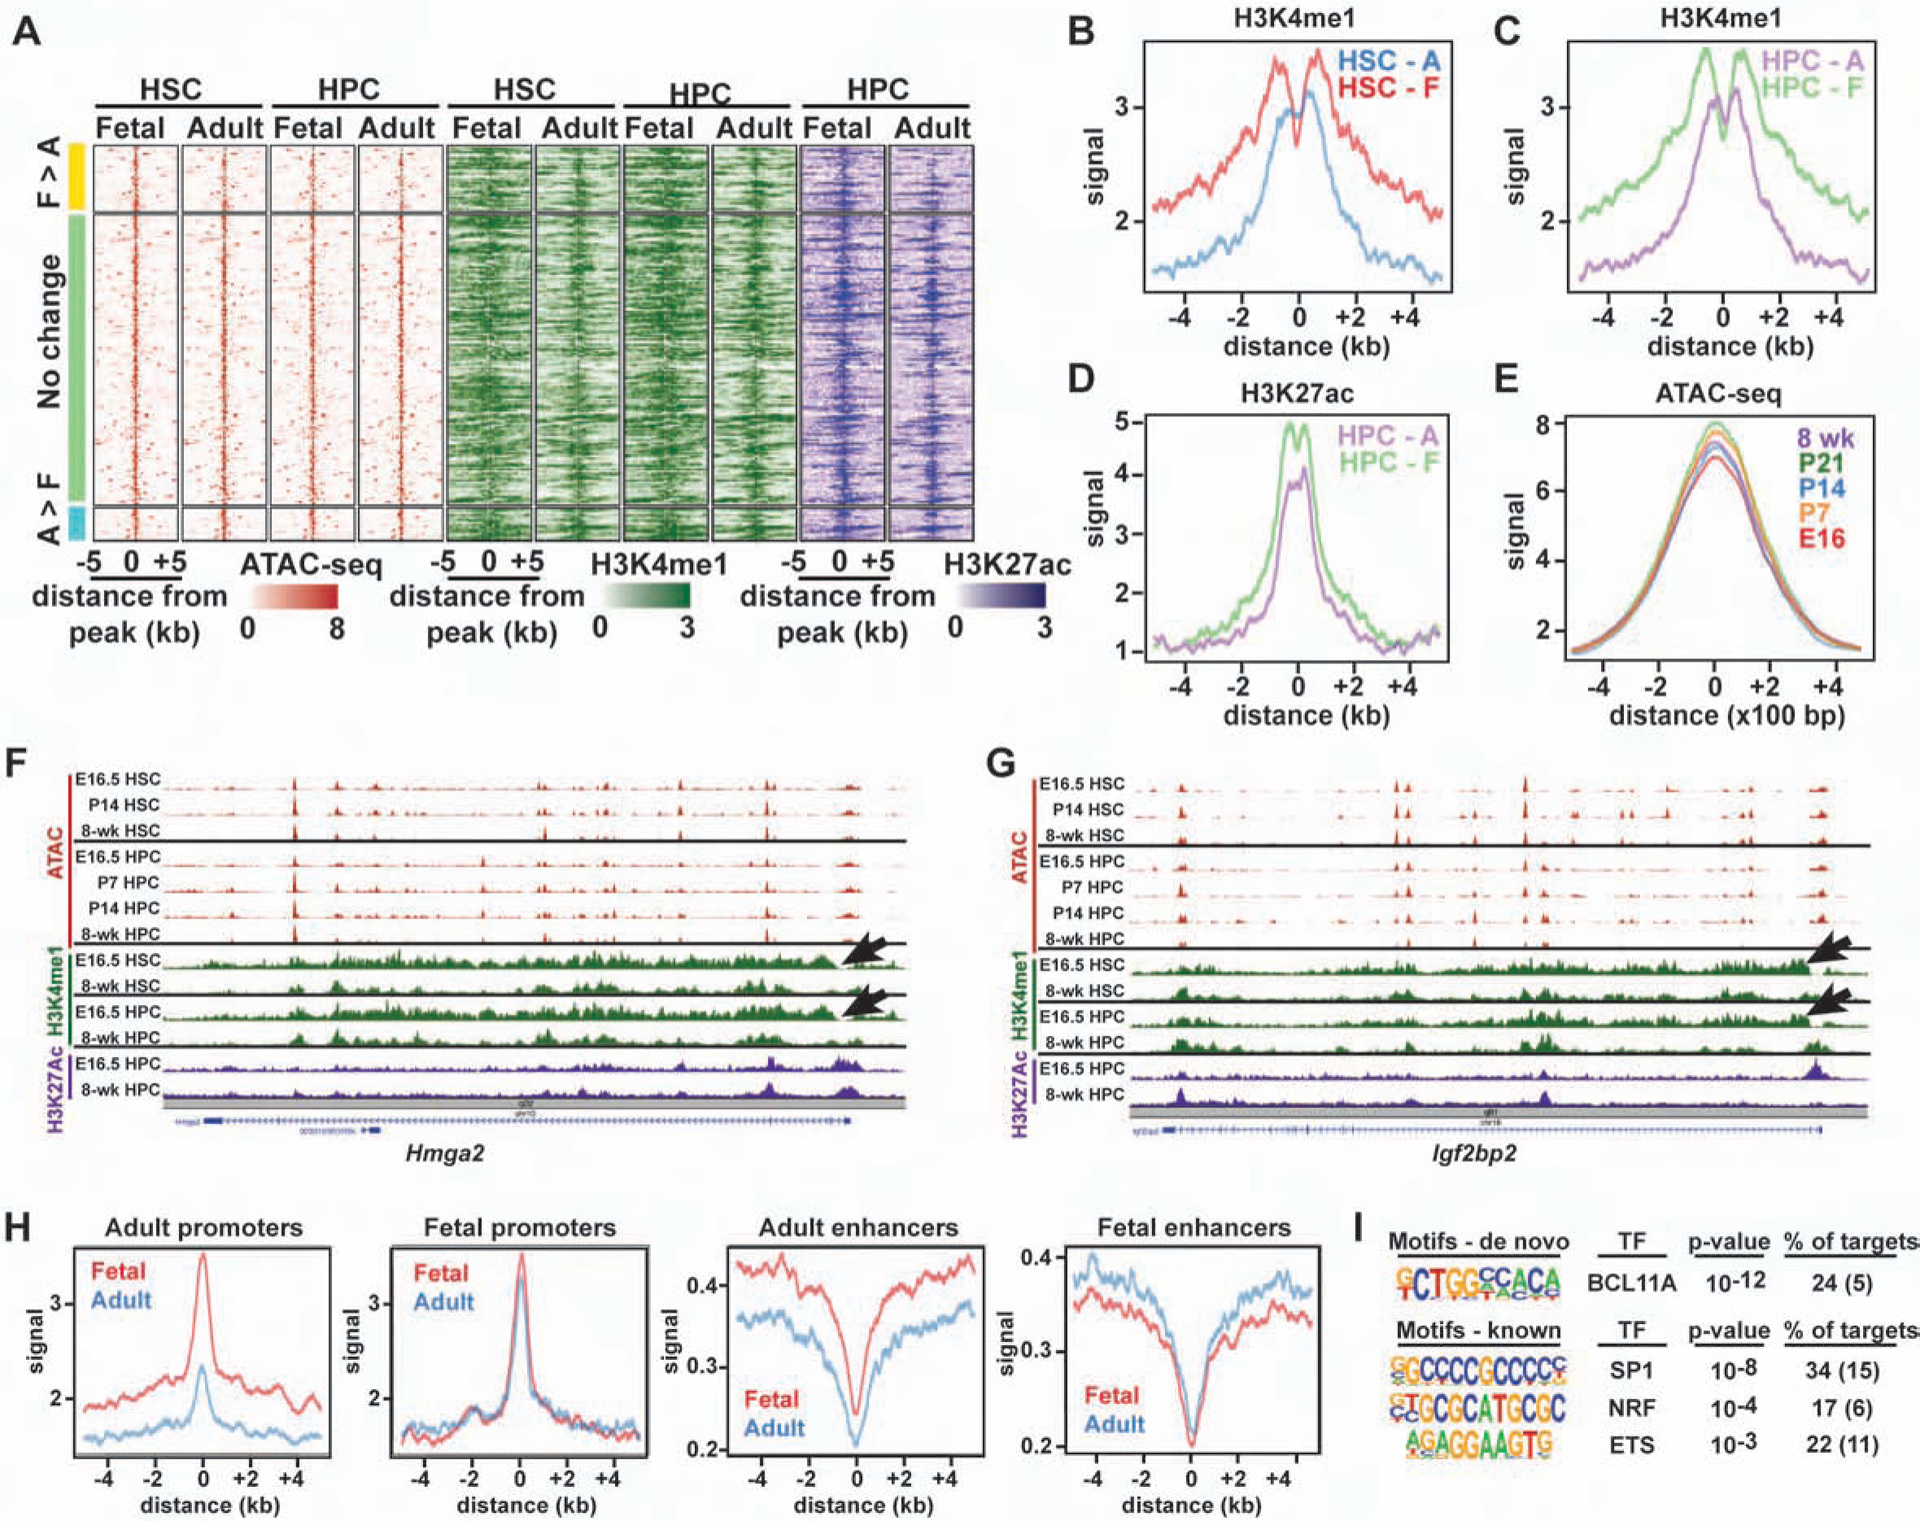
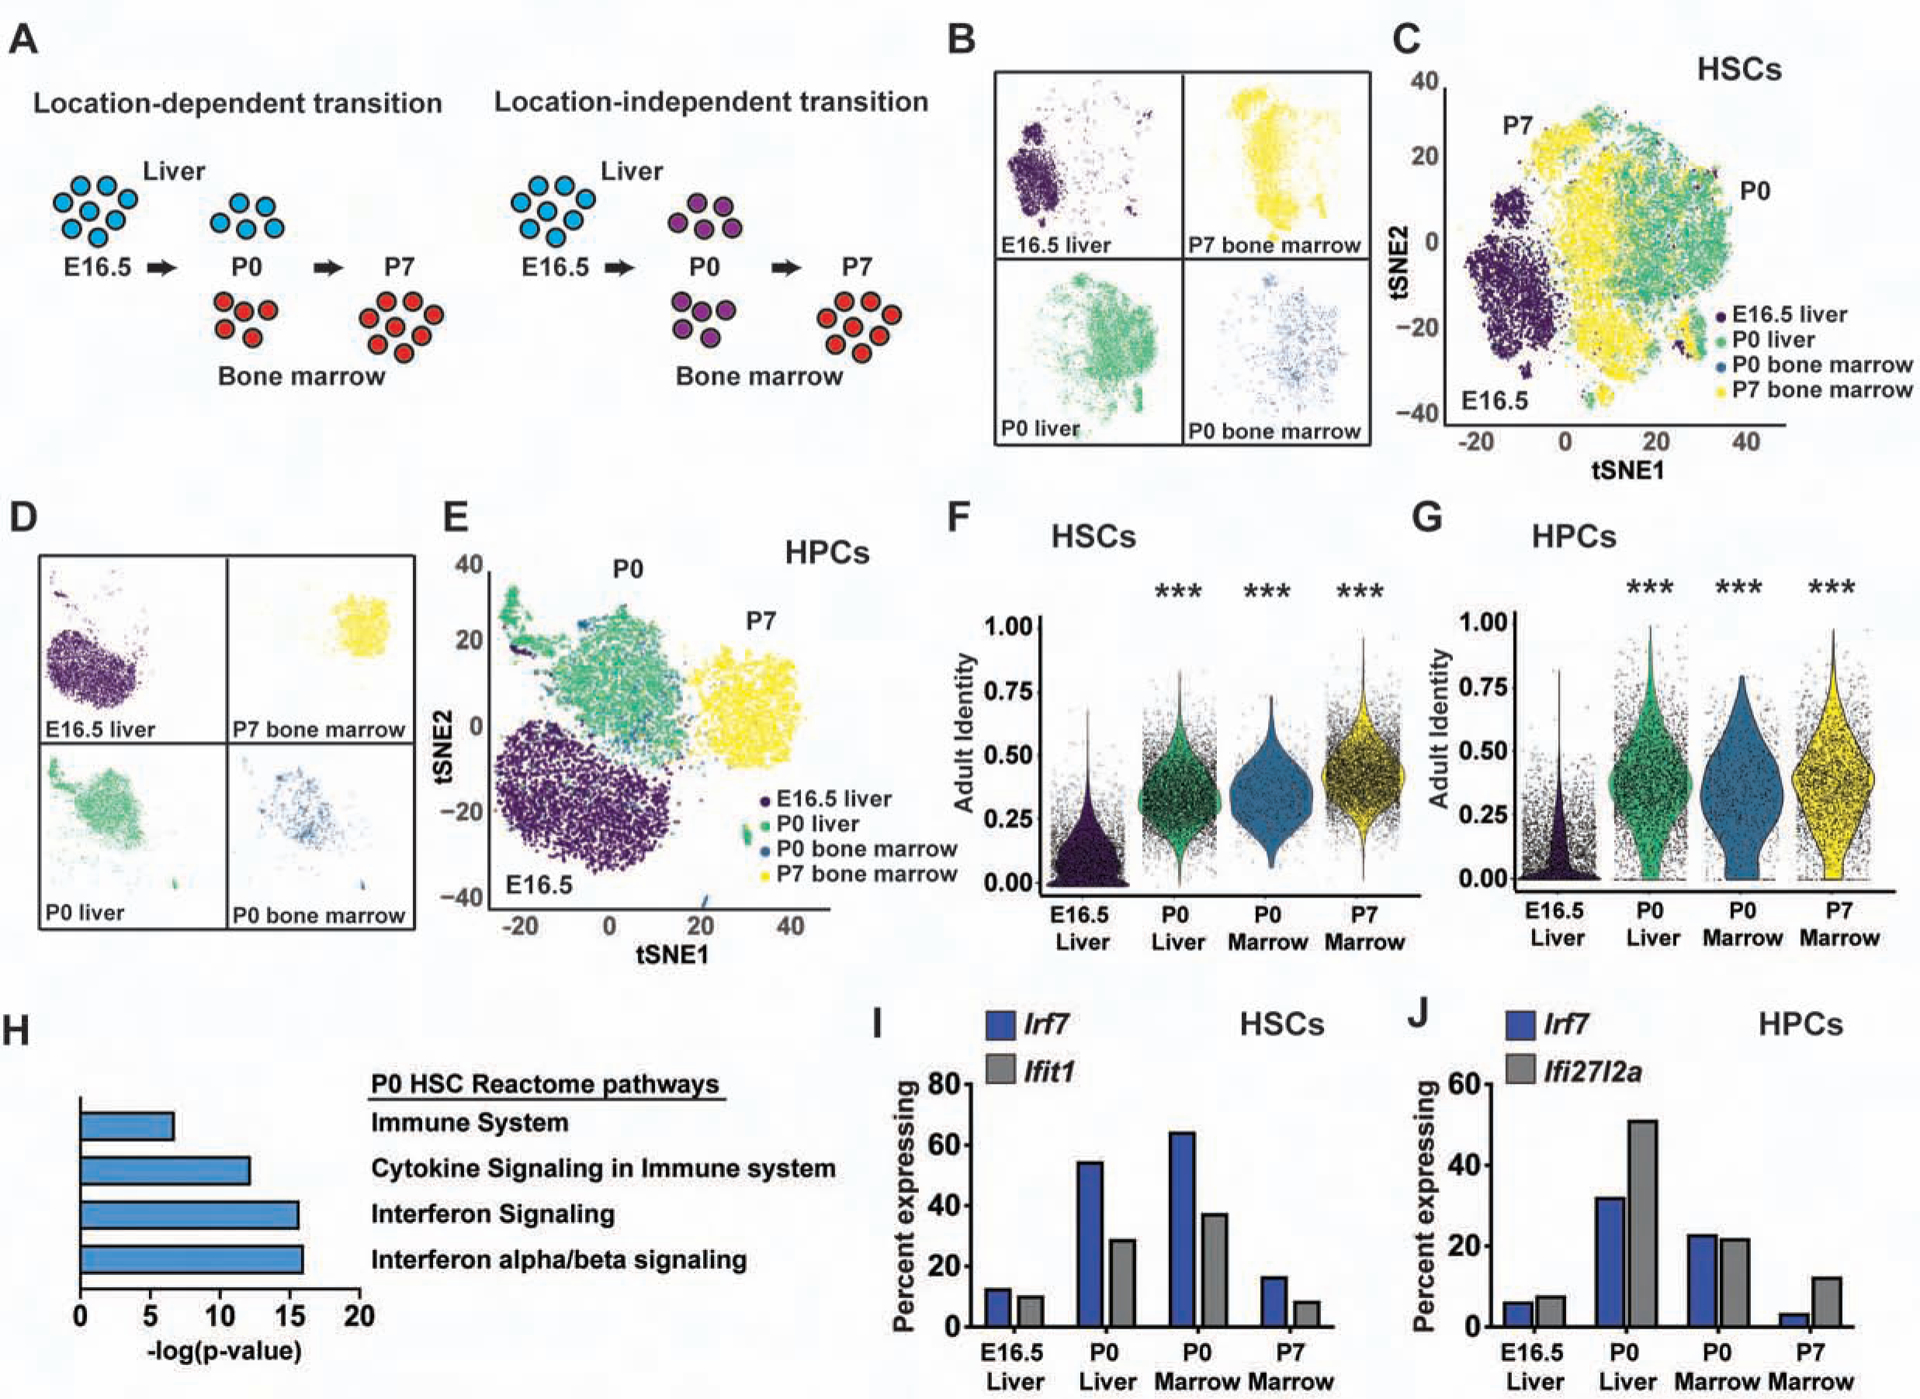
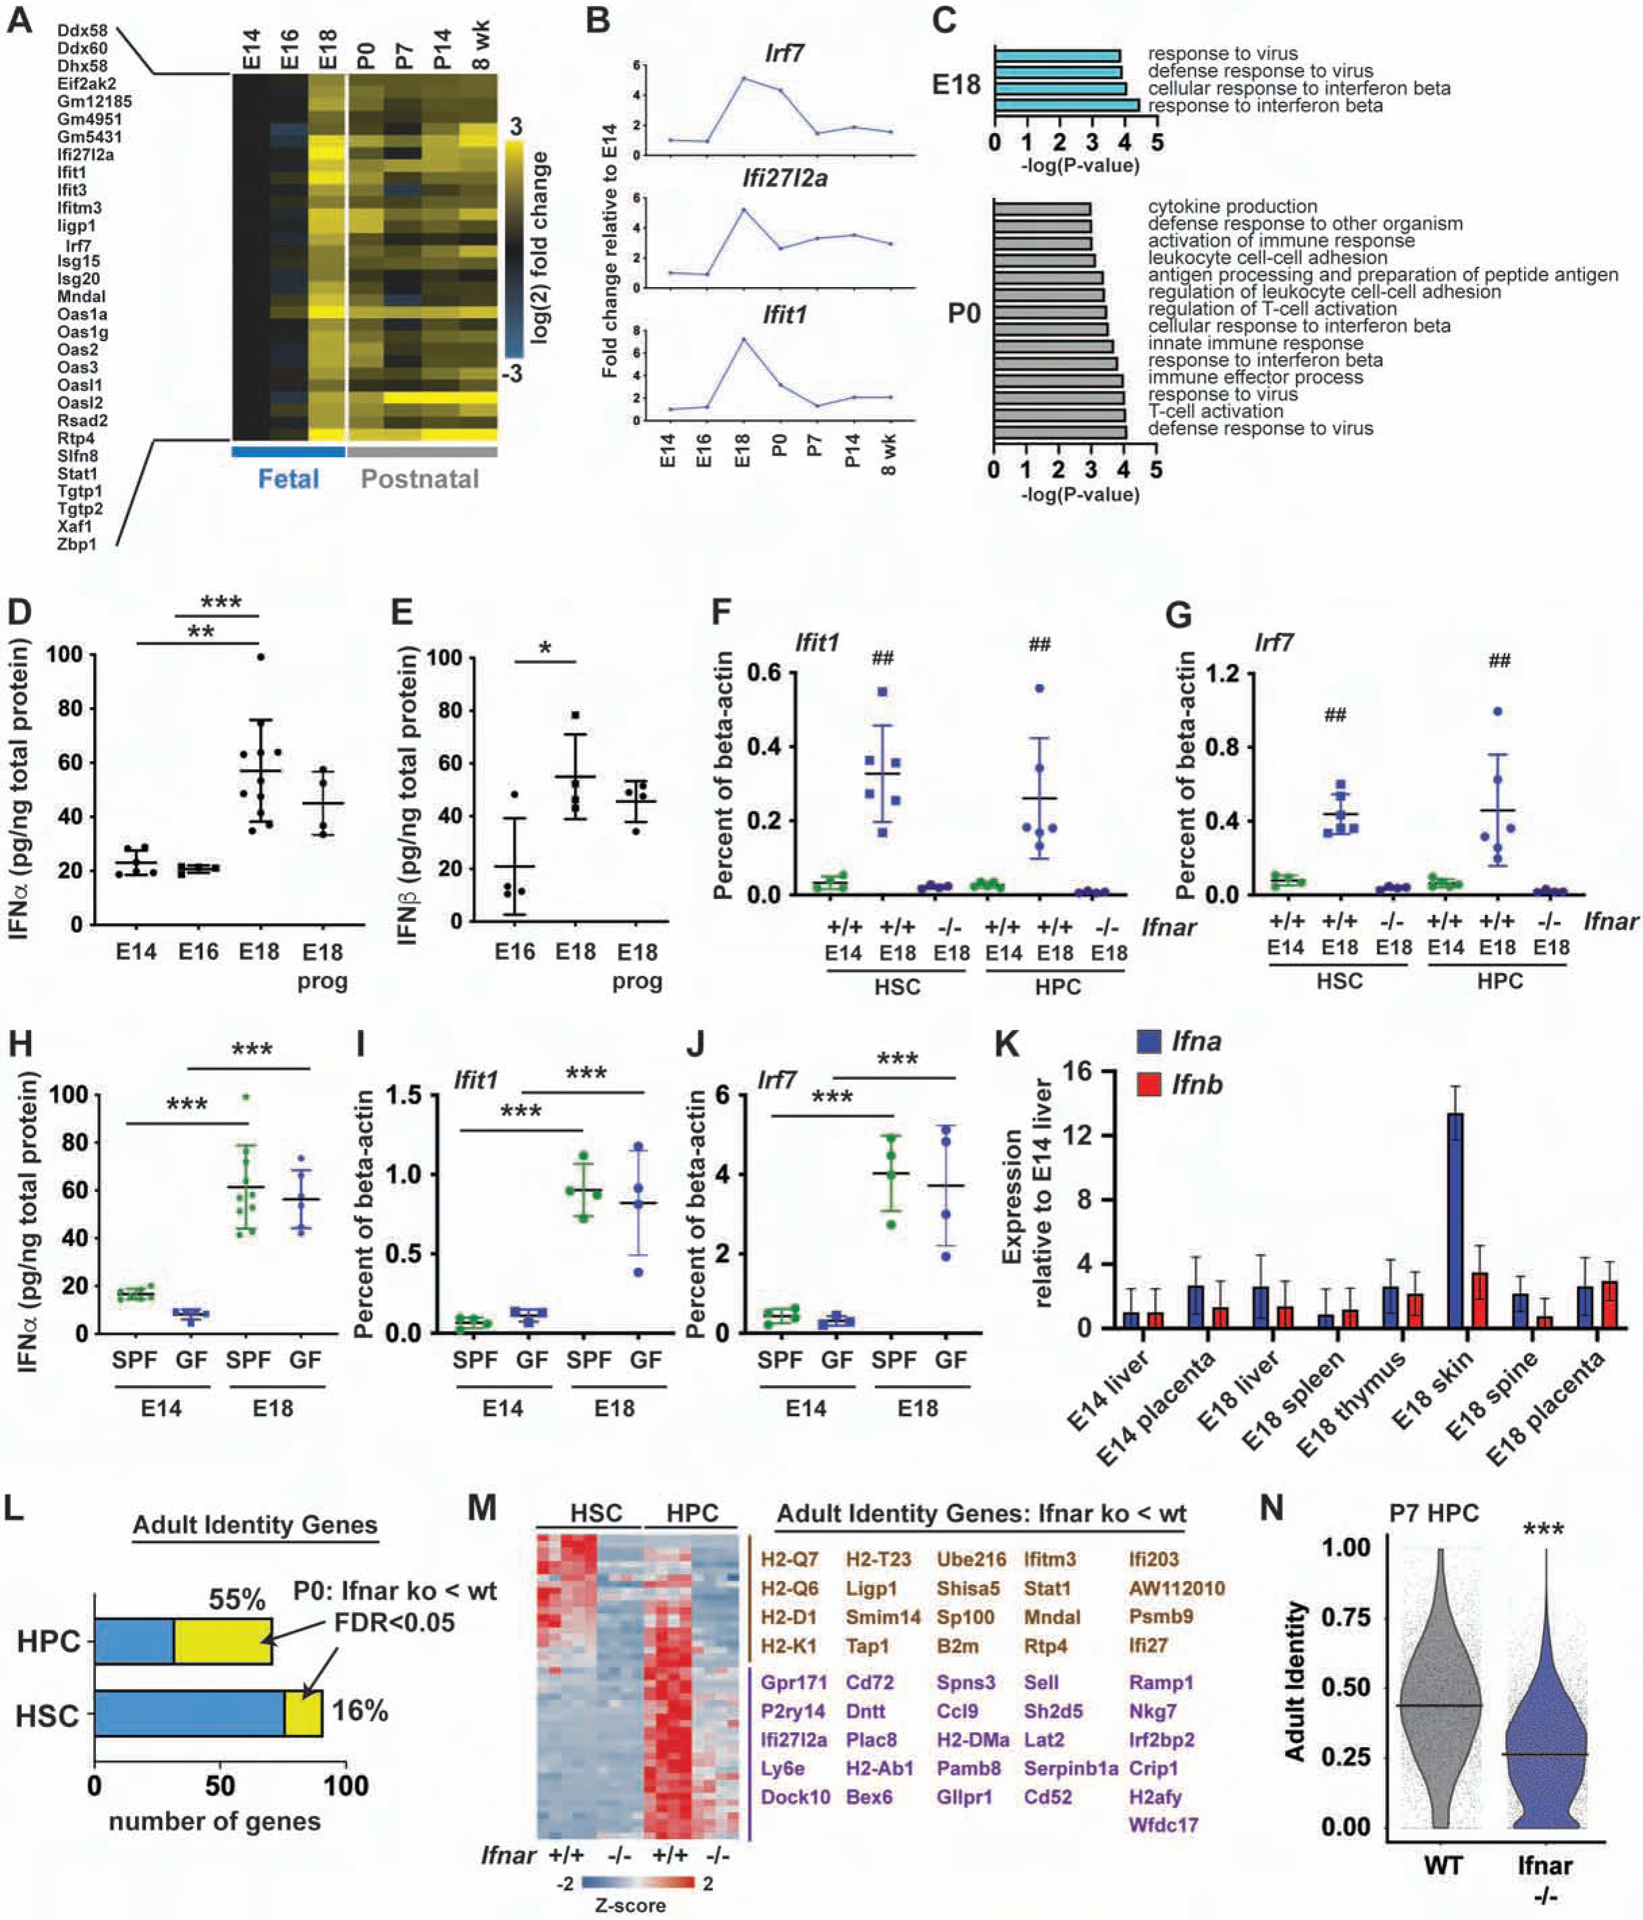
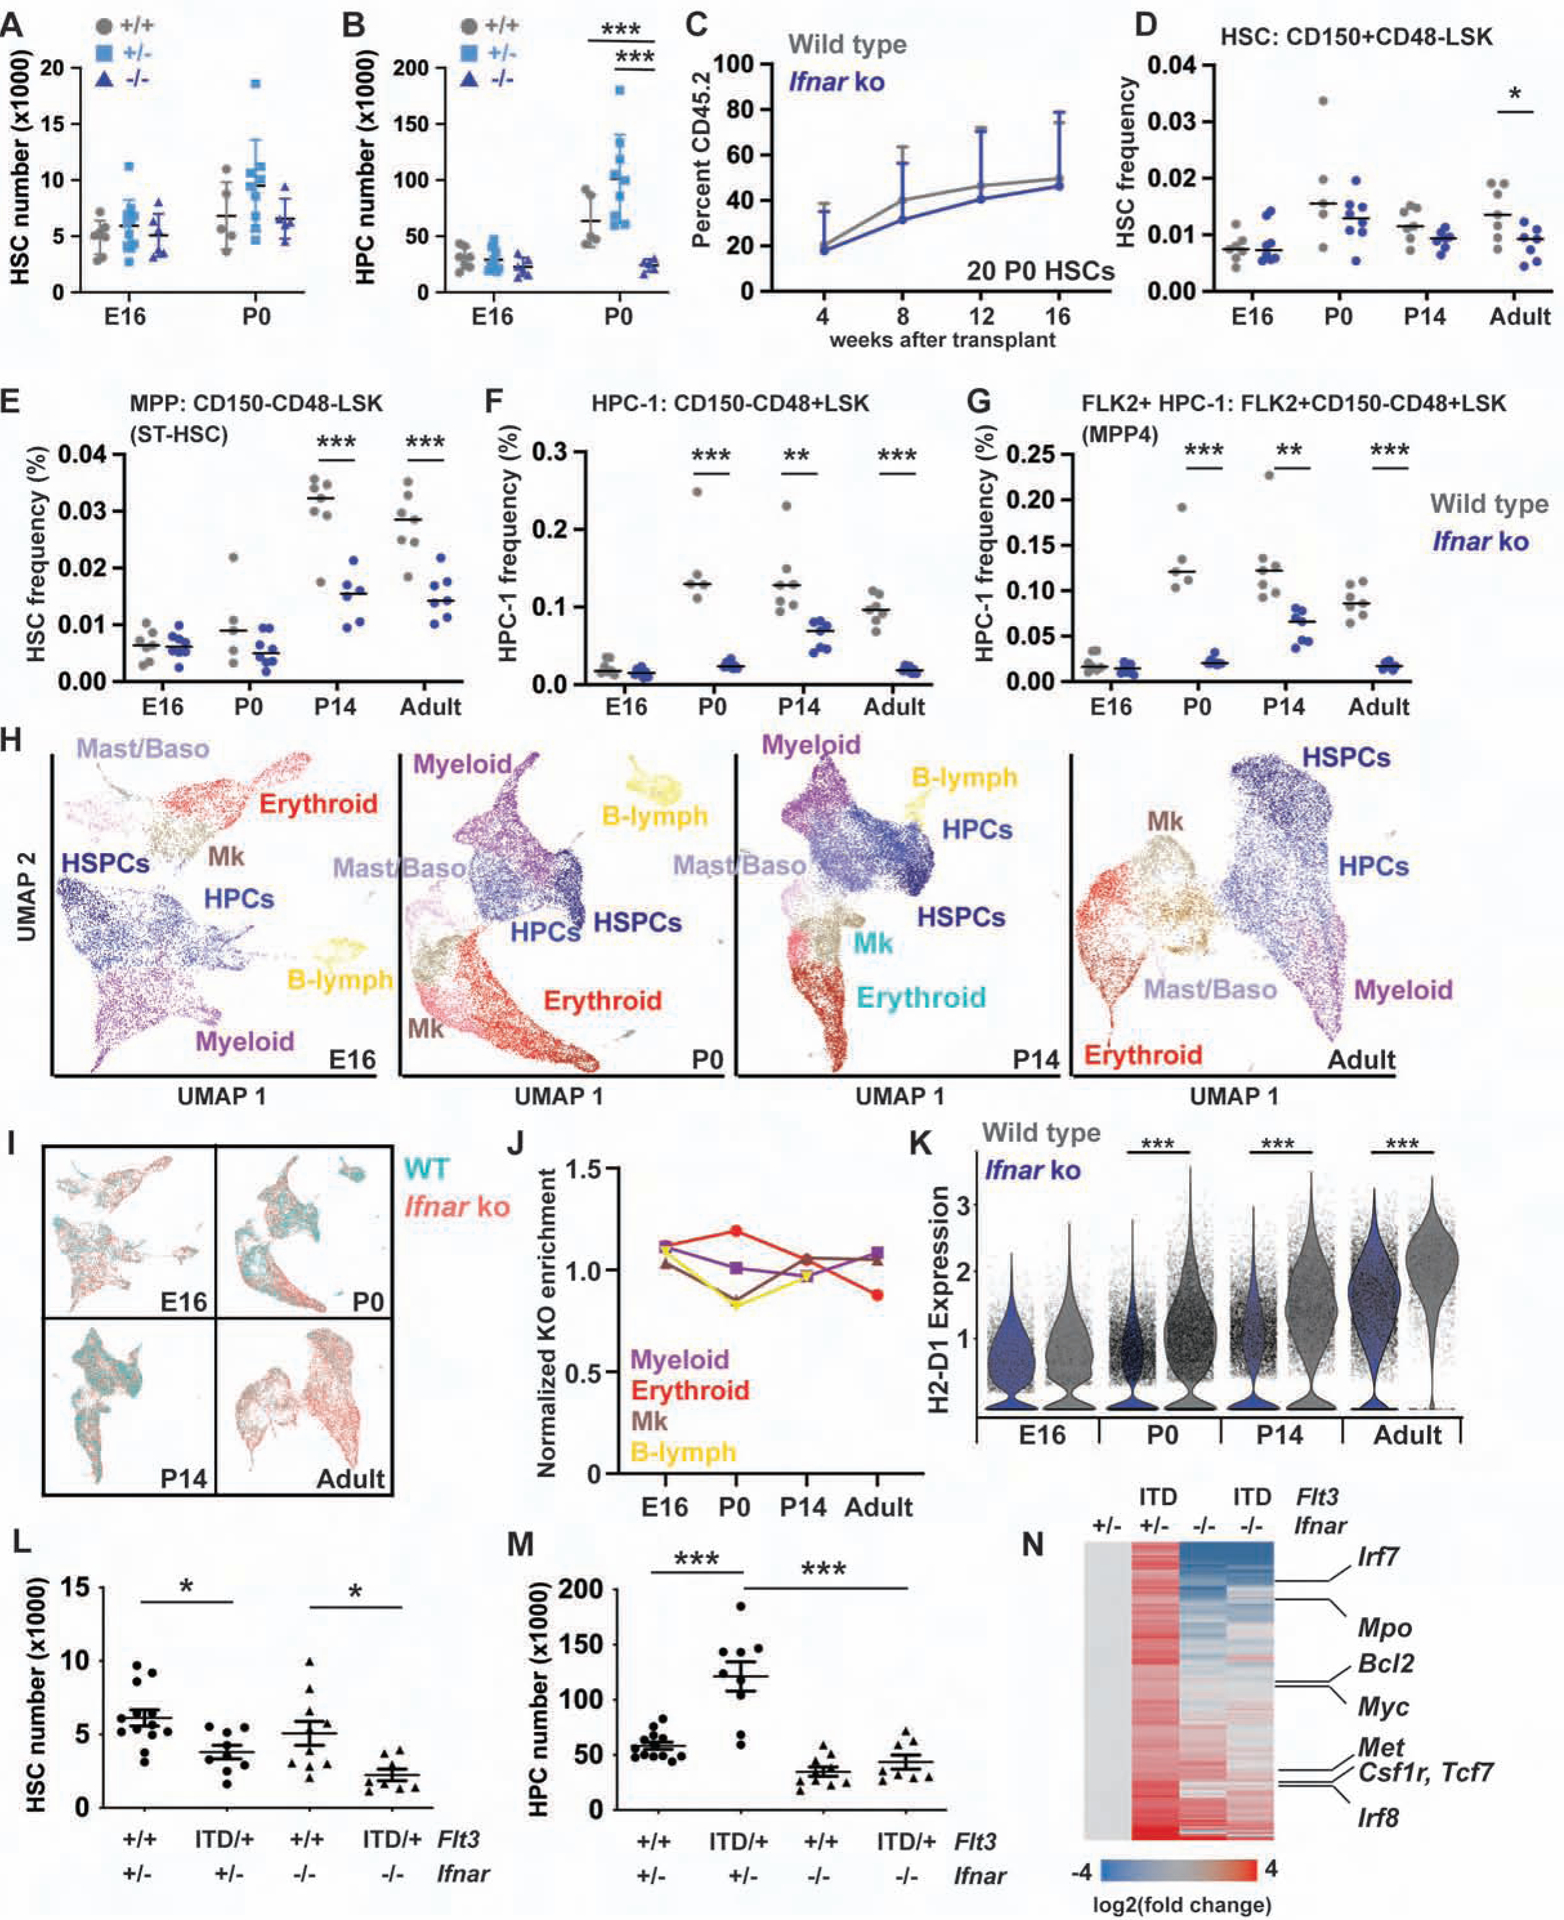
Fetal and adult hematopoietic stem cells (HSCs) have distinct proliferation rates, lineage biases, gene expression profiles, and gene dependencies. Although these differences are widely recognized, it is not clear how the transition from fetal to adult identity is coordinated. Here we show that murine HSCs and committed hematopoietic progenitor cells (HPCs) undergo a gradual, rather than precipitous, transition from fetal to adult transcriptional states. The transition begins prior to birth and is punctuated by a late prenatal spike in type I interferon signaling that promotes perinatal HPC expansion and sensitizes progenitors to the leukemogenic FLT3ITD mutation. Most other changes in gene expression and enhancer activation are imprecisely timed and poorly coordinated. Thus, heterochronic enhancer elements, and their associated transcripts, are activated independently of one another rather than as part of a robust network. This simplifies the regulatory programs that guide neonatal HSC/HPC ontogeny, but it creates heterogeneity within these populations.

Keywords: HSC development; interferon; neonatal hematopoiesis; single cell RNA-seq.


Conflict of interest statement

Declaration of Interests The authors declare no competing interests.

Figures

Figure 1.
Figure 1.. The transition from fetal to adult HSC/HPC identity is gradual.
(A) Overview of scRNA-seq experiments. (B) scRNA-seq can resolve an asynchronous, bimodal transition from a synchronous, graded transition. (C, D) Postnatal HSCs/HPCs cluster separately from fetal and adult HSCS/HPCs. (E-H) Adult identity scores for HSCs (E, F) and HPCs (G, H); p<0.0001 for all comparisons. (I) Adult identity scores based on randomly selected genes from groups that exhibited low or high variability. (J) ICGS analysis of the HSC scRNA-seq timecourse. The heatmap illustrates four clusters of cells with Reactome pathway analysis of the guide genes shown to the right. (K) Twenty-four-hour BrdU incorporation in HSCs at the indicated ages. Error bars show standard deviation. *p<0.05, **p<0.01, ****p<0.0001 by one-way ANOVA and Holm-Sidak post-hoc test. See also Figures S1 and S2, and Table S1, S2 and S3.
Figure 2.
Figure 2.. Fetal identity genes are inactivated, and adult genes are activated, in an uncoordinated manner.
(A) Schematic overview of a coordinated transition from fetal to adult identity. As cells become older, individual genes or enhancers (shown as arrows) convert from a fetal-like to an adult-like state. The changes are uniform and precisely timed. (B) Schematic overview of an uncoordinated transition. As cells become more adult-like, individual genes convert from a fetal-like to an adult-like state non-uniformly. (C, D) Expression of Igf2bp2 and Cpne2 as a function of adult identity scores. (E, F) The fraction of Igf2bp2-expressing HSCs/HPCs declines with age, and the fraction Cpne2-expressing HSCs/HPCs increases with age. (G, H) WGCNA for genes that are differentially expressed during HSC to HPC differentiation, with correlation co-efficients indicating modular patterns of co-expression. (I, J) Fetal and adult identity genes do not exhibit patterns of co-expression. See also Figure S3.
Figure 3.
Figure 3.. Neonatal HSC/HPC epigenome remodeling is gradual and uncoordinated.
(A, B) ATAC-seq analysis of HSCs and HPCs at the indicated ages. Temporal changes in aggregate peak heights were gradual for both adult (A) and fetal (B) peaks. (C) ATAC-seq (red), H3K4me1 (green) and H3K27ac (purple) peaks for enhancers that map within 100 kB of adult identity genes. Most enhancers were either more accessible in adult HSCs/HPCs relative to fetal HSCs/HPCs (A>F) or exhibited no change in accessibility. (D) Representative tracks for the adult identity gene Cpne2, including a putative intron 1 enhancer (box). (E) Aggregate H3K4me1 and H3K27ac peaks for adult enhancers at the indicated ages. (F) Histogram showing that accessibility of A>F enhancers increased gradually with age. (G) HOMER analysis of adult enhancer elements. Parentheses indicate background. (H) ROSE analysis of all enhancer elements and adult-specific enhancer elements, as determined by adult > fetal H3K27ac. (I) Histograms indicating hematopoietic transcription factor binding at adult enhancer elements. (J) A model for how aggregate ATAC-seq profiles can reflect uniform or non-uniform changes in chromatin remodeling. (K, L) Heights for individual adult > fetal ATAC-seq peaks (K), or adult enhancers (L) with at least a 2-fold dynamic range, are shown normalized to the adult peak height.
Figure 4.
Figure 4.. Fetal identity gene enhancers remain accessible and primed in adult HSCs and HPCs.
(A) ATAC-seq (red), H3K4me1 (green) and H3K27ac (purple) peaks for enhancers that map within 100 kB of fetal identity genes. (B-D) Aggregate H3K4me1 and H3K27ac levels in adult HSCs and HPCs. (E) Aggregate ATAC-seq profiles for the same enhancers. (F, G) The gene bodies of Hmga2 and Igf2bp2 have qualitatively higher H3K4me1 in fetal HSCs and HPCs (arrows). (H) Aggregate histograms of H3K27me3 at promoters and enhancers associated with fetal and adult identity genes. (I) HOMER analysis of fetal identity gene promoters.
Figure 5.
Figure 5.. The transition from fetal to adult identity begins prior to birth and coincides with a transient pulse in type I IFN target gene expression.
(A) Overview of scRNA-seq profiles for location-dependent and location-independent transitions. (B-E) P0 liver and bone marrow HSCs (B, C) and HPCs (D, E) cluster together, and separate from both E16.5 and P7 HSCs/HPCs. (F, G) Adult identity scores for E16.5 liver, P0 liver, P0 bone marrow and P7 bone marrow HSCs and HPCs. ***p<0.0001 relative to E16.5; two-tailed Student’s t-test. (H) Reactome pathway analysis of genes expressed higher in P0 HSCs than E16.5 and P7 HSCs (FDR <0.001). (I, J) Percentages of HSCs and HPCs at each age with detectable Irf7, Ifit1 and Ifi27l2a expression. See also Figure S4, Tables S1 and S4.
Figure 6.
Figure 6.. Type I IFN signaling spikes at E18 and promotes adult identity gene expression.
(A) IFN target gene expression in HSCs at indicated ages. n=4. (B) Irf7, Ifi27l2a and Ifit1 expression. (C) Biological process genes sets up in E18.5 or P0 HSCs relative to E16.5 (FDR<0.001). (D, E) IFNα and IFNβ levels in fetal livers at E14.5, E16.5 and E18.5 (+/− progesterone). n=4–10. (F, G) Ifit1 and Irf7 expression in wild type and Ifnar1−/− HSCs/HPCs at E14.5 and E18.5. n=4–6. (H) IFNα expression in E14 and E18 fetal livers from standard pathogen free “SPF” or germ free “GF” mothers. n=5–10. (I, J) Ifit1 and Irf7 expression in HSCs/HPCs from SPF and GF mice. n=3–4. (K) Expression of pan-Ifna and Ifnb1 in indicated tissues, normalized to E14 liver. n=3 (L) Percent of Ifnar-dependent adult identity genes in P0 HSCs and HPCs. (M) Ifnar-dependent adult identity genes (HPC-specific genes in purple, HSC/HPC genes in brown). (N) Adult identity scores for P7 wild type and Ifnar1−/− HPCs. All error bars indicate standard deviations. *p<0.05, **p<0.01 and ***p<0.0001; for panels F and G, ## reflects p<0.001 for E18.5 wild type HSCs/HPCs, relative to E14.5 wild type and E18.5 Ifnar−/− HSCs/HPCs. All comparisons were made by one-way ANOVA with Holm-Sidak post-hoc testing (panels D-J) or a two-tailed Student’s t-test (panel N). See also Figure S5 and Tables S1 and S5.
Figure 7.
Figure 7.. Ifnar deletion impairs perinatal HPC expansion and MHC-I expression, and it prevents FLT3ITD-driven HPC expansion.
(A, B) HSC and HPC numbers in E16 and P0, wild type, Ifnar+/− and Ifnar−/− livers. n=5–9. (C) Peripheral blood reconstitution from P0 wild type and Ifnar−/− HSCs. n=12–14. (D-G) HSC, MPP, HPC-1 and FLK2+HPC-1 frequencies in wild type and Ifnar−/− mice at E16, P0, P14 and 8-weeks old. n=5–8. (H) UMAP plots of Lineagec-kit+ cells based on scRNA-seq transcriptomes at E16, P0, P14 and 8-weeks old. Clusters are color coded based on expression of known lineage markers (see Figure S7C for the adult example). (I) UMAP plots, as in H, with color coding to indicate wild type and Ifnar−/− cells. (J) Normalized frequencies of Ifnar−/− cells in each lineage biased population. (K) H2-D1 expression in wild type and Ifnar−/− Lineagec-kit+ cells at indicated ages. (L, M) Hindlimb HSC/HPC-1 numbers in P14 Flt3 and Ifnar mutant mice. n=8–13. (N) Gene expression changes for Ifnar-dependent FLT3ITD targets. Genes involved in AML pathogenesis are indicated to the right. All error bars indicate standard deviations. *p<0.05, **p<0.01 and ***p<0.001; comparisons by one-way ANOVA (A, B) or a two-tailed Student’s t-test (D-G, K) with Holm-Sidak post-hoc testing. See also Figures S6 and S7, and Tables S1, S6 and S7.

Comment in

References

    1. Barber CL, Montecino-Rodriguez E, and Dorshkind K (2011). Reduced production of B-1-specified common lymphoid progenitors results in diminished potential of adult marrow to generate B-1 cells. Proc Natl Acad Sci U S A 108, 13700–13704. - PMC - PubMed
    1. Beaudin AE, Boyer SW, Perez-Cunningham J, Hernandez GE, Derderian SC, Jujjavarapu C, Aaserude E, MacKenzie T, and Forsberg EC (2016). A Transient Developmental Hematopoietic Stem Cell Gives Rise to Innate-like B and T Cells. Cell Stem Cell 19, 768–783. - PMC - PubMed
    1. Becht E, McInnes L, Healy J, Dutertre CA, Kwok IWH, Ng LG, Ginhoux F, and Newell EW (2018). Dimensionality reduction for visualizing single-cell data using UMAP. Nat Biotechnol. - PubMed
    1. Benz C, Copley MR, Kent DG, Wohrer S, Cortes A, Aghaeepour N, Ma E, Mader H, Rowe K, Day C, et al. (2012). Hematopoietic stem cell subtypes expand differentially during development and display distinct lymphopoietic programs. Cell Stem Cell 10, 273–283. - PubMed
    1. Biddy BA, Kong W, Kamimoto K, Guo C, Waye SE, Sun T, and Morris SA (2018). Single-cell mapping of lineage and identity in direct reprogramming. Nature 564, 219–224. - PMC - PubMed

Publication types