. 2020 Sep 9;28(3):422-433.e7.
doi: 10.1016/j.chom.2020.07.020. Epub 2020 Aug 20.

Multi-omic Analysis of the Interaction between Clostridioides difficile Infection and Pediatric Inflammatory Bowel Disease

Affiliations

Multi-omic Analysis of the Interaction between Clostridioides difficile Infection and Pediatric Inflammatory Bowel Disease

Frederic D Bushman et al. Cell Host Microbe. .

Abstract

Children with inflammatory bowel diseases (IBD) are particularly vulnerable to infection with Clostridioides difficile (CDI). IBD and IBD + CDI have overlapping symptoms but respond to distinctive treatments, highlighting the need for diagnostic biomarkers. Here, we studied pediatric patients with IBD and IBD + CDI, comparing longitudinal data on the gut microbiome, metabolome, and other measures. The microbiome is dysbiotic and heterogeneous in both disease states, but the metabolome reveals disease-specific patterns. The IBD group shows increased concentrations of markers of inflammation and tissue damage compared with healthy controls, and metabolic changes associate with susceptibility to CDI. In IBD + CDI, we detect both metabolites associated with inflammation/tissue damage and fermentation products produced by C. difficile. The most discriminating metabolite found is isocaproyltaurine, a covalent conjugate of a distinctive C. difficile fermentation product (isocaproate) and an amino acid associated with tissue damage (taurine), which may be useful as a joint marker of the two disease processes.

Keywords: Clostridioides difficile; Gram-positive; inflammatory bowel disease; isocaproate; isocaproyltaurine; metabolome; microbiome; taurine.


Conflict of interest statement

Declaration of Interests The authors declare no competing interests.

Figures
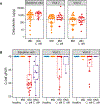
Figure 1.
Figure 1.
Patient response to therapy. A) Calprotectin values for the groups studied. Values are shown for the IBD group (yellow) and the IBD+CDI group (red). Times analyzed are shown above each plot. The dashed line indicates the healthy cut-off value. B) Levels of C. difficile DNA quantified using qPCR. The x-axis specifies the groups studied and the y-axis shows the qPCR cycle of threshold, so that lower values respresent higher amounts of C. difficile DNA. Here and below, “ONC” indicates the group with CDI and malignancy.
Figure 2.
Figure 2.
Longitudinal analysis of the fecal microbiome in patients with CDI and controls. A-C: PCoA plots based on the Bray-Curtis dissimilarity assessed using the microbiome data. All samples were used to make a common plot, then samples collected at study entry (baseline visit), 4 weeks (visit 2), and 8 weeks (visit 3) are each displayed separately. Samples are color coded to indicate the four study groups. The centroid of the healthy controls is marked by a black asterisk. The shape of the symbol indicates antibiotic use. D-F: Major taxa present in each sample at each time point. Bacterial lineages are color coded (bottom) and presented as stacked bar graphs. Clustering is based on the visit 3 time point. The names for each study group are color coded on the dendrogram. G: Microbial richness at baseline in each of the study groups, compared using normalized numbers of microbial reads. H: Longitudinal abundance of the proportion of human DNA in the samples studied. Points are coded by whether patients were on antibiotic therapy previously or at the time of sampling.
Figure 3.
Figure 3.
Longitudinal comparisons of fecal metabolite profiles for the four study groups. A: Principal component analysis comparing metabolic content in the four study groups at time 0 (baseline visit), week 4 (visit 2), and week 8 (visit 3). The study groups are color coded as indicated to the right of the plots. CDI status is indicated by the shapes of the points. B-E: Longitudinal comparisons of the relative abundances of bile acids in fecal samples from the four study groups. Included are the primary bile acids B) chenodeoxycholate and C) cholate, and the secondary bile acids D) deoxycholate and E) lithocholate. Groups are color coded as above, and results are shown for each of the three sampling times.
Figure 4.
Figure 4.
Comparison of metabolites distinguishing the study groups. Metabolites shown are the 30 most distinguishing features from each Random Forest model. For each panel, columns indicate samples and metabolites are in the rows. Metadata is shown along the top using the color code at the right. The relative abundance of metabolites is summarized by the color scale beside the figure panel. A) Analysis of the metabolites distinguishing the healthy and IBD groups. B) Analysis of metabolites distinguishing the healthy and IBD+CDI groups. C) Analysis of the metabolites distinguishing the IBD and IBD+CDI groups.
Figure 5.
Figure 5.
Assessing the factors that most strongly distinguish the IBD from the IBD+CDI groups. A) Graph of the factors most contributing to discrimination in the Random Forest model. B) Longitudinal abundance of isocaproate in stool samples from each of the study groups. C) Longitudinal abundance of isocaproyltaurine in each of the study groups.
Figure 6.
Figure 6.
Production of isocaproyltaurine by C. difficile selectively in the presence of added taurine. A) Proposed pathway for production of isocaproyltaurine by C. difficile by reaction of isocaproyl-CoA (Stickland fermentation intermediate) in the presence of taurine. B-G) Single ion monitoring mass spectra (m/z 222 to 80) assaying the presence of isocaproyltaurine in media. B) Trace showing control blank media. C) Synthetic isocaproyltaurine standard. D) Culture of C. difficile in media without added taurine. E) Culture of C. difficile in media with 1 mM taurine added. F) Culture of C. difficile in media with 10 mM taurine added. G) Control showing lack of isocaproyltaurine in media with added taurine but no C. difficile. Thus E) and F) show accumulation of a compound with the single ion mass transition and retention time (1.96 min) of the isocaproyltaurine standard selectively in culture media containing taurine and C. difficile.

Comment in

References

    1. Abbas A, and Zackular JP (2020). Microbe-microbe interactions during Clostridioides difficile infection. Curr Opin Microbiol 53, 19–25. - PMC - PubMed
    1. Abt MC, McKenney PT, and Pamer EG (2016). Clostridium difficile colitis: pathogenesis and host defence. Nat Rev Microbiol 14, 609–620. - PMC - PubMed
    1. Altschul SF, Gish W, Miller W, Myers EW, and Lipman DJ (1990). Basic local alignment search tool. J Mol Biol 215, 403–410. - PubMed
    1. Battaglioli EJ, Hale VL, Chen J, Jeraldo P, Ruiz-Mojica C, Schmidt BA, Rekdal VM, Till LM, Huq L, Smits SA, et al. (2018). Clostridioides difficile uses amino acids associated with gut microbial dysbiosis in a subset of patients with diarrhea. Sci Transl Med 10. - PMC - PubMed
    1. Bouillaut L, McBride SM, and Sorg JA (2011). Genetic manipulation of Clostridium difficile. Curr Protoc Microbiol Chapter 9, Unit 9A 2. - PMC - PubMed

Publication types

LinkOut - more resources