. 2020 Sep 8;15(3):646-661.
doi: 10.1016/j.stemcr.2020.07.019. Epub 2020 Aug 20.

Canonical Wnt Pathway Controls mESC Self-Renewal Through Inhibition of Spontaneous Differentiation via β-Catenin/TCF/LEF Functions

Affiliations

Canonical Wnt Pathway Controls mESC Self-Renewal Through Inhibition of Spontaneous Differentiation via β-Catenin/TCF/LEF Functions

Francesco Aulicino et al. Stem Cell Reports. .

Abstract

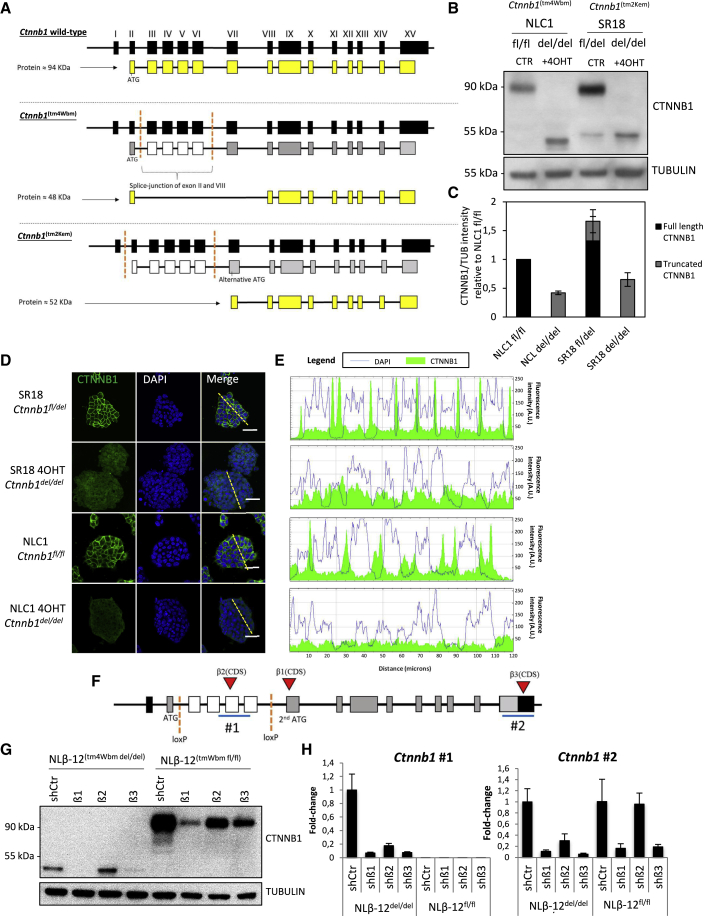
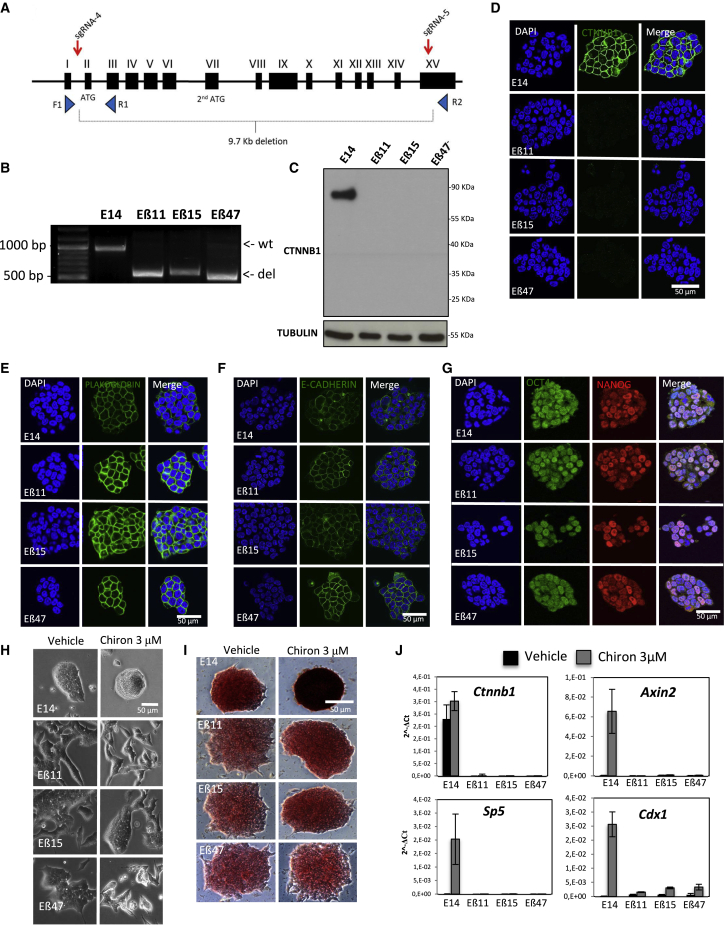
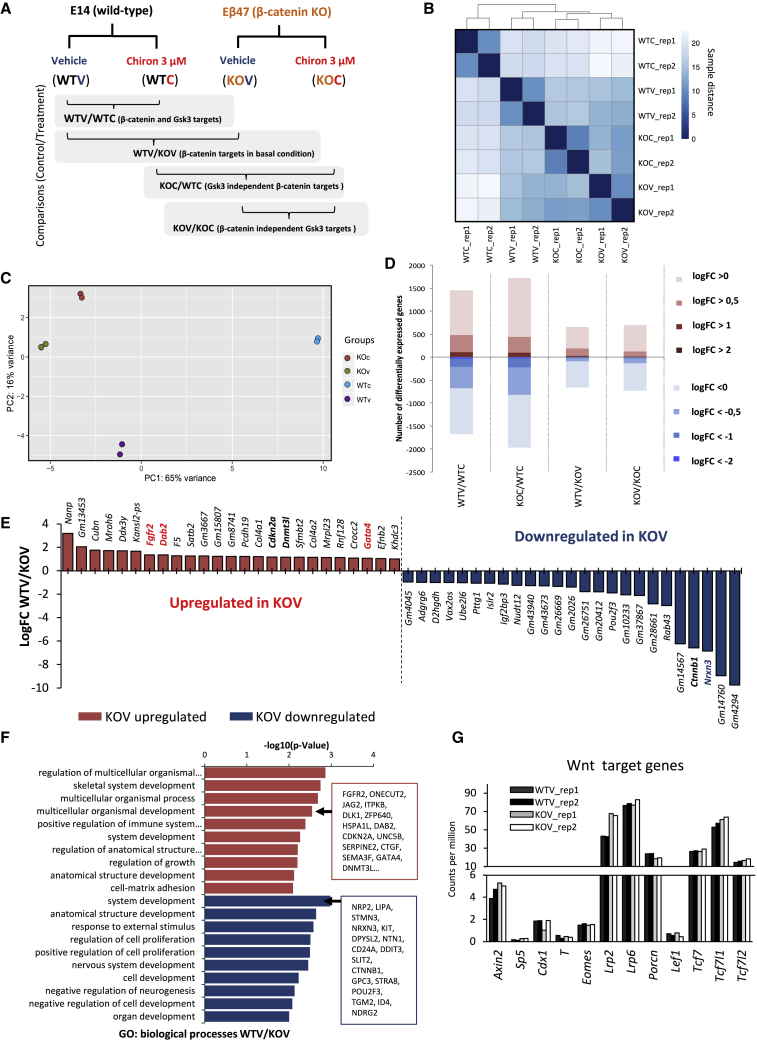
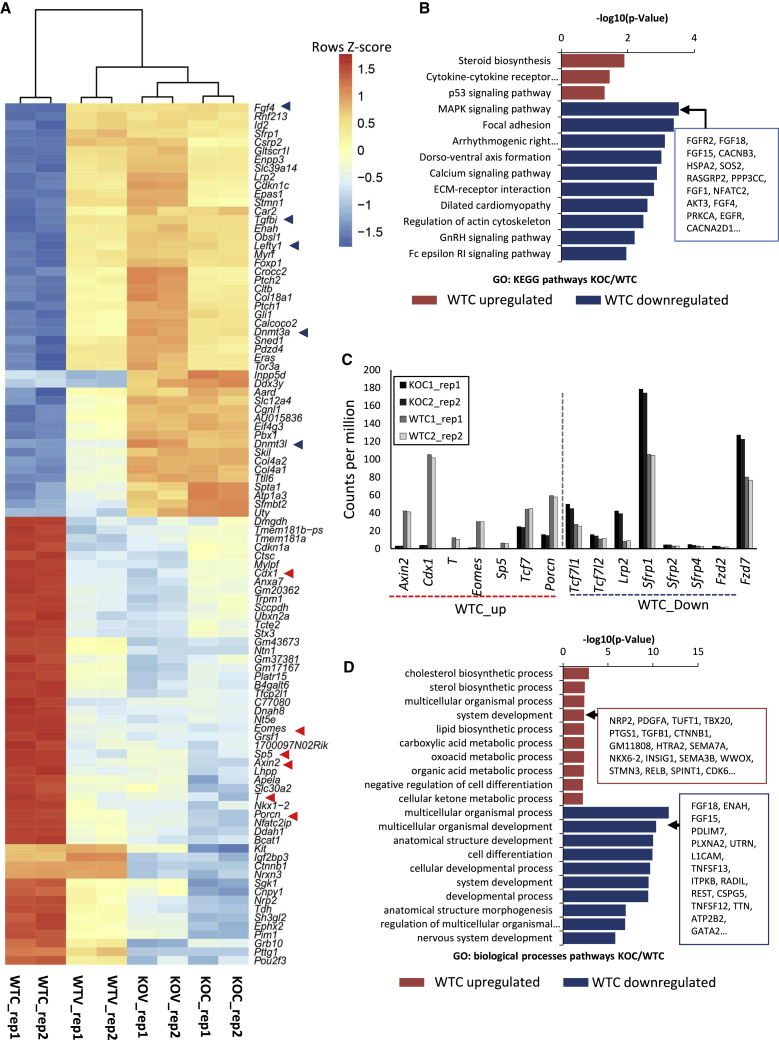
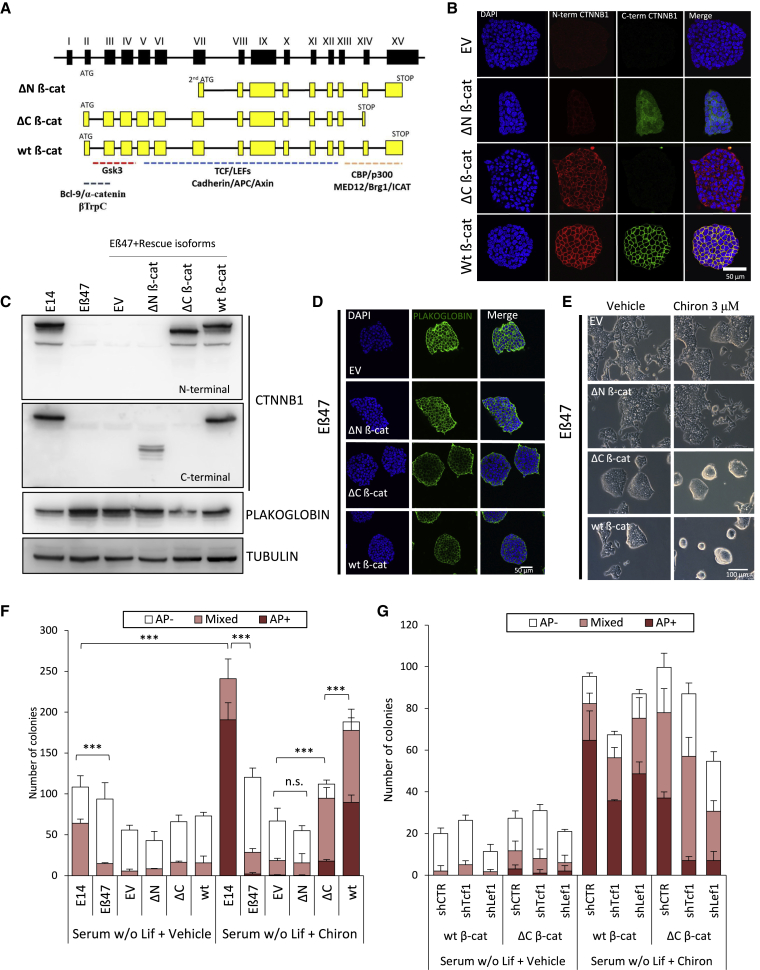
The Wnt/β-catenin signaling pathway is a key regulator of embryonic stem cell (ESC) self-renewal and differentiation. Constitutive activation of this pathway has been shown to increase mouse ESC (mESC) self-renewal and pluripotency gene expression. In this study, we generated a novel β-catenin knockout model in mESCs to delete putatively functional N-terminally truncated isoforms observed in previous knockout models. We showed that aberrant N-terminally truncated isoforms are not functional in mESCs. In the generated knockout line, we observed that canonical Wnt signaling is not active, as β-catenin ablation does not alter mESC transcriptional profile in serum/LIF culture conditions. In addition, we observed that Wnt signaling activation represses mESC spontaneous differentiation in a β-catenin-dependent manner. Finally, β-catenin (ΔC) isoforms can rescue β-catenin knockout self-renewal defects in mESCs cultured in serum-free medium and, albeit transcriptionally silent, cooperate with TCF1 and LEF1 to inhibit mESC spontaneous differentiation in a GSK3-dependent manner.

Keywords: CRISPR; Ctnnb1; LEF; TCF; Wnt; embryonic stem cells; mESCs; pluripotency; self-renewal; β-catenin.


Figures

Figure 1
Figure 1
Inducible β-Catenin Knockout Alleles Produce N-Terminally Truncated Isoforms in mESCs (A) Schematic representation of murine β-catenin (Ctnnb1) locus and the two loxP alleles used for β-catenin studies in mESCs. Black boxes represent exons, yellow boxes coding exons, dashed red lines indicate loxP sites, and white boxes represent exons excised upon CRE-mediated recombination of loxP sites. (B and C) Western blot (B) and relative quantification (C) of NLC1 and SR18 cell lines upon 72-h 4′-hydroxytamoxifen treatment (+4OHT) and respective untreated controls (CTRs). SR18 untreated cell line is heterozygous for full-length β-catenin deletion. Western blot band intensities (C) are normalized on NLC1 full-length CTTNB1. (D) β-Catenin immunofluorescence staining on fixed SR18 or NLC1 parental cell lines or upon 72-h +4OHT treatment. A primary antibody raised against the C-terminal portion of β-catenin was used. DAPI was used to counterstain nuclei. Scale bar represents 50 μm. (E) Multichannel fluorescence intensity measurement of immunofluorescence images in (D). Image quantification has been performed across the dashed yellow line depicted in (D), merge panel. (F) Schematic representation of short-hairpin targeted regions (red triangles, β1, β2, and β3) and qRT-PCR amplicons (blue lines, #1 and #2) along the Ctnnb1Tm4Wbm allele. (G) Western blot of β-catenin of mESCs harboring the Birchmeier β-catenin allele after (Ctnnb1Tm4Wbmdel/del; left) or before (Ctnnb1Tm4Wbm fl/fl; right) CRE-mediated recombination of the loxP sites. Cells were transduced with a control short hairpin (shCtr) or three different short hairpins against β-catenin mRNA (β1, β2, or β3). (H) qRT-PCR on total mRNA extracts of Ctnnb1Tm4Wbm fl/fl or Ctnnb1Tm4Wb del/del cells transduced with the short-hairpin constructs used in Figure 1D. Two different amplicons were amplified to monitor deleted region (Ctnnb1 #1) or 3′ UTR (Ctnnb1 #2). GAPDH was used as housekeeping control. Error bars represents standard deviation of technical triplicates.
Figure 2
Figure 2
CRISPR/Cas9-Mediated Excision of Whole Ctnnb1 Locus Results in a Complete β-Catenin Knockout Model in mESCs (A) Schematic representation of sgRNA design for CRISPR/Cas9-mediated excision of whole β-catenin coding sequence. Red arrows indicate sgRNAs target sites. Blue triangles indicate position and orientation of oligonucleotides used for PCR genotyping. (B) PCR genotyping of three homozygous β-catenin knockout clones (Eβ11, Eβ15, and Eβ47) and parental E14 mESCs. Expected amplicon size is 951 bp for wild-type (wt) alleles and 551 bp for knockout alleles (del). (C) Western blot of total protein extracts from Eβ11, Eβ15, Eβ47, and wild-type E14 cells. Protein extracts were probed for β-catenin (using a C-terminally raised antibody), stripped and re-probed for TUBULIN as loading control. (D–G) Immunofluorescence in fixed parental E14, Eβ11, Eβ15, and Eβ47 cells for β-catenin (D), PLAKOGLOBIN (E), E-CADHERIN (F), OCT4 and NANOG (G). DAPI was used to counterstain nuclei. Scale bar represents 50 μm. (H) Phase contrast pictures of Eβ11, Eβ15, Eβ47, and parental E14 clones upon 72-h vehicle (0.3% DMSO, left) or Chiron 3 μM treatment (right) in serum/LIF. Cells were seeded at 4 × 105 cells/well density in 6-well plates. Scale bar represents 50 μm. (I) Phase contrast pictures of AP staining on E14, Eβ11, Eβ15, and Eβ47 cells cultured in serum/LIF in presence of vehicle (0.3% DMSO, left) or Chiron 3 μM (right) for 5 days; 300 cells were seeded in each well of a 6-well plate. Scale bar represents 50 μm. (J) Histogram of qRT-PCR data on total RNA extracts of E14, Eβ11, Eβ15, and Eβ47 cells exposed to vehicle (0.3% DMSO, black bars) or Chiron 3 μM; 2−ΔCt are represented, and GAPDH was used as internal control. Error bars represents standard deviations of three technical replicates.
Figure 3
Figure 3
β-Catenin Depletion Produces Minor Changes at Transcriptomic Level (A) Schematic representation of experimental design for RNA-seq analysis. E14 parental cells (WT) or Eβ47 cells (knockout) were cultured in serum/LIF upon 72-h vehicle (0.3% DMSO, V) or Chiron 3 μM (C) treatment. Two biological replicates were analyzed for each sample. Pairwise sample comparisons are indicated as control/treatment. (B) Sample distance matrix and hierarchical clustering of biological replicates (rep_1 and rep_2) for WTV, WTC, KOV, and KOC samples. (C) PCA plot of indicated samples. (D) Histogram of differentially expressed genes across pairwise comparisons as indicated in Figure 3A. Shades of red indicate overexpressed genes; shades of blue indicate downregulated genes. Shade intensity represents log fold-change cutoff from >0 (no fold-change cutoff, light), to absolute log fold change >2 (dark). Adjusted p value cutoff is 0.05. (E) Top differentially expressed genes in WTV/KOV comparison ranked for log fold change. Adjusted p value <0.05. (F) GO analysis of biological processes enriched in differentially expressed genes in WTV/KOV comparison (adjusted p value <0.05, absolute logFC >0.5). Upregulated features are shown in red, downregulated features are shown in blue. (G) Histogram of RNA level (counts per million reads [CPM]) of canonical Wnt target genes and components across WTV (black and dark gray) or KOV (light gray and white) samples. Individual replicates are shown for each sample.
Figure 4
Figure 4
RNA-Seq Analysis of β-Catenin-Dependent Differentially Expressed Genes (A) Heatmap clustering of the top 100 differentially expressed genes in KOC/WTC comparison across KOV, KOC, WTV, and WTC samples (p value adjusted <0.05, absolute logFC >0.5). Minimum and maximum are scaled across conditions on single genes; the heatmap represents logCPM rescaled on each gene for their Z scores (average of the values is the center of a normal distribution; color codes represent positive or negative deviations from the average). (B) GO analysis of KEGG pathway categories enriched in differentially expressed genes in the KOC/WTC comparison (p value adjusted <0.05, absolute logFC >0.5). (C) Histogram of CPMs of canonical Wnt target genes and components differentially expressed in KOC/WTC comparison. Individual biological replicates are shown. (D) GO analysis of biological processe categories enriched in differentially expressed genes in KOC/WTC comparison (p value adjusted <0.05, absolute logFC >0.5).
Figure 5
Figure 5
Canonical β-catenin Functions Are Required for Inhibition of Differentiation (A) Schematic representation of β-catenin isoforms used for rescue experiments. N-terminally (ΔN β-cat) truncated β-catenin isoform mimics N-terminally truncated β-catenin isoforms obtained in previously published knockout models. (B) Immunofluorescence of Eβ47 cells transduced with lentiviral vectors encoding empty vector (EV), wild-type (wt β-cat), ΔN β-cat, and C-terminally (ΔC β-cat) truncated β-catenin isoforms. Cells were stained with N-terminally (red) and C-terminally (green) β-catenin antibodies. Nuclei were counterstained with DAPI. (C) Western blot of total protein extracts from E14 and Eβ47 untransduced cells and Eβ47 transduced with EV, ΔN β-cat, ΔC β-cat, and wt β-cat encoding lentiviruses. Membranes were probed with N-terminally or C-terminally raised β-catenin antibodies and anti-PLAKOGLOBIN. TUBULIN was used as loading control. Scale bar represents 50 μm. (D) Immunofluorescence of Eβ47 cells transduced with EV, ΔN β-cat, ΔC β-cat, or wt β-cat encoding lentiviruses. Cells were stained for PLAKOGLOBIN. DAPI was used to counterstain nuclei (Scale bar represents 50 μm). (E) Phase contrast pictures of Eβ47 cells transduced with EV, ΔN β-cat, ΔC β-cat, or wt β-cat encoding lentiviruses and cultured in serum/LIF in presence of 3 μM Chiron or vehicle (0.3% DMSO). Scale bar represents 100 μm. (F) AP staining quantification of E14 and Eβ47 untransduced cells or Eβ47 transduced with EV, ΔN β-cat, ΔC β-cat, or wt β-cat encoding lentiviruses. Cells were plated in serum without LIF and supplemented with 3 μM Chiron (right) or vehicle (0.3% DMSO, left). Error bars represent standard error of three biological replicates. Student's t test was used to measure statistical significance as indicated, stars indicate p value (n.s. = not significant, p < 0.05, ∗∗p < 0.01, ∗∗∗p < 0.001). (G) AP staining of Eβ47 cells transduced with either wt βcat or ΔC β-cat encoding lentiviruses. Cells were further transduced with lentivirus encoding short hairpins against Lef1 (shLef1), Tcf1 (shTcf1), or shCTR. Cells were cultured in serum without LIF in presence of 3 μM Chiron or vehicle (0.3% DMSO) for 1 week and stained for AP expression. Error bars represent standard error of three biological replicates.

References

    1. Ai Z., Shao J., Wu Y., Yu M., Du J., Shi X., Zhang Y., Guo Z. CHIR99021 enhances Klf4 expression through beta-catenin signaling and miR-7a regulation in J1 mouse embryonic stem cells. PLoS One. 2016;11:e0150936. - PMC - PubMed
    1. Anton R., Kestler H.A., Kuhl M. Beta-catenin signaling contributes to stemness and regulates early differentiation in murine embryonic stem cells. FEBS Lett. 2007;581:5247–5254. - PubMed
    1. Aulicino F., Theka I., Ombrato L., Lluis F., Cosma M.P. Temporal perturbation of the Wnt signaling pathway in the control of cell reprogramming is modulated by TCF1. Stem Cell Reports. 2014;2:707–720. - PMC - PubMed
    1. Bray N.L., Pimentel H., Melsted P., Pachter L. Near-optimal probabilistic RNA-seq quantification. Nat. Biotechnol. 2016;34:525–527. - PubMed
    1. De Jaime-Soguero A., Abreu de Oliveira W.A., Lluis F. The pleiotropic effects of the canonical Wnt pathway in early development and pluripotency. Genes. 2018;9:93. - PMC - PubMed

Publication types

MeSH terms