. 2020 Aug 6;23(9):101439.
doi: 10.1016/j.isci.2020.101439. eCollection 2020 Sep 25.

Adsorption Sequencing as a Rapid Method to Link Environmental Bacteriophages to Hosts

Affiliations

Adsorption Sequencing as a Rapid Method to Link Environmental Bacteriophages to Hosts

Patrick A de Jonge et al. iScience. .

Abstract

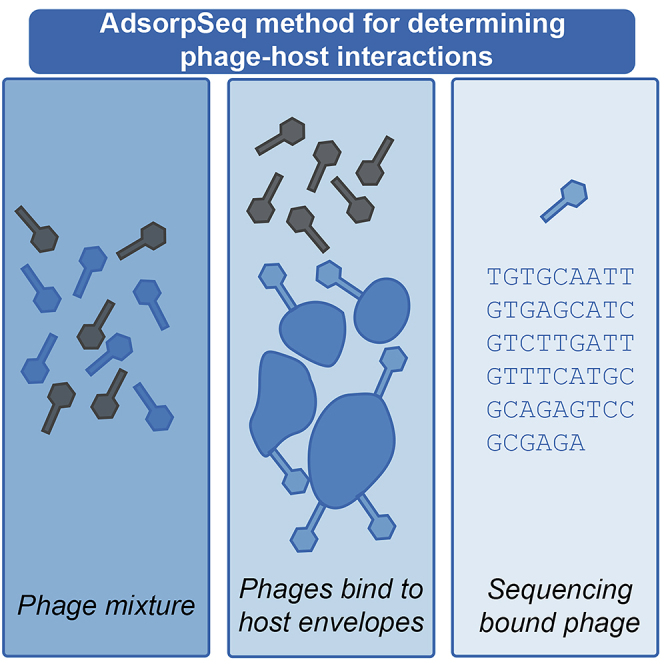
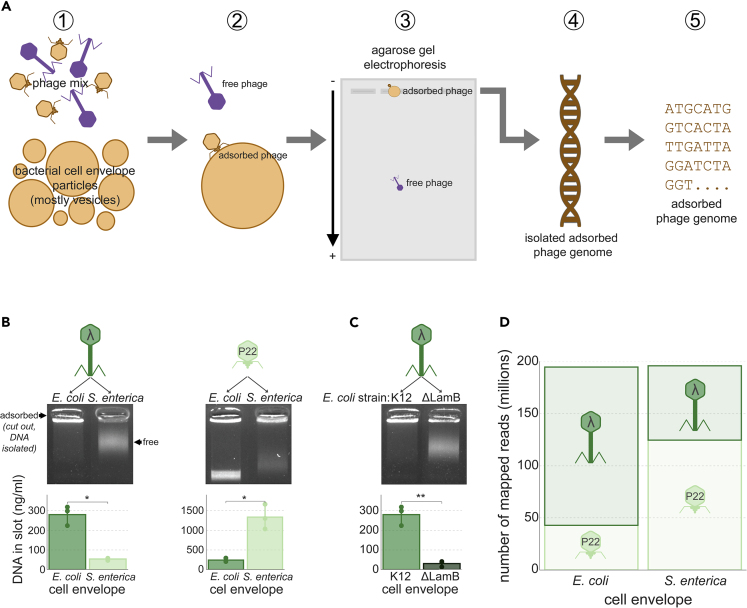
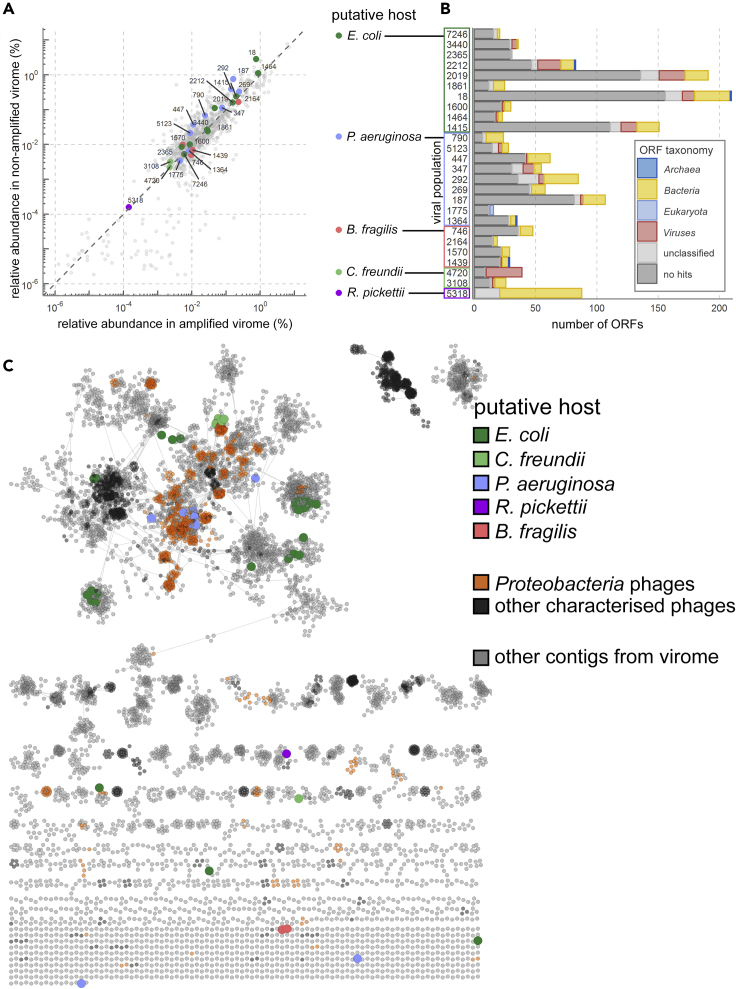
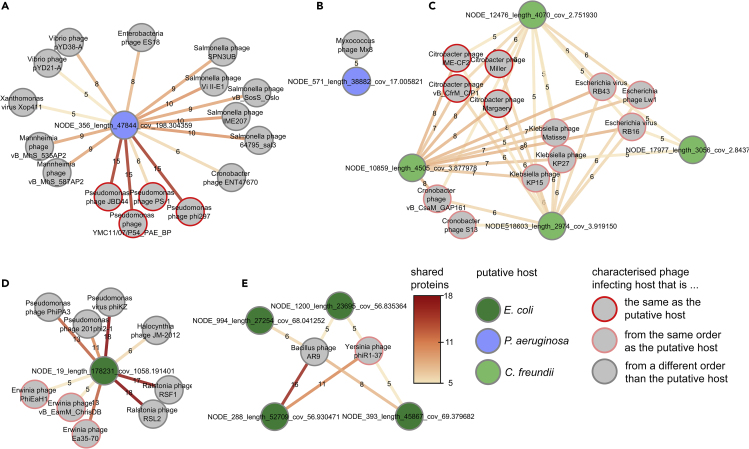
An important viromics challenge is associating bacteriophages to hosts. To address this, we developed adsorption sequencing (AdsorpSeq), a readily implementable method to measure phages that are preferentially adsorbed to specific host cell envelopes. AdsorpSeq thus captures the key initial infection cycle step. Phages are added to cell envelopes, adsorbed phages are isolated through gel electrophoresis, after which adsorbed phage DNA is sequenced and compared with the full virome. Here, we show that AdsorpSeq allows for separation of phages based on receptor-adsorbing capabilities. Next, we applied AdsorpSeq to identify phages in a wastewater virome that adsorb to cell envelopes of nine bacteria, including important pathogens. We detected 26 adsorbed phages including common and rare members of the virome, a minority being related to previously characterized phages. We conclude that AdsorpSeq is an effective new tool for rapid characterization of environmental phage adsorption, with a proof-of-principle application to Gram-negative host cell envelopes.

Keywords: Ecology; Environmental Science; Microbiology; Techniques in Genetics.


Conflict of interest statement

The authors declare no competing interests.

Figures

None
Graphical abstract
Figure 1
Figure 1
AdsorpSeq Allows the Selective Sequencing of Model Phages Based on Adsorption (A) Schematic of AdsorpSeq. It shows the main steps of (1) mixing phages with bacterial cell envelopes, (2) allowing phages to adsorb to cell envelopes, (3) separating phages using agarose gel electrophoresis based on adsorbing capability, (4) isolating the genomes of adsorbed phages, and (5) sequencing genomes of adsorbed phages isolated from gels. (B) Adsorption of phages λ and P22 to host cell envelopes hinders their migration into agarose gels. Agarose gels of phages λ and P22 after being added to cell envelope suspensions of E. coli K12 and S. enterica S1400, and bar graphs showing DNA quantities that were isolated from the gel slots at the top of the gels. Arrows indicate the location of free phages (migrated into the gel) and adsorbed phages (in the gel slot) in the first gel. This is identical in the other gels. (C) AdsorpSeq maintains receptor molecule specificity of phage λ. Agarose gel of phage λ after being added to E. coli strain K12, to which it can adsorb, and E. coli ΔLamB, to which it cannot adsorb. Bar graph depicts DNA isolated from gel slots at the top of the gel. Note: although the smear seems visually stronger in the K12 lane, significantly more DNA was retained in the well containing the K12 envelope fraction than in the ΔLamB envelope fraction (see bar graphs). (D) Applying AdsorpSeq to a mixture of phages leads to differentiation based on adsorbing capacity. Stacked bar graph showing the number of reads mapped to phages λ and P22 after AdsorpSeq was applied using an equal mixture of the two phages and cell envelopes from either E. coli K12 or S. enterica S1400. Significance levels according to a paired t test, error bars depict standard deviations, points are biological replicates. ∗p < 0.05, ∗∗p < 0.01.
Figure 2
Figure 2
Most Selected Viral Populations Represent Rare and Uncharacterized Viral Sequences (A) Relative abundance of selected viral populations with adsorption predictions in the virome before and after MDA shows that AdsorpSeq is not biased for abundant or rare phage sequences. Numbers next to data points show the viral population number. (B) ORF-level taxonomical predictions using CAT show most ORFs from selected viral populations have no similarities in the NCBI nr protein sequence database (dark gray). Some contigs had database hits but could not be classified because the hits involved proteins from different superkingdoms. These are labeled as unclassified (light gray). (C) The hospital wastewater virome contained a large diversity of uncharacterized phage sequences, as shown by a gene-sharing network of 10,032 viral contigs and all phage genomes in the NCBI viral RefSeq database (Pruitt et al., 2007), made using vContact2 (Bin Jang et al., 2019). Large colored contigs represent those in the final selection of 26 putative adsorbing viral populations. Proteobacteria-infecting characterized phages are orange.
Figure 3
Figure 3
Selected Viral Populations Related to Characterized Phages Protein-sharing networks of viral populations show their relationships to characterized phages. ORFs from selected viral populations were used in BLASTp searches against proteins of phages in the viral RefSeq database (Pruitt et al., 2007). Bubbles are phages. Edge color and labels show similar protein counts (E-value ≤ 10−5). (A) P. aeruginosa-adsorbing viral population 292. (B) P. aeruginosa-adsorbing viral population 447. (C) C. freundii-adsorbing viral population 4720. One additional contig did not share protein similarity to characterized phages. (D) E. coli-adsorbing viral population 18. (E) E. coli-adsorbing viral population 2019.
Figure 4
Figure 4
Several Viral Populations and their Relations to Characterized Families (A) Similarity of viral population 447, containing contig 356, to Pseudomonas phages JBD44 and phi297. Depicted is a whole genome comparison made using Easyfig (Sullivan et al., 2011). In the line representing contig 356, the top half shows ORFs with BLASTp hit against Pseudomonas bacteria proteins in the NCBI nr database, whereas the bottom half shows protein function. (B) Similarity between five contigs from C. freundii-adsorbing viral population 4720 and T4-like Citrobacter phage Margaery, as shown by genome comparisons made using Easyfig (Sullivan et al., 2011). Numbers indicate contig numbers, contig 13,003 was placed below phage Margaery as it overlaps with contig 18,603. Colors indicate tBLASTx hits and use the same legend as (A). (C) The relation of E. coli-adsorbing viral populations 18 and 2019 to jumbo phages displayed in an unrooted approximate maximum likelihood tree of jumbo phage terminases. Dots on branches represent ultrafast bootstrap support of ≥85 (Hoang et al., 2018).

References

    1. Abedon S.T., Yin J. Bacteriophage plaques: theory and analysis. In: Clokie M.R.J., Kropinski A., editors. Bacteriophages: Methods and Protocols, Volume 1: Isolation, Characterization, and Interactions. Humana Press; 2009. pp. 161–174.
    1. Agarwala R., Barrett T., Beck J., Benson D.A., Bollin C., Bolton E., Bourexis D., Brister J.R., Bryant S.H., Canese K. Database resources of the National Center for Biotechnology Information. Nucleic Acids Res. 2017;45:D12–D17. - PMC - PubMed
    1. Ahlgren N.A., Ren J., Lu Y.Y., Fuhrman J.A., Sun F. Alignment-free d2∗ oligonucleotide frequency dissimilarity measure improves prediction of hosts from metagenomically-derived viral sequences. Nucleic Acids Res. 2017;45:39–53. - PMC - PubMed
    1. Al-Shayeb B., Sachdeva R., Chen L.X., Ward F., Munk P., Devoto A., Castelle C.J., Olm M.R., Bouma-Gregson K., Amano Y. Clades of huge phages from across Earth’s ecosystems. Nature. 2020;578:425–431. - PMC - PubMed
    1. Andres D., Hanke C., Baxa U., Seul A., Barbirz S., Seckler R. Tailspike interactions with lipopolysaccharide effect DNA ejection from phage P22 particles in vitro. J. Biol. Chem. 2010;285:36768–36775. - PMC - PubMed

LinkOut - more resources