. 2020 Aug 13;12(8):2266.
doi: 10.3390/cancers12082266.

mTOR Inhibition Leads to Src-Mediated EGFR Internalisation and Degradation in Glioma Cells

Affiliations

mTOR Inhibition Leads to Src-Mediated EGFR Internalisation and Degradation in Glioma Cells

Barbara Colella et al. Cancers (Basel). .

Abstract

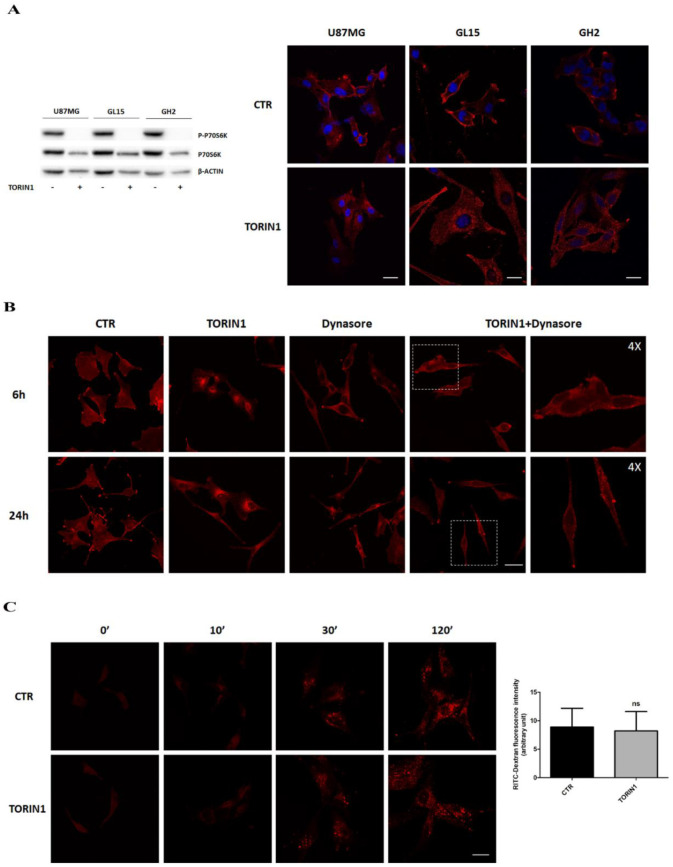
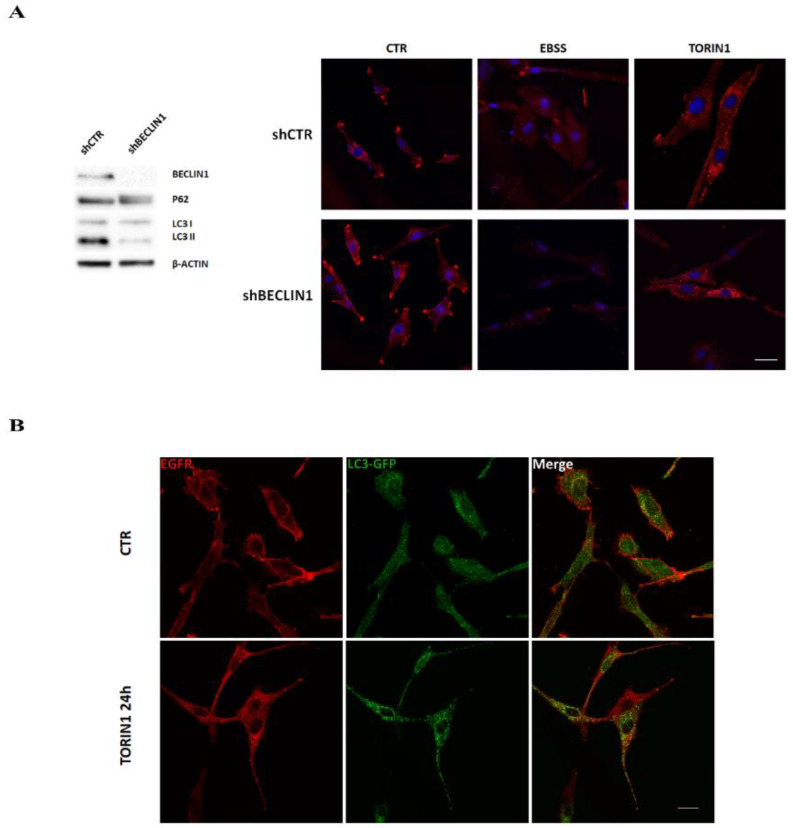
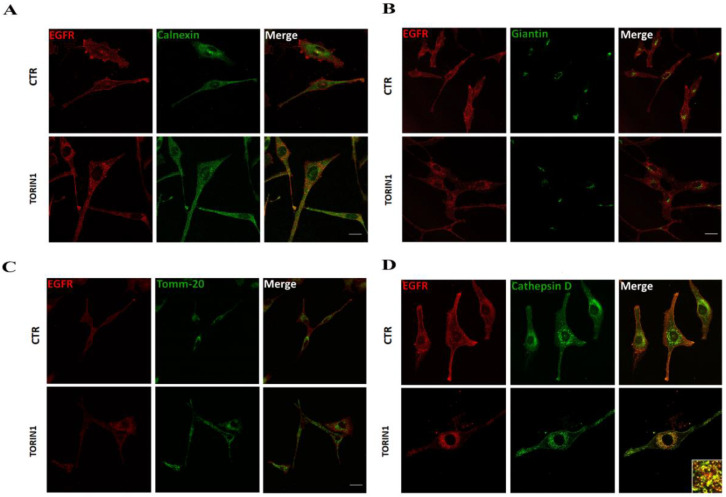
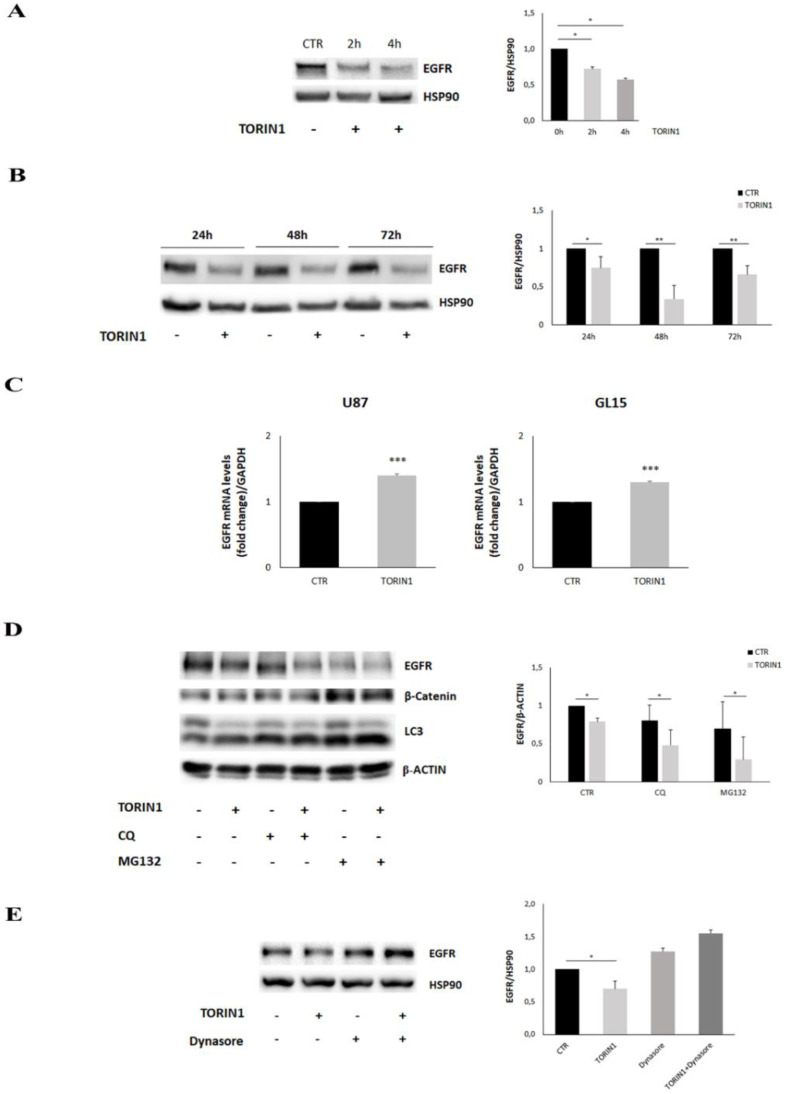
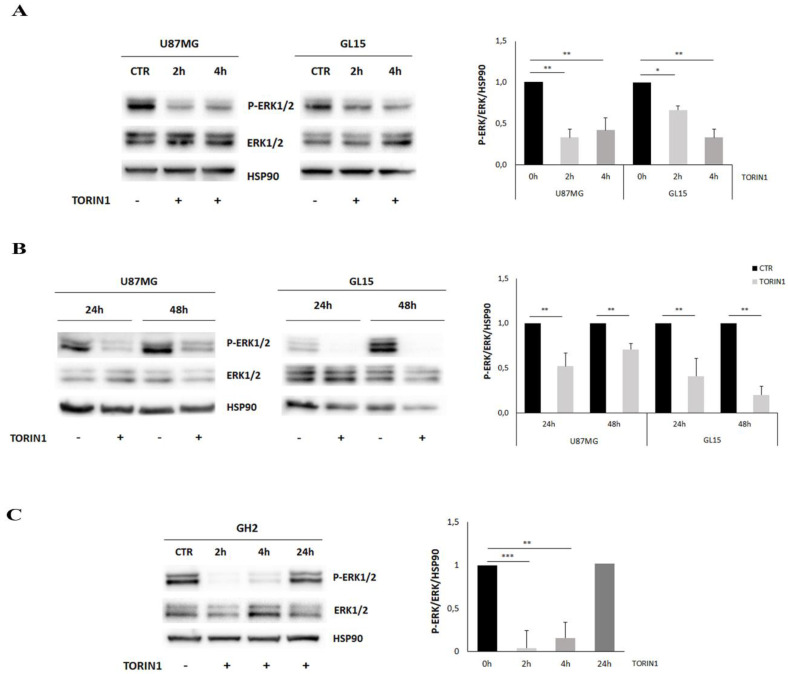
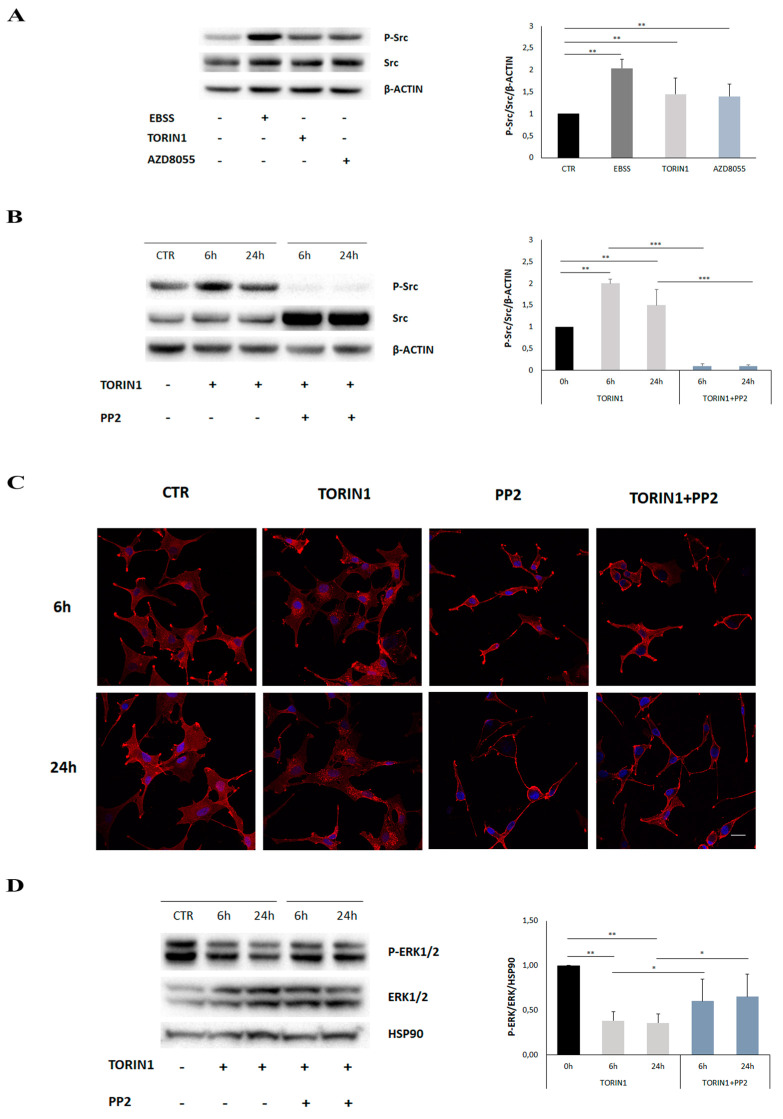
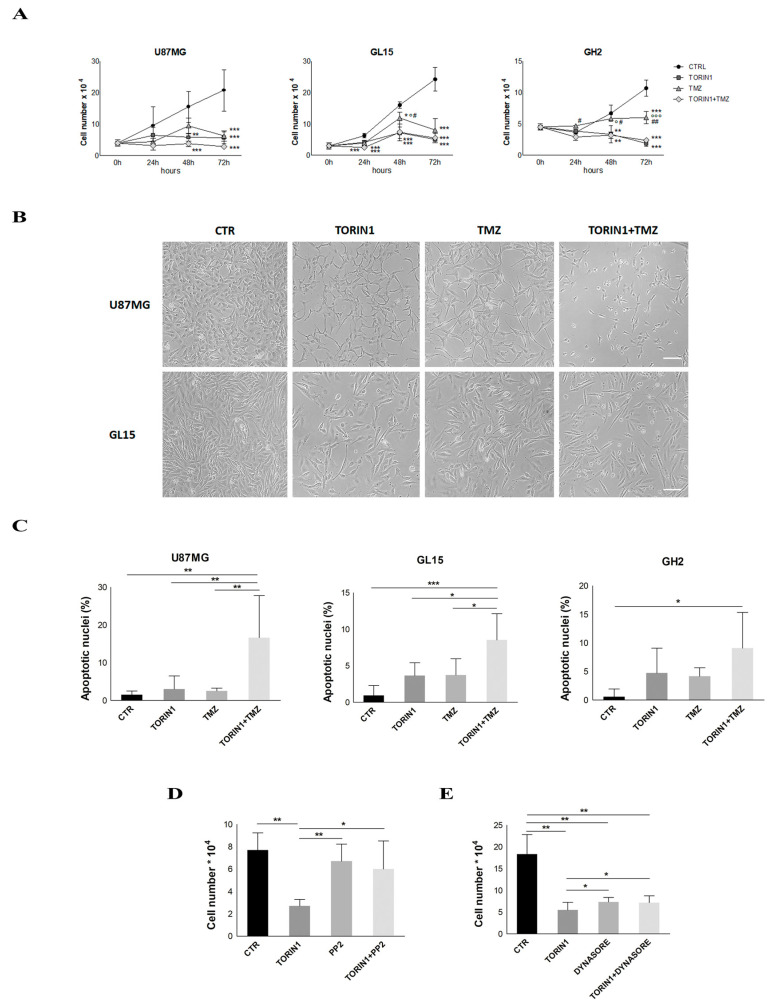
Epidermal Growth Factor receptor (EGFR) is a tyrosine kinase receptor widely expressed on the surface of numerous cell types, which activates several downstream signalling pathways involved in cell proliferation, migration and survival. EGFR alterations, such as overexpression or mutations, have been frequently observed in several cancers, including glioblastoma (GBM), and are associated to uncontrolled cell proliferation. Here we show that the inhibition of mammalian target of Rapamycin (mTOR) mediates EGFR delivery to lysosomes for degradation in GBM cells, independently of autophagy activation. Coherently with EGFR internalisation and degradation, mTOR blockade negatively affects the mitogen activated protein/extracellular signal-regulated kinase (MAPK)/ERK pathway. Furthermore, we provide evidence that Src kinase activation is required for EGFR internaliation upon mTOR inhibition. Our results further support the hypothesis that mTOR targeting may represent an effective therapeutic strategy in GBM management, as its inhibition results in EGFR degradation and in proliferative signal alteration.

Keywords: EGFR; autophagy; glioma; mTOR.


Conflict of interest statement

The authors declare no conflict of interest.

Figures

Figure 1
Figure 1
Epidermal Growth Factor receptor (EGFR) internalises into Glioblastoma multiforme (GBM) cells upon mTOR inhibition. (A) U87MG (upper panels), GL15 (middle panels) and primary GH2 cells (lower panels) were cultured in complete medium (DMEM) (CTR) or in DMEM in the presence of 250 nM Torin1 for 18 h. Immunocytochemistry and confocal analysis for EGFR localisation (red) were then performed. Hoechst 33342 was used to stain nuclei (blue). Scale bar, 30 μM. Western blot analysis of P-p70S6K and p70S6K was performed to check mTOR pathway inhibition by Torin1. β-actin was used as loading control. The blots are representative of three independent experiments. (B) Immunocytochemistry and confocal analysis for EGFR localisation (red) were performed in U87MG cells, upon 6 h and 24 h Torin1 treatment in the presence or absence of 100 μM Dynasore. Scale bar, 30 μM. A 4× magnification is shown for the right panels representing cells treated with Torin1 plus Dynasore. (C) U87MG cells were incubated with 0.5 mg/mL Rhodamine Dextran for the indicated times and its uptake within the cells analysed by image capturing at the confocal microscope. Scale bar, 30 μM. Fluorescence quantification of Dextran uptake at 120′ is shown in the right panel.
Figure 2
Figure 2
EGFR de-localisation in GBM cells is independent of canonical autophagy. (A) shCTR and shBECLIN1 GL15 cells [23] were cultured in DMEM (CTR) or amino acid- and serum- free medium (EBSS) media or in DMEM in the presence of 250 nM Torin1 for 18 h and subjected to immunocytochemistry and confocal analysis for EGFR localisation (red) (right panels). Hoechst 33342 was used to stain nuclei (blue). Scale bar, 30 μM. Western blot analysis of P62 and LC3 I/II was also performed in basal conditions to check autophagy status (left panel). A specific antibody for BECLIN1 was used to check the silencing efficiency. β-ACTIN was used as loading control. The blot is representative of three independent experiments. (B) U87MG cells were transduced with GFP-LC3-expressing retrovirus as described in Material and Methods. Infected cells, cultured in DMEM alone (CTR) or in DMEM containing 250 nM Torin1 for 24 h, were subjected to immunocytochemistry and confocal analysis for EGFR (red) and autophagosomes (green) localisation. Colocalisation was excluded by calculating the Pearson’s correlation coefficient r (mean r CTR, 0.15 ± 0.02; Torin1, 0.2 ± 0.03). The images showing the merge of the two signals are shown in the right panels. Scale bar, 30 μM.
Figure 3
Figure 3
EGFR is delivered to lysosomes upon mTOR inhibition in GBM cells. U87MG treated with Torin1 for 24h or untreated (CTR) were subjected to immunocytochemistry and confocal analysis for EGFR (red) and for different subcellular markers (green): Calnexin for endoplasmic reticulum (A), Giantin for Golgi cisternae (B), Tomm-20 for mitochondria (C) and Cathepsin D for lysosomes (D). The images showing the merge of the two signals are shown in the right panels. Inset containing a high magnification view of the merge image is also shown. Scale bar, 30 μM. Colocalisation was assessed by calculating the Pearson’s correlation coefficient r (mean r in D: CTR, 0.2 ± 0.03; Torin1, 0.75 ± 0.06).
Figure 4
Figure 4
mTOR inhibition leads to a reduction of EGFR expression in GBM cells. (A,B) U87MG cells were cultured in complete DMEM medium in the presence (TORIN1) or absence (CTR) of 250 nM Torin1 and analysed at the indicated time points. Western blot analyses were performed by using a specific antibody for EGFR. HSP90 was used as loading control. (C) Real time experiments were performed on U87MG and GL15 cells stimulated or not with 250 nM Torin1 for 24 h. GAPDH was used as internal control. The graph represents the mean ± SD of three different experiments: *** p < 0.001 Student t-test. (D) U87MG cells were stimulated (+) or not (−) with 250 nM Torin1 for 24 h in the presence of 20 μM Chloroquine (CQ) or 3 μM MG132 and Western blot analyses were performed by using antibodies for EGFR, β-catenin, LC3 and β-actin. (E) U87MG cells were stimulated (+) or not (−) with 250 nM Torin1 for 24 h in the presence of 100 μM Dynasore and Western blot analysis was performed by using antibodies for EGFR and HSP90 was used as loading control. The graphs represent the mean ± SD of three different experiments. Statistical significance: * p < 0.05 Student t-test ** p < 0.01 Student t-test.
Figure 5
Figure 5
The mitogen activated protein (MAPK)/ERK pathway is down-regulated upon mTOR inhibition in GBM cells. (A,B) U87MG, GL15 were cultured in complete DMEM medium in the presence (TORIN1) or absence (CTR) of 250 nM Torin1 and analysed at 2 h and 4 h (A) and at 24 h and 48 h (B). Western blot analysis was performed by using specific antibodies for ERK1/2 and P-ERK1/2. HSP90 was used as loading control. (C) GH2 cells were cultured in complete DMEM medium in the presence (TORIN1) or absence (CTR) of 250 nM Torin1 and analysed at the indicated time points. Western blot analysis was performed by using specific antibodies for ERK1/2 and P-ERK1/2. HSP90 was used as loading control. The graph represents the mean ± SD of three different experiments. Statistical significance: * p < 0.05 Student t-test ** p < 0.01 Student t-test, *** p < 0.001 Student t-test.
Figure 6
Figure 6
mTOR inhibition leads to SRC activation. (A) U87MG cells were cultured in complete DMEM (CTR) or aminoacid- and serum- free medium (EBSS) or in DMEM in the presence of 250 nM Torin1 or 100 nM AZD8055 for 18 h. Western blot analysis was performed by using specific antibodies for the total (SRC) and the phosphorylated (Y416) form of SRC (P-Src). β-ACTIN was used as loading control. (B) U87MG cells were cultured in DMEM in the presence of Torin1 pre-incubating or not with 20 µM PP2 inhibitor for the indicated time points. Western blot analysis was performed by using specific antibodies for the total (SRC) and the phosphorylated (Y416) form of SRC (P-Src). β-ACTIN was used as loading control. The graphs represent the mean ± SD of three different experiments. Statistical significance: ** p < 0.01 Student t-test, *** p ≤ 0.001 Student t-test (C) Immunocytochemistry and confocal analysis for EGFR localisation (red) were performed in U87MG, upon 6 h and 24 h of Torin1 and PP2 treatments, as indicated. Hoechst 33342 was used to stain nuclei (blue). Scale bar, 30 μM. (D) U87MG cells were cultured in DMEM in the presence of Torin1 pre-incubating or not with 20 µM PP2 inhibitor for the indicated time points. Western blot analysis was performed by using specific antibodies for the total (ERK1/2) and the phosphorylated form of ERK1/2 (P-ERK1/2). HSP90 was used as loading control. The graph represents the mean ± SD of three different experiments. Statistical significance: * p < 0.05 Student t-test, ** p < 0.01 Student t-test.
Figure 7
Figure 7
mTOR inhibition leads to cell proliferation arrest. (A) U87MG, GL15 and GH2 cells were cultured in complete DMEM (CTR) or in the presence of 250 nM Torin1 (TORIN1) or 500 µM Temozolomide (TMZ) or both. At the indicated time points, cells were trypsinised and counted in a Newbauer chamber. The graph represents the mean ± Standard Error of the Mean (SEM) of three different experiments. Statistical significance: * indicates significance vs. Ctr; # indicates significance vs. Torin1 + TMZ; ° indicates significance vs. Torin1. ** p < 0.01 *** p ≤ 0.001 Two-way ANOVA. (B) Pictures of the cells in (A) were taken at 72 h of the indicated treatments. Scale bar: 100 µm (C) U87MG, GL15 and GH2 cells were cultured in complete DMEM (CTR) or in the presence of 250 nM Torin1 (TORIN1) or 500 µM TMZ or both Torin1 and TMZ for 72 h. Nuclei were then stained with DAPI and counted under fluorescence microscope (20× objective). 10 fields per each condition were counted. The graphs represent the mean ± SD of three different experiments. * p < 0.05, ** p < 0.01, *** p ≤ 0.001 One-way ANOVA; (D,E) U87MG cells were incubated with Torin1 in the presence or absence of 20 µM PP2 (D) or in the presence of 100 μM Dynasore (E) for 48 h before cell counting in a Newbauer chamber. The graphs represent the mean ± SD of three different experiments. Statistical significance: * p < 0.05, ** p < 0.01 One-way ANOVA.

References

    1. Lemmon M.A., Schlessinger J., Ferguson K.M. The EGFR family: Not so prototypical receptor tyrosine kinases. Cold Spring Harb. Perspect. Biol. 2014;6:a020768. doi: 10.1101/cshperspect.a020768. - DOI - PMC - PubMed
    1. Ceresa B.P., Peterson J.L. Cell and Molecular Biology of Epidermal Growth Factor Receptor. Int. Rev. Cell Mol. Biol. 2014;313:145–178. - PubMed
    1. Wee P., Wang Z. Epidermal growth factor receptor cell proliferation signaling pathways. Cancers. 2017;9:52 - PMC - PubMed
    1. Tomas A., Futter C.E., Eden E.R. EGF receptor trafficking: Consequences for signaling and cancer. Trends Cell Biol. 2014;24:26–34. doi: 10.1016/j.tcb.2013.11.002. - DOI - PMC - PubMed
    1. Sigismund S., Woelk T., Puri C., Maspero E., Tacchetti C., Transidico P., Di Fiore P.P., Polo S. Clathrin-independent endocytosis of ubiquitinated cargos. Proc. Natl. Acad. Sci. USA. 2005;102:2760–2765. doi: 10.1073/pnas.0409817102. - DOI - PMC - PubMed