. 2020 Aug 17;9(8):1910.
doi: 10.3390/cells9081910.

TLR3-Dependent Activation of TLR2 Endogenous Ligands via the MyD88 Signaling Pathway Augments the Innate Immune Response

Affiliations

TLR3-Dependent Activation of TLR2 Endogenous Ligands via the MyD88 Signaling Pathway Augments the Innate Immune Response

Hellen S Teixeira et al. Cells. .

Abstract

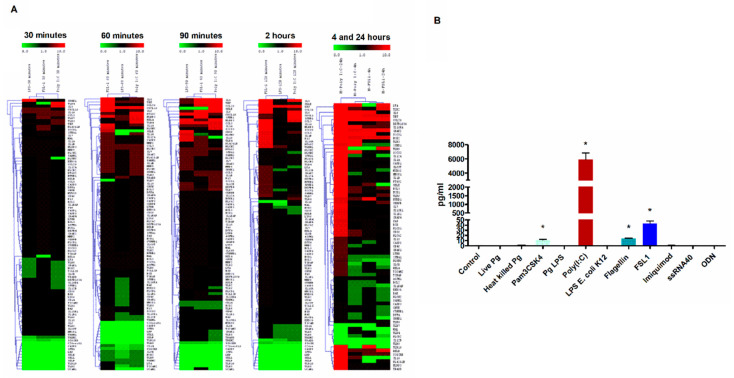
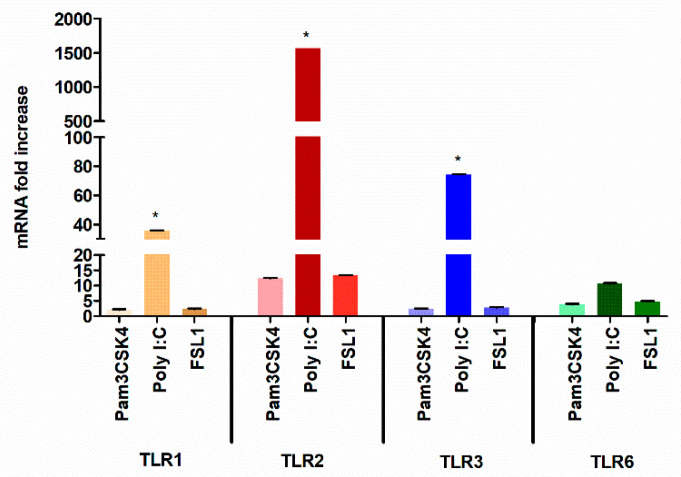
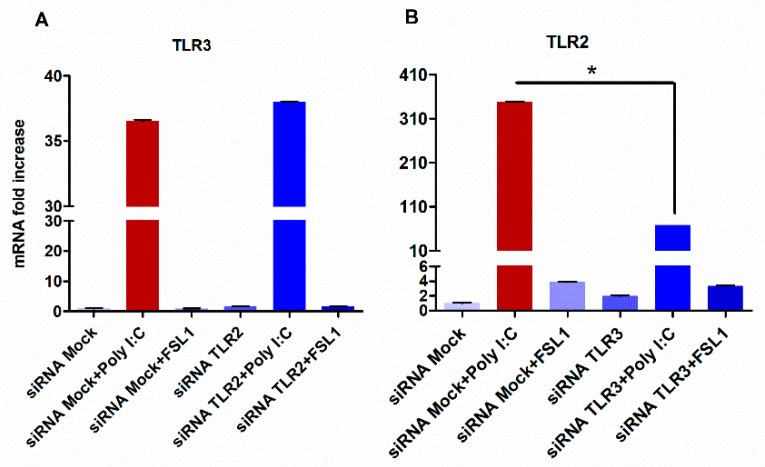
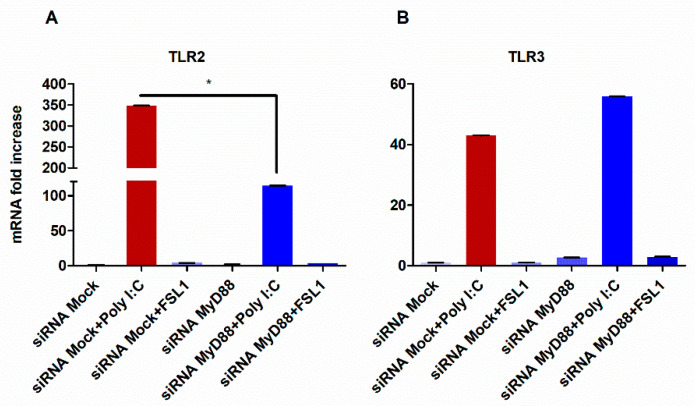
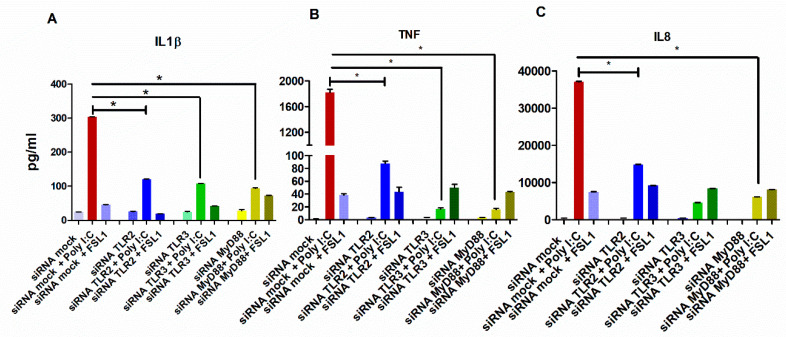
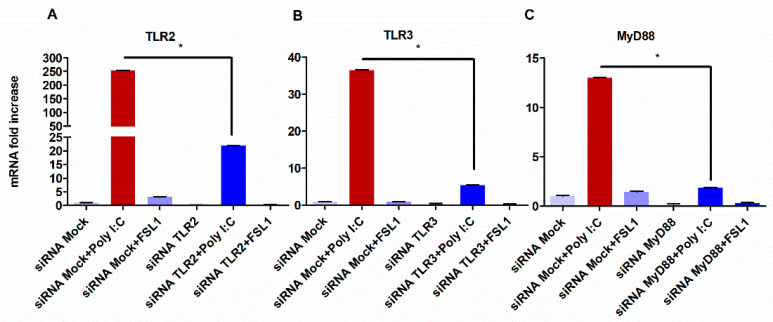
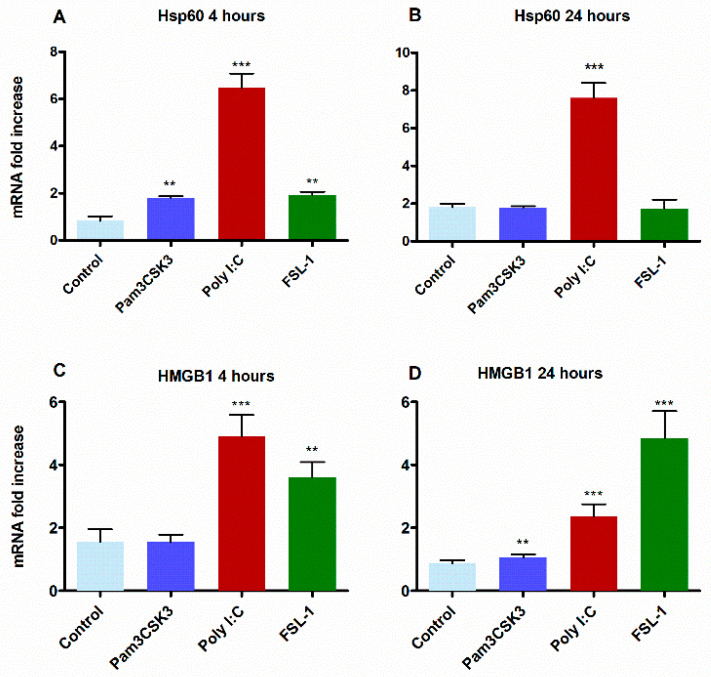
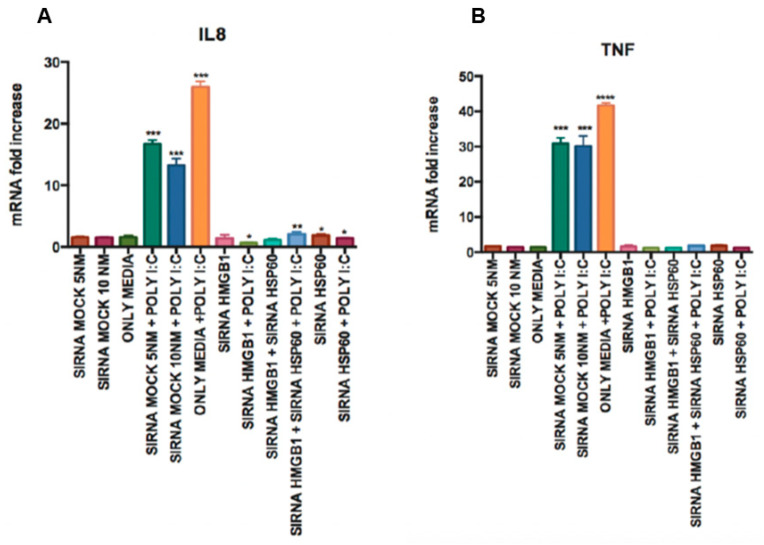
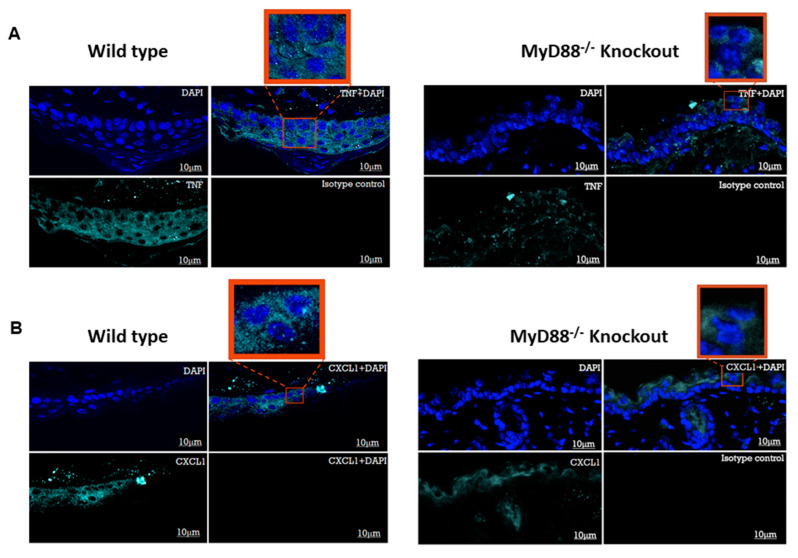
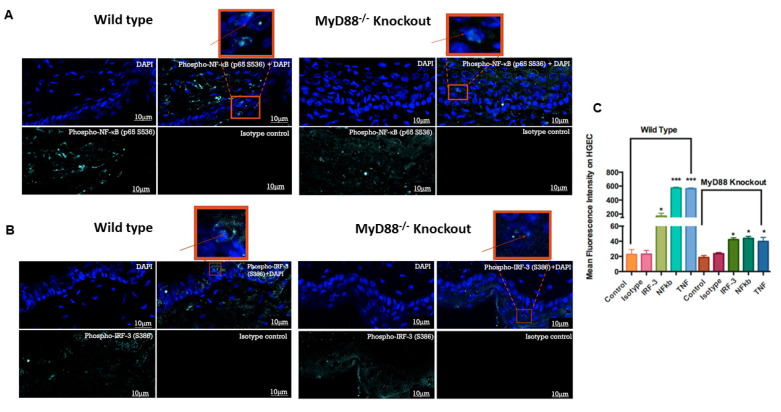
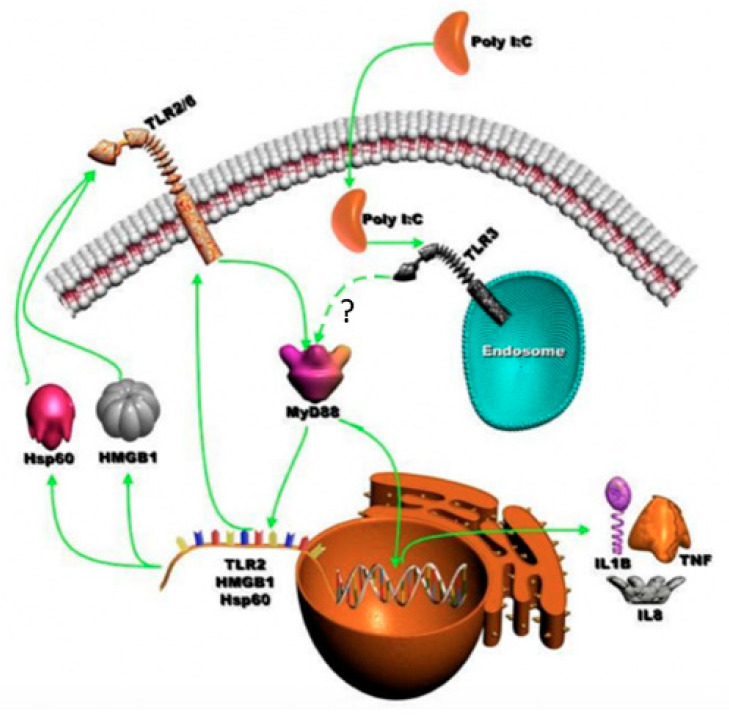
The role of the adaptor molecule MyD88 is thought to be independent of Toll-like receptor 3 (TLR3) signaling. In this report, we demonstrate a previously unknown role of MyD88 in TLR3 signaling in inducing endogenous ligands of TLR2 to elicit innate immune responses. Of the various TLR ligands examined, the TLR3-specific ligand polyinosinic:polycytidylic acid (poly I:C), significantly induced TNF production and the upregulation of other TLR transcripts, in particular, TLR2. Accordingly, TLR3 stimulation also led to a significant upregulation of endogenous TLR2 ligands mainly, HMGB1 and Hsp60. By contrast, the silencing of TLR3 significantly downregulated MyD88 and TLR2 gene expression and pro-inflammatory IL1β, TNF, and IL8 secretion. The silencing of MyD88 similarly led to the downregulation of TLR2, IL1β, TNF and IL8, thus suggesting MyD88 to somehow act downstream of TLR3. Corroborating in vitro data, Myd88-/- knockout mice downregulated TNF, CXCL1; and phospho-p65 and phospho-IRF3 nuclear localization, upon poly I:C treatment in a mouse model of skin infection. Taken together, we identified a previously unknown role for MyD88 in the TLR3 signaling pathway, underlying the importance of TLRs and adapter protein interplay in modulating endogenous TLR ligands culminating in pro-inflammatory cytokine regulation.

Keywords: HMGB1; Hsp60; MyD88; TLR3; human gingival epithelial cells; pro-inflammatory cytokine.


Conflict of interest statement

Authors declare no conflict of interest.

Figures

Figure 1
Figure 1
TLR3 stimulation of human gingival epithelial cells (HGECs) leads to robust activation proinflammatory signaling: the cells were treated with various TLR ligands for 24 h and the supernatant was subjected to TNF measurement using ELISA. TLR3 stimulation by poly I:C induced robust TNF cytokine induction (A). HGECs were incubated with E. Coli LPS (1 µg/mL), FSL-1 (1 µg/mL) and poly I:C (5 µg/mL) for 30, 60, 90, 120 min and 4 and 24 h. Total RNA was isolated, converted to cDNA and customized qPCR-Arrays were analyzed. The ΔΔCT values were used to generate the heatmaps based on two-way hierarchical clustering with MeV v4.1 software (rows = genes, columns = samples) using the values from two independent experiments. The color scale indicates relative expression: Red, above mean; green, below mean; and black, below background (B). Statistical comparison was done for ELISA by one-way ANOVA followed by Tukey’s multiple comparison test (* p < 0.05) and results are represented as mean ± SE (n = 3) from three independent experiments.
Figure 2
Figure 2
TLR3 stimulation induced high levels of TLR2 gene expression: HGECs were treated Pam3CSK4 (1 µg/mL), FSL-1 (1 µg/mL) and poly I:C (5 µg/mL) for 4 and 24 h. Quantitative real-time PCR was performed on cDNA as stated above. Poly I:C induced higher TLR3 gene expression at 4 h, but at 24 h post stimulation, TLR3 activation induced significantly higher TLR2 gene expression. Statistical test: one-way ANOVA followed by Tukey’s multiple comparison test (* p < 0.05). Results are mean ± SE (n = 3) from three independent experiments.
Figure 3
Figure 3
Silencing of the TLR3 reduced TLR2 gene expression in HGECs: when TLR2 was silenced, the expression of TLR3 was not affected after stimulation with poly I:C (A). On the other hand, silencing TLR3 downregulated TLR2 gene expression (B). Statistical test: one-way ANOVA followed by Tukey’s multiple comparison test (* p < 0.05) and the results are represented as the mean ± SE (n = 3) from three independent experiments.
Figure 4
Figure 4
Upregulation of TLR2 by poly I:C is partly mediated by MyD88: when MyD88 is silenced, the expression of TLR2 is significantly decreased after the stimulation with poly I:C. (A). However, the silencing of Myd88 did not alter the expression of TLR3 (B). Statistical test: one-way ANOVA followed by Tukey’s multiple comparison test (* p < 0.05) and the results are represented as the mean ± SE (n = 3) from three independent experiments.
Figure 5
Figure 5
Poly I:C-upregulated cytokine production is partially through the activation of TLR2 and MyD88. The HGECs were stimulated with poly I:C and FSL1 for 24 h after silencing TLR2, TLR3 and MyD88. ELISA on the supernatant showed a significant decrease in IL1β (A), TNF (B) and IL8 (C) levels. Moreover, TLR2 silencing significantly downregulated IL1β, TNF and IL8 secretion upon poly I:C treatment. The striking difference was observed when MyD88 was silenced, where IL-1β, TNF and IL8 secretion was significantly downregulated upon poly I:C treatment. These data underline the unexpected role of MyD88 in the MyD88-independent pathway. Statistical test: one-way ANOVA followed by Tukey’s multiple comparison test (* p < 0.05) and the results are represented as the mean ± SE (n = 3) from three independent experiments.
Figure 6
Figure 6
TLR3 stimulation induced MyD88 and inhibition attenuated its expression: the HGECs were treated with respective ligands after silencing TLR2, TLR3 and MyD88. Silencing TLR3 induced significantly higher TLR2 expression even when TLR2 was silenced (A). As expected, siTLR3 treated the cells’ downregulated TLR3 (B). Interestingly, poly I:C-treated cells significantly increased Myd88 expression (C). However, when MyD88 was silenced, poly I:C significantly downregulated MyD88 expression. The extent of poly I:C increasing TLR2 expression was relatively higher than that of FSL-1 increasing TLR3 expression. Statistical test: one-way ANOVA followed by Tukey’s multiple comparison test (* p < 0.05) and the results are represented as the mean ± SE (n = 3) from three independent experiments.
Figure 7
Figure 7
TLR3 stimulation activated endogenous TLR2 ligands: the HGECs were stimulated with Pam3CSK3, poly I:C and FSL-1 for 4 and 24 h. The cDNA was used to measure HMGB1 and Hsp60 gene expression. Poly I:C increased the expression of both the Hsp60 (HSPD1) and HMGB1 genes. Poly I:C increased the significantly higher HMGB1 expression at the 4 h time point (A), whereas FSL1 induced higher the HMGB1 at 24 h (B). On the other hand, Hsp60 expression was minimally activated by FSL-1 treatment but robustly upregulated by poly I:C at the 4 and 24 h time points (C,D). Statistical test: one-way ANOVA followed by Tukey’s multiple comparison test (* p < 0.05, ** p < 0.01, *** p < 0.001) and the results are represented as the mean ± SE (n = 3) from three independent experiments.
Figure 8
Figure 8
Silencing of HMGB1 and Hsp60 leads to the downregulation of pro-inflammatory cytokines: IL8 (A) and TNF (B) were downregulated upon poly I:C stimulation, and the silencing of HMGB1 and Hsp60 in epithelial cells. Statistical test: one-way ANOVA followed by Tukey’s multiple comparison test (* p < 0.05, ** p < 0.01, *** p < 0.001, **** p < 0.0001) and the results are represented as the mean ± SE (n = 3) from three independent experiments.
Figure 9
Figure 9
MyD88 knockout mice display a blunted proinflammatory response to poly I:C stimulation: the skins of wild-type mice and MyD88 knockout mice were challenged with poly I:C for a given time point and immunofluorescence imaging was performed on skin tissue sections. A higher mean fluorescence intensity was observed on the skin surface of the wild-type mouse (green (TNF); blue (DAPI)). (A). Similarly, a higher mean fluorescence intensity was observed on the skin surface of the wild-type mouse (green (CXCL1); blue (DAPI)) (B). (N = 8 mice per group in total (two independent experiments with n = 4 animals/group). Bar = 10 μm).
Figure 10
Figure 10
MyD88 knockout mice display downmodulated transcriptional factors to poly I:C stimulation: the skin of wild-type mice and MyD88 knockout mice challenged with poly I:C and immunofluorescence performed using phospho-NF-kB p65 (S536) antibody in skin tissue sections. A higher mean of fluorescence intensity was observed on the surface skin of the wild-type mouse (green (phospho-NF-kB p65); blue (DAPI)) (A). Furthermore, the skin tissue was stained for phospho-IRF3 (S386). A higher mean of fluorescence intensity was observed on the surface skin of the wild-type mouse (green (phospho-IRF3); blue (DAPI)) (B). (N = 8 mice per group in total (two independent experiments with n = 4 animals/group). Bar = 10 μm)). The intensity of immunofluorescence within the epidermis was quantified using ImageJ software. The mean fluorescence intensity was higher in the stained cells of the wild-type mouse compared to the values for the MyD88−/ knockout mice (C). Statistical test: we performed one-way ANOVA, followed by Tukey’s multiple comparison test (* p < 0.05). The results represent the mean ± SE values from 8 animals per group in total (two independent experiments with n = 4 animals/group).
Figure 11
Figure 11
Schematic diagram of the TLR3-dependent activation of MyD88 signaling: TLR3 activation triggers endogenous ligands of TLR2 (HMGB1 and Hsp60) via the usage of the MyD88 signaling pathway. These endogenous TLR2 ligands then stimulate TLR2 signaling to augment the innate immune responses.

Similar articles

Cited by

References

    1. Kawai T., Akira S. The role of pattern-recognition receptors in innate immunity: Update on Toll-like receptors. Nat. Immunol. 2010;11:373–384. doi: 10.1038/ni.1863. - DOI - PubMed
    1. Alkanani A.K., Hara N., Lien E., Ir D., Kotter C.V., Robertson C.E., Wagner B.D., Frank D.N., Zipris D. Induction of diabetes in the RIP-B7.1 mouse model is critically dependent on TLR3 and MyD88 pathways and is associated with alterations in the intestinal microbiome. Diabetes. 2014;63:619–631. doi: 10.2337/db13-1007. - DOI - PubMed
    1. Beklen A., Sarp A.S., Uckan D., Tsaous Memet G. The function of TLR4 in interferon gamma or interleukin-13 exposed and lipopolysaccharide stimulated gingival epithelial cell cultures. Biotech. Histochem. 2014;89:505–512. doi: 10.3109/10520295.2014.903299. - DOI - PubMed
    1. Latorre E., Mendoza C., Layunta E., Alcalde A.I., Mesonero J.E. TLR2, TLR3, and TLR4 activation specifically alters the oxidative status of intestinal epithelial cells. Cell Stress Chaperones. 2014;19:289–293. doi: 10.1007/s12192-013-0461-8. - DOI - PMC - PubMed
    1. Liang L., Tan X., Zhou Q., Tian Y., Kijlstra A., Yang P. TLR3 and TLR4 But not TLR2 are involved in vogt-koyanagi- harada disease by triggering proinflammatory cytokines production through promoting the production of mitochondrial reactive oxygen species. Curr. Mol. Med. 2015;15:529–542. doi: 10.2174/1566524015666150731095611. - DOI - PubMed

Publication types

MeSH terms