

Profiling Individual Differences in Alcoholic Beverage Preference and Consumption: New Insights from a Large-Scale Study
- PMID: 32824622
- PMCID: PMC7466201
- DOI: 10.3390/foods9081131
Profiling Individual Differences in Alcoholic Beverage Preference and Consumption: New Insights from a Large-Scale Study
Abstract
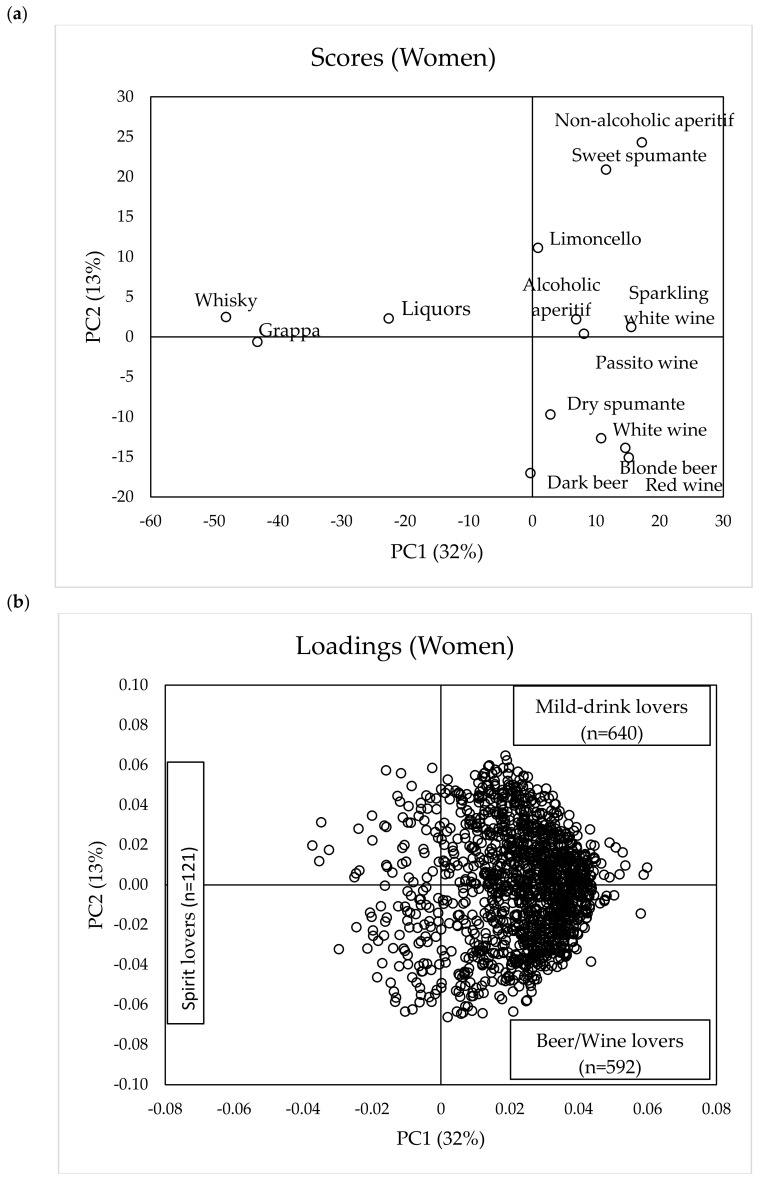
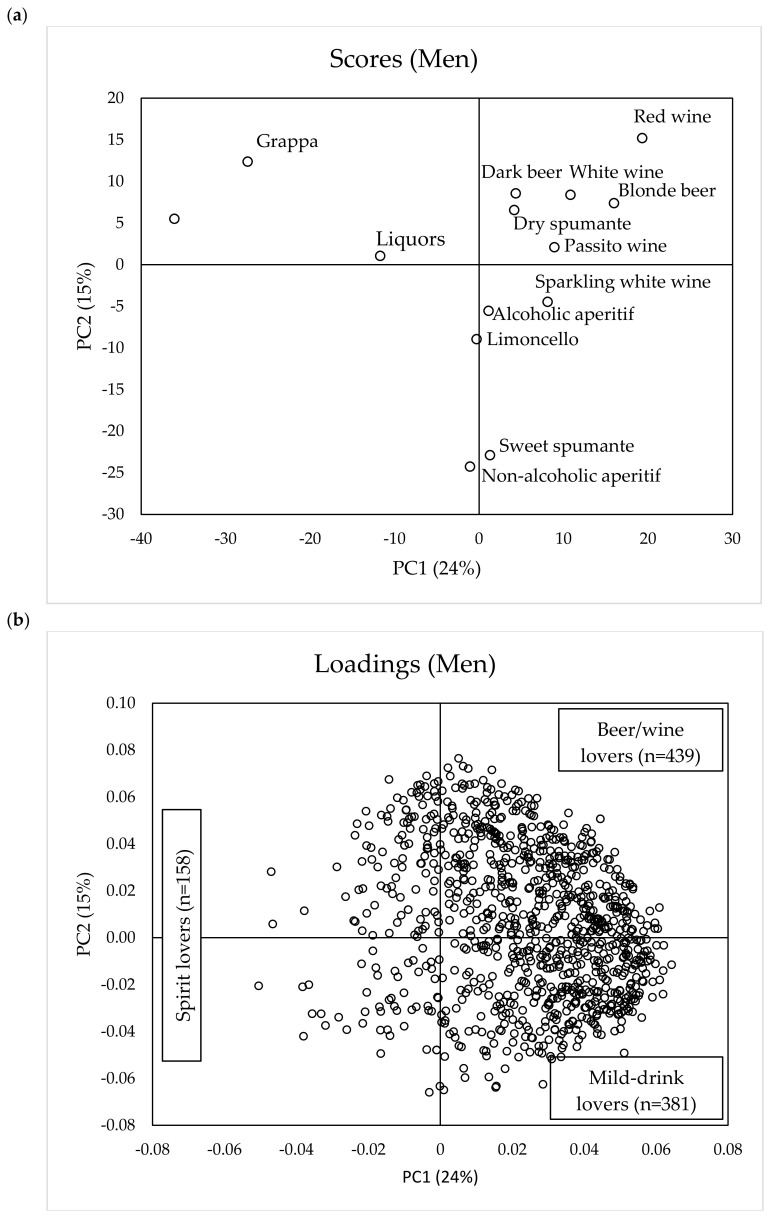
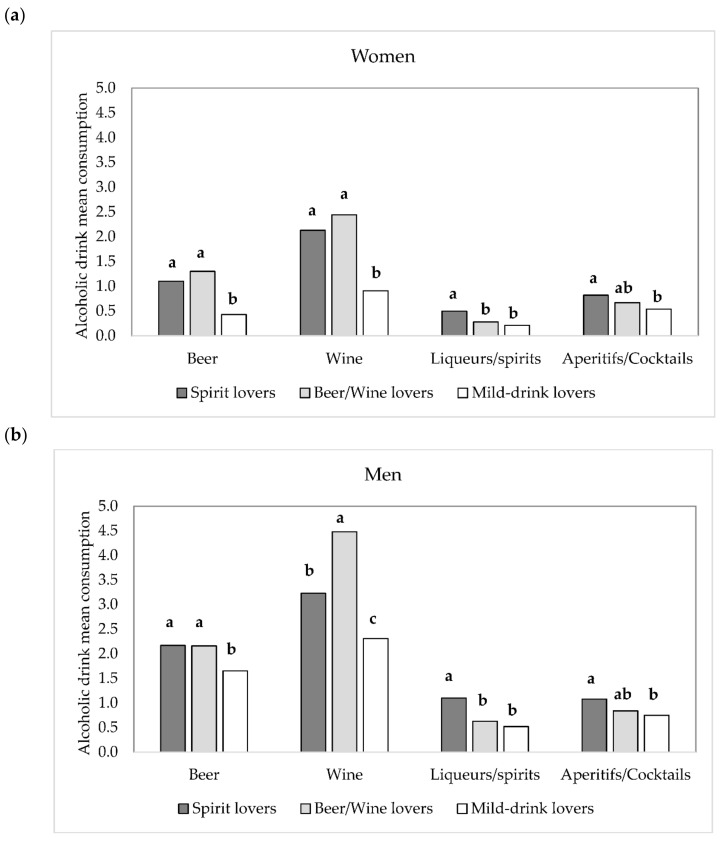
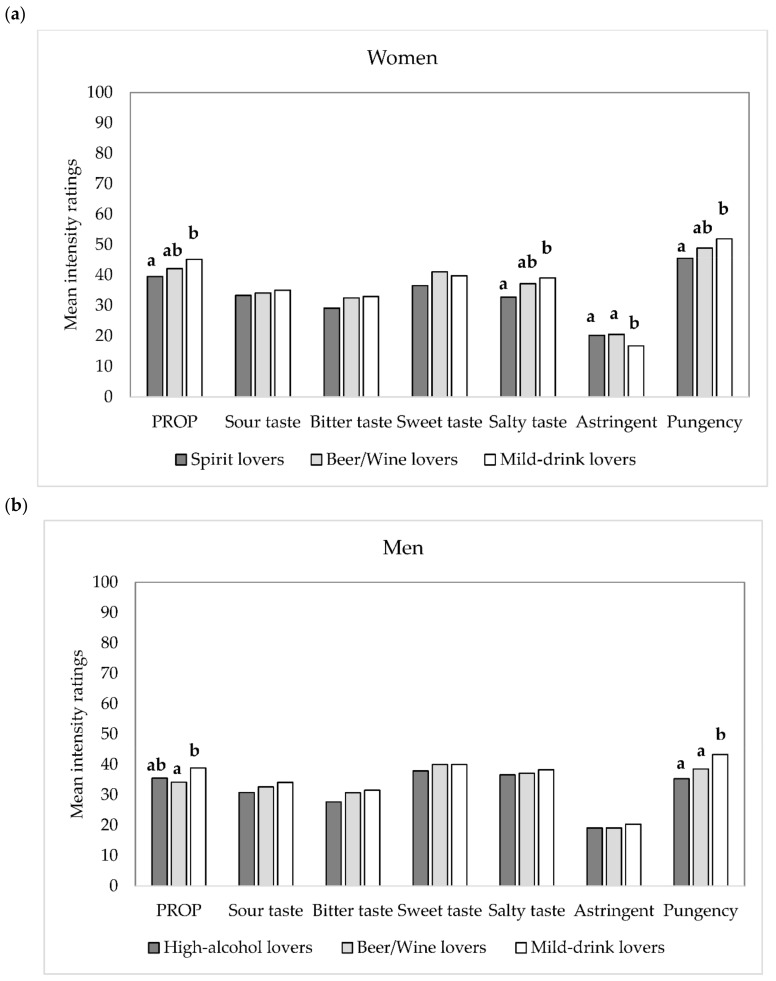
Alcoholic beverage consumption plays an important role in European culture, and in many contexts drinking alcohol is socially acceptable and considered part of the diet. Understanding the determinants of alcohol preference and consumption is important not only for disease prevention, intervention, and policy management, but also for market segmentation, product development, and optimization. The aim of the study was to investigate the effect of individual responsiveness to various oral sensations on self-reported liking and intake of 14 alcoholic and non-alcoholic beverages (including beers, wines, spirits, and cocktails) considering gender, age, and oral responsiveness (measured through response to 6-n-propyl-2-thiouracil -PROP, basic tastes, astringency, and pungency) in a large sample of Italian consumers. Data were collected from 2388 respondents (age range 18-60 years; mean age = 37.6, SD = 13.1; 58.2% women). These results indicate that notwithstanding the strong gender difference, with women generally liking and consuming fewer alcoholic beverages than men, liking patterns in the two genders were similar. Three liking patterns for different alcoholic beverages largely driven by orosensory properties were identified in both genders. "Spirit-lovers" constituted the smallest group (12%), consumed alcoholic beverages of any kind (not only spirits) more than the other segments, and were mainly men aged 30-45. "Beer/wine lovers" (44%) were the oldest group with no difference by gender. "Mild-drink lovers" (44%) liked alcoholic drinks with intense sweet taste and/or mixers that moderate ethanol perception. They were mainly women, aged 18-29, had a lower consumption of alcohol, and a higher orosensory responsiveness than the other two groups. The results also suggest the opportunity to develop personalized recommendations towards specific consumer segments based not only on socio-demographics but considering also perceptive variables. Finally, our data suggest that increased burning and bitterness from alcohol may act as a sensory hindrance to alcoholic beverage overconsumption.
Keywords: PROP; age; beer; cocktails; consumer segmentation; gender; spirits; taste responsiveness; wine.
Conflict of interest statement
The authors declare no conflict of interest.
Figures
Similar articles
-
Sweet liking predicts liking and familiarity of some alcoholic beverages, but not alcohol intake: A population study using a split-sample approach.Food Res Int. 2024 May;183:114155. doi: 10.1016/j.foodres.2024.114155. Epub 2024 Feb 23. Food Res Int. 2024. PMID: 38760118
-
Preference mapping of lemon lime carbonated beverages with regular and diet beverage consumers.J Food Sci. 2013 Feb;78(2):S320-8. doi: 10.1111/1750-3841.12028. Epub 2013 Jan 16. J Food Sci. 2013. PMID: 23323610
-
Sweet and bitter tastes of alcoholic beverages mediate alcohol intake in of-age undergraduates.Physiol Behav. 2005 Jan 17;83(5):821-31. doi: 10.1016/j.physbeh.2004.10.004. Epub 2004 Nov 21. Physiol Behav. 2005. PMID: 15639168 Clinical Trial.
-
The role of taste in alcohol preference, consumption and risk behavior.Crit Rev Food Sci Nutr. 2019;59(4):676-692. doi: 10.1080/10408398.2017.1387759. Epub 2017 Nov 13. Crit Rev Food Sci Nutr. 2019. PMID: 28980828 Review.
-
Cheers, proost, saúde: Cultural, contextual and psychological factors of wine and beer consumption in Portugal and in the Netherlands.Crit Rev Food Sci Nutr. 2017 May 3;57(7):1340-1349. doi: 10.1080/10408398.2014.969396. Crit Rev Food Sci Nutr. 2017. PMID: 26560863 Review.
Cited by
-
The Effects of Cranberry Polyphenol Extract (CPE) Supplementation on Astringency and Flavor Perception as a Function of PROP Taster Status and Other Individual Factors.Int J Environ Res Public Health. 2022 Sep 22;19(19):11995. doi: 10.3390/ijerph191911995. Int J Environ Res Public Health. 2022. PMID: 36231300 Free PMC article.
-
The Individual Differences in the Perception of Oral Chemesthesis Are Linked to Taste Sensitivity.Foods. 2021 Nov 8;10(11):2730. doi: 10.3390/foods10112730. Foods. 2021. PMID: 34829011 Free PMC article.
-
The interplay of food-related lifestyle and eating behavior in Italian women.Front Nutr. 2024 Feb 6;11:1338925. doi: 10.3389/fnut.2024.1338925. eCollection 2024. Front Nutr. 2024. PMID: 38379543 Free PMC article.
-
A Novel Quantitative Prediction Approach for Pungency Level of Chinese Liquor (Baijiu) Based on Infrared Thermal Imager.Foods. 2021 May 17;10(5):1107. doi: 10.3390/foods10051107. Foods. 2021. PMID: 34067651 Free PMC article.
-
Application of Conjoint Analysis and 5Ps Marketing Mix in Identifying Customer Preference of Alcohol Consumption among Youths in the Philippines.Foods. 2023 Mar 26;12(7):1401. doi: 10.3390/foods12071401. Foods. 2023. PMID: 37048221 Free PMC article.
References
-
- Silva A.P., Jager G., Van Zyl H., Voss H.P., Pintado M., Hogg T., De Graaf C. Cheers, proost, saúde: Cultural, contextual and psychological factors of wine and beer consumption in Portugal and in the Netherlands. Crit. Rev. Food Sci. Nutr. 2017;57:1340–1349. doi: 10.1080/10408398.2014.969396. - DOI - PubMed
-
- World Health Organization . Global Status Report on Alcohol and Health 2018. WHO; Geneva, Switzerland: 2018.
-
- Bratberg G.H., Wilsnack S.J., Wilsnack R., Haugland S.H., Krokstad S., Sund E.R., Bjørngaard J.H. Gender differences and gender convergence in alcohol use over the past three decades (1984–2008), The HUNT Study, Norway. BMC Public Health. 2016;16:723. doi: 10.1186/s12889-016-3384-3. - DOI - PMC - PubMed
