. 2020 Aug 19;9(9):1919.
doi: 10.3390/cells9091919.

Annexin A2 Mediates Dysferlin Accumulation and Muscle Cell Membrane Repair

Affiliations

Annexin A2 Mediates Dysferlin Accumulation and Muscle Cell Membrane Repair

Daniel C Bittel et al. Cells. .

Abstract

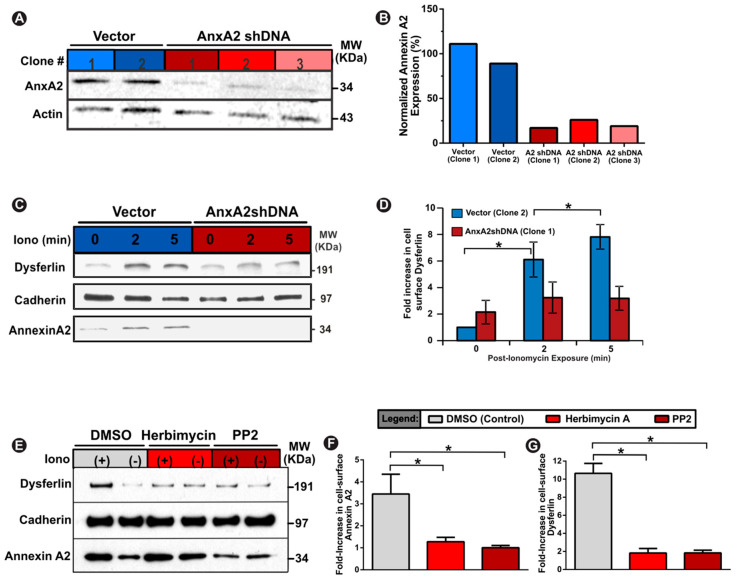
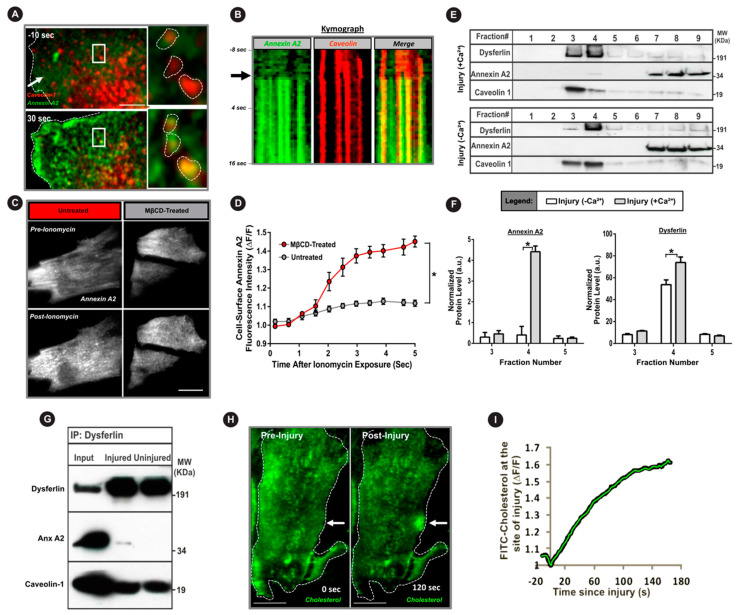
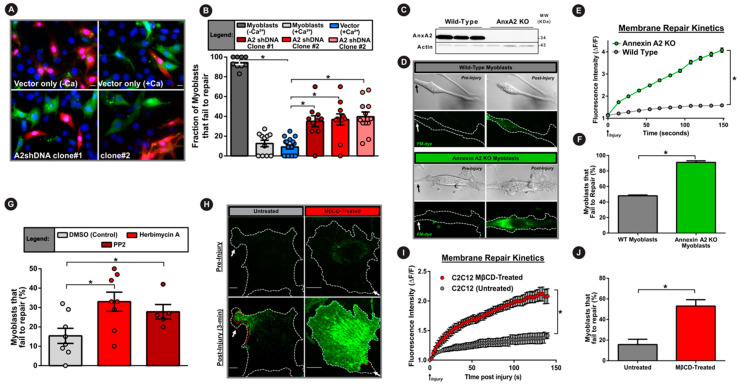
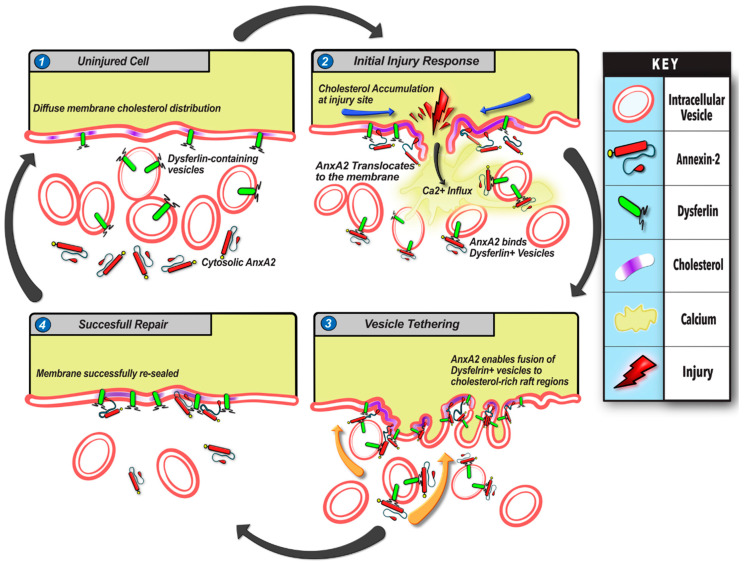
Muscle cell plasma membrane is frequently damaged by mechanical activity, and its repair requires the membrane protein dysferlin. We previously identified that, similar to dysferlin deficit, lack of annexin A2 (AnxA2) also impairs repair of skeletal myofibers. Here, we have studied the mechanism of AnxA2-mediated muscle cell membrane repair in cultured muscle cells. We find that injury-triggered increase in cytosolic calcium causes AnxA2 to bind dysferlin and accumulate on dysferlin-containing vesicles as well as with dysferlin at the site of membrane injury. AnxA2 accumulates on the injured plasma membrane in cholesterol-rich lipid microdomains and requires Src kinase activity and the presence of cholesterol. Lack of AnxA2 and its failure to translocate to the plasma membrane, both prevent calcium-triggered dysferlin translocation to the plasma membrane and compromise repair of the injured plasma membrane. Our studies identify that Anx2 senses calcium increase and injury-triggered change in plasma membrane cholesterol to facilitate dysferlin delivery and repair of the injured plasma membrane.

Keywords: muscle injury; muscular dystrophy; plasma membrane; vesicle.


Conflict of interest statement

The authors declare no conflict of interest.

Figures

Figure 1
Figure 1
Annexin 2 and dysferlin co-accumulate at injured myoblast membrane. (AD) Confocal images of (A) myoblasts and (C) myotubes expressing AnxA2-GFP (green) during focal laser injury (site marked by white arrow). (B,D) Plots showing the intensity of AnxA2-GFP at the site of membrane injury in myoblasts injured in the presence or absence of extracellular calcium (B) and in myotubes injured in the presence of extracellular calcium (D). (n = 12 cells/myotubes per condition, B: * p < 0.05, main effect of treatment condition). (E,F) Confocal images of glass-bead-injured myoblasts stained for (E) endogenous AnxA2 or (F) AnxA2 and dysferlin. Arrows indicate the site of glass bead injury. Inset in panel F shows vesicle in the injury-proximal region (marked by white box). (G) Confocal images at the membrane-coverslip interface of dysferlin-mCherry and AnxA2-GFP co-transfected myoblasts injured in the presence of calcium (arrow marks the injury site). Images in the inset are of the white box showing rapid AnxA2 translocation to dysferlin-containing vesicles prior to its fusion. Kymograph depicts the vesicles highlighted in G and spans the duration of the repair response, beginning at eight seconds prior to injury—black arrow indicates time of membrane injury. (H) TIRFM images of dysferlin-GFP-expressing myoblasts with the inset representing the white box and showing fusion of a single dysferlin-containing vesicle following injury (white arrow). Scale bar = 10 um. (I) Plots showing averaged fluorescence intensity of dysferlin-GFP vesicles imaged using TIRFM. Green trace depicts total fluorescence intensity. Blue trace shows peak fluorescence intensity. Red trace shows the area (width2) of the dysferlin-GFP fluorescence over the course of vesicle fusion and beyond. Traces are the average of n = 5 cells (5–10 dysferlin vesicles per cell). All data are presented as mean ± SEM. * p < 0.05 vs. -calcium condition determined via mixed model ANOVA with analyses for interaction effects between treatment condition and time. Scale bar = 10 µm (insets = 1 um).
Figure 2
Figure 2
Annexin A2 enables Ca2+-dependent increase in cell surface dysferlin. (A,B) Western blot images (A) and quantification (B) of control vector clones and Annexin A2 knockdown clones demonstrating ≤ 20% annexin A2 expression. (C) Western blot images and (D) quantification of cell-surface dysferlin in vector and annexin 2 knockdown cells at specified timepoints after calcium stimulation with calcium ionophore. (E) Western blot images and (F,G) quantification of cell-surface dysferlin and annexin 2 in ionomycin-treated cells co-treated with either DMSO (control) or annexin 2 phosphorylation inhibitors (herbimcyin A and PP2). Fold-increase values represent intensity of specific protein band normalized to respective cadherin protein band. Data is presented as mean ± SEM, n = 3 biological replicates. * p < 0.05 vs. Vector Clone 2 (B,D) or DMSO (F,G). (B,F,G) assessed via one-way ANOVA, (D) assessed via repeated measures ANOVA, alpha set at p < 0.05.
Figure 3
Figure 3
Injury causes binding of annexin A2 with dysferlin and co-accumulation in cholesterol-rich membrane domains. (A) TIRFM images of myoblasts co-expressing caveolin-1-RFP (red) and AnxA2-GFP (green) following laser injury (white arrow) in the presence of calcium. Inset shows zoom of white boxes demonstrating injury-induced translocation of AnxA2 to caveolin-enriched membrane domains. (B) Kymograph showing colocalization kinetics of AnxA2 (green) at the caveolin-rich membrane regions (red) following PM injury. Kymograph spans the duration of repair response beginning at eight seconds pre-injury and the black arrow indicates time of injury. (C) TIRFM images and (D) plot quantifying AnxA2 (white) membrane translocation upon calcium stimulation (ionomycin) in untreated and cholesterol-depleted (MβCD-treated) cells (n = 20 cells per condition, 4 biological repeats). (E) Western blot images and (F) quantification of the membrane fraction of myoblasts injured in the presence or absence of extracellular calcium (n = 4). (G) Western blot of injured and uninjured myoblasts immunoprecipitated using anti-dysferlin antibody and probed for AnxA2 and caveolin co-immunoprecipitation. (H,I) Confocal images (H) and quantification (I) of FITC-cholesterol after focal laser injury (white arrow) in a myoblast. All data are presented as mean ± SEM. * p < 0.05 vs. - MβCD-treated (D) or Ca2+ condition (F). Differences in the kinetics of cell-surface AnxA2-GFP upon ionomycin exposure (D), determined via mixed model ANOVA with analyses for interaction effects between treatment condition and time. Differences in membrane fraction protein quantification (F), determined via repeated-measures ANOVA. Scale bar = 10 µm.
Figure 4
Figure 4
Annexin A2 and its PM translocation are required for myoblast cell membrane repair. (A) Images of myoblasts subjected to glass bead injury in the presence of FITC dextran (green) followed by TRITC dextran (red) to mark cells that failed to repair. (B) Quantification of the proportion of injured myoblasts that fail to repair (300 cells per condition, n = 3). (C) Western blot demonstrating presence or complete lack of AnxA2 protein in primary myoblasts isolated from wild-type and AnxA2 knockout mice respectively. (D) Brightfield and confocal images of FM dye (green) fluorescence in primary myoblasts prior to or following laser injury. (E) Plot showing the kinetics of intracellular FM dye fluorescence intensity change during PM repair in wild-type (green) and AnxA2-knockout myoblasts (gray) (n = 12 cells per condition). (F) Plot quantifying of the proportion of primary myoblasts that fail to repair following laser membrane injury (60–70 cells per condition, n = 4). (G) Plot demonstrating the proportion of myoblasts that fail to repair from glass bead injury (as for A,B) following Src tyrosine kinase inhibition with herbimycin A or PP2 (200 cells per condition, n = 5). (H) Confocal images of untreated (left) or cholesterol-depleted (right) myoblasts pre- and 3 min. post injury (site marked by white arrow) in the presence of extracellular FM dye (green). (I) Plot showing the averaged kinetics of FM-dye entry in untreated and cholesterol-depleted cells (n = 30 cells each). (J) Plot quantifying the proportion of untreated or cholesterol-extracted C2C12 myoblasts that fail to repair (30 cells per condition, n = 3). Data is presented as mean ± SEM. * p < 0.05 vs. vector-control cells (B), wild-type cells (E,F), DMSO-treated cells (G), and MβCD-treated cells (I,J). Treatment induced differences in myoblast repair was assessed via one-way ANOVA (B,G) or an independent samples t-test (F,J). For kinetics analysis (E,I) mixed model ANOVA with analyses for interaction effects between treatment condition and time was used (* p < 0.05, main effect of condition). Scale bar = 10 µm.
Figure 5
Figure 5
Model for annexin 2-mediated myoblast cell membrane repair. Summary of events (14) involved in myoblast membrane repair based on results of this study. (1) In the uninjured cell, AnxA2 is distributed diffusely in the cytosol, while cholesterol microdomains and associated dysferlin are distributed diffusely in the plasma membrane. Additionally, dysferlin also localizes on intracellular vesicles. (2) Injury to the cell membrane induces rapid influx of extracellular Ca2+ ions through the ruptured membrane followed by cholesterol accumulation at the injury site, AnxA2 phosphorylation, leading to its association with dysferlin and plasma membrane lipids and cholesterol-rich microdomains. (3) AnxA2 binding promotes fusion of dysferlin-containing vesicles with the injured membrane. (4) Through the cholesterol and AnxA2-mediated exocytosis of dysferlin-containing vesicles, the cell membrane level of dysferlin increases concomitantly with the repair of the wounded membrane. This allows the cell to return to a pre-injury state with redistribution of AnxA2, cholesterol, and dysferlin to their resting state. Impairment in any step of this repair pathway—reduction in AnxA2, lack of calcium influx, cholesterol depletion, or impairment of Annexin 2 phosphorylation—interferes with myoblast membrane repair.

Similar articles

Cited by

References

    1. McNeil P.L., Khakee R. Disruptions of muscle fiber plasma membranes. Role in exercise-induced damage. Am. J. Pathol. 1992;140:1097–1109. - PMC - PubMed
    1. Demonbreun A.R., McNally E.M. Plasma Membrane Repair in Health and Disease. Curr. Top. Membr. 2016;77:67–96. doi: 10.1016/bs.ctm.2015.10.006. - DOI - PMC - PubMed
    1. Bashir R., Britton S., Strachan T., Keers S., Vafiadaki E., Lako M., Richard I., Marchand S., Bourg N., Argov Z., et al. A gene related to Caenorhabditis elegans spermatogenesis factor fer-1 is mutated in limb-girdle muscular dystrophy type 2B. Nat. Genet. 1998;20:37–42. doi: 10.1038/1689. - DOI - PubMed
    1. Bansal D., Miyake K., Vogel S.S., Groh S., Chen C.-C., Williamson R., McNeil P.L., Campbell K.P. Defective membrane repair in dysferlin-deficient muscular dystrophy. Nature. 2003;423:168–172. doi: 10.1038/nature01573. - DOI - PubMed
    1. Ho M., Post C.M., Donahue L.R., Lidov H.G., Bronson R.T., Goolsby H., Watkins S.C., Cox G.A., Brown R.H. Disruption of muscle membrane and phenotype divergence in two novel mouse models of dysferlin deficiency. Hum. Mol. Genet. 2004;13:1999–2010. doi: 10.1093/hmg/ddh212. - DOI - PubMed

Publication types

MeSH terms

LinkOut - more resources