. 2020 Aug 19;6(3):141.
doi: 10.3390/jof6030141.

The Penicillium chrysogenum Q176 Antimicrobial Protein PAFC Effectively Inhibits the Growth of the Opportunistic Human Pathogen Candida albicans

Affiliations

The Penicillium chrysogenum Q176 Antimicrobial Protein PAFC Effectively Inhibits the Growth of the Opportunistic Human Pathogen Candida albicans

Jeanett Holzknecht et al. J Fungi (Basel). .

Abstract

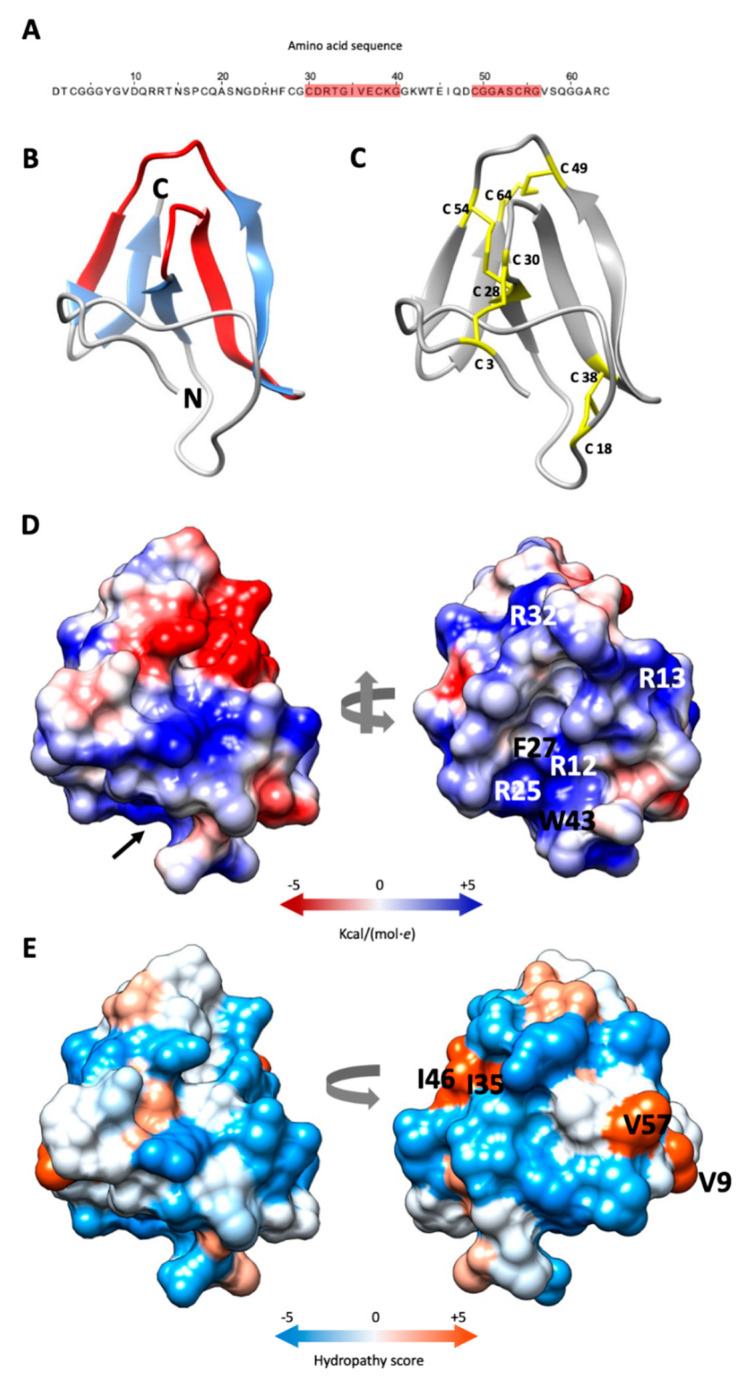
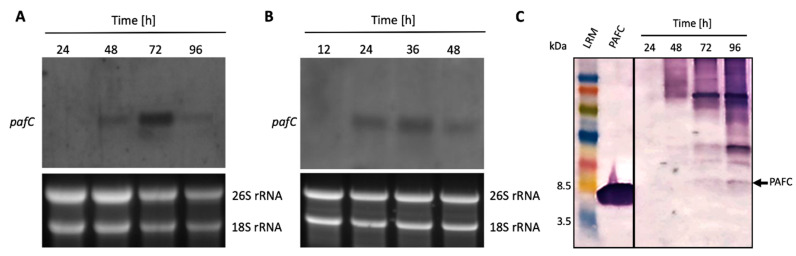
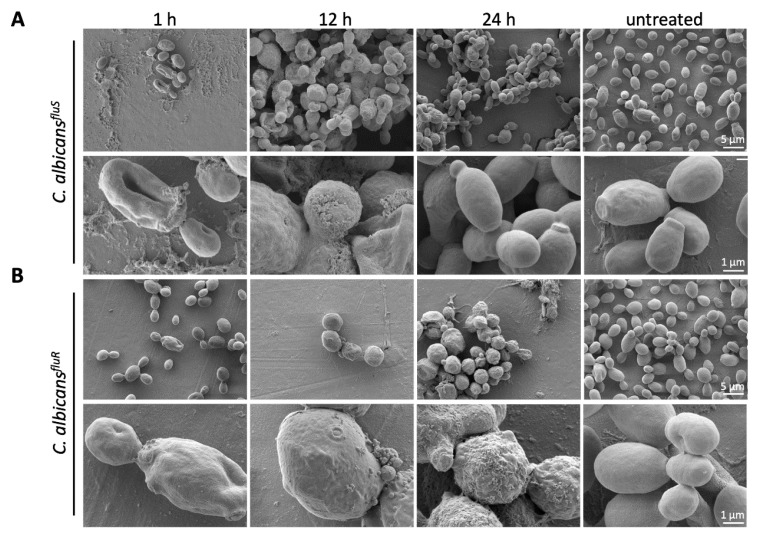
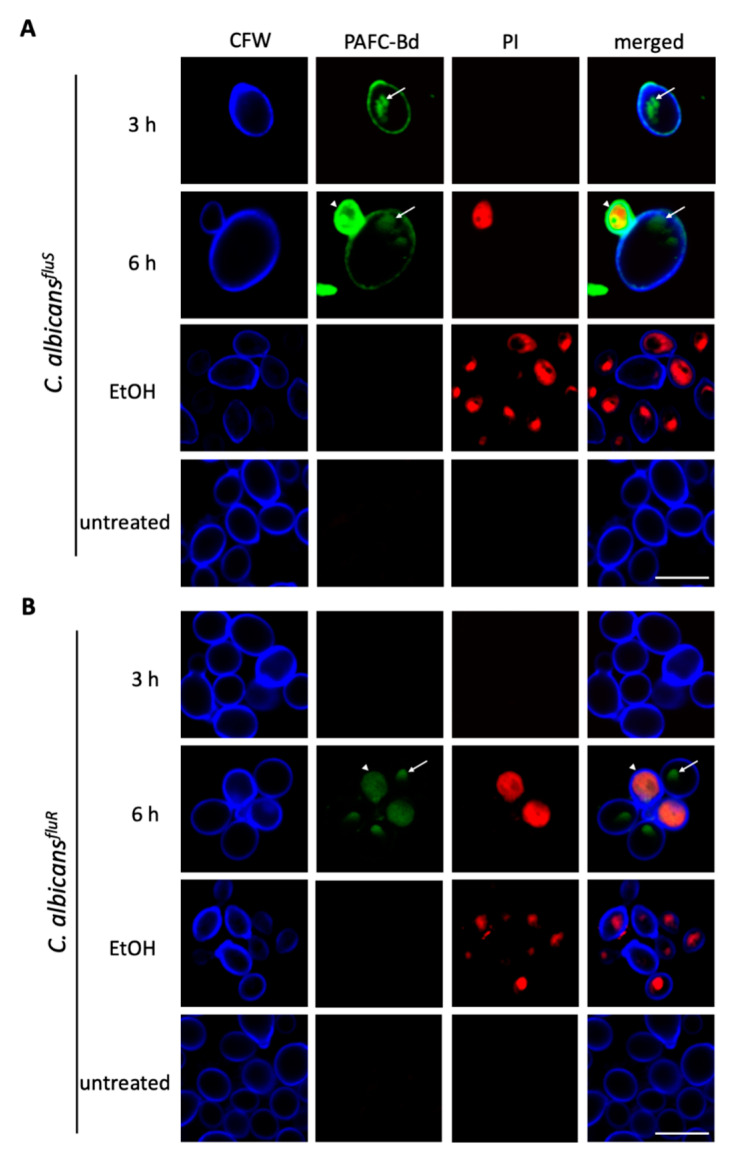
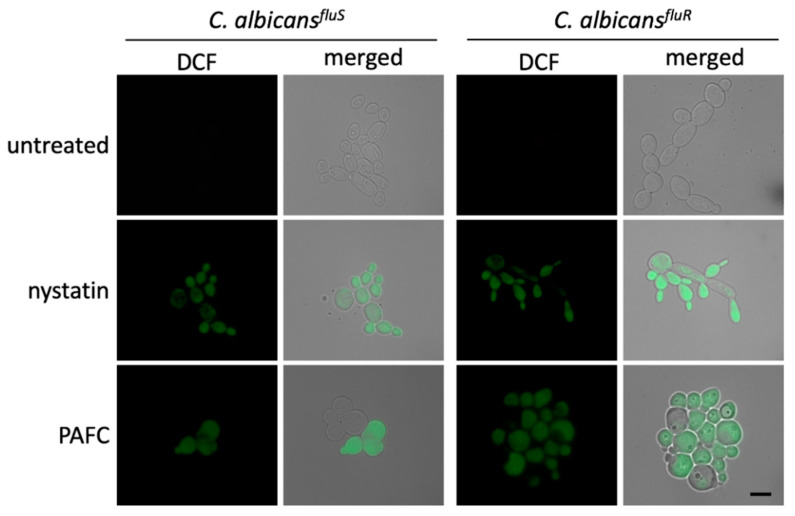
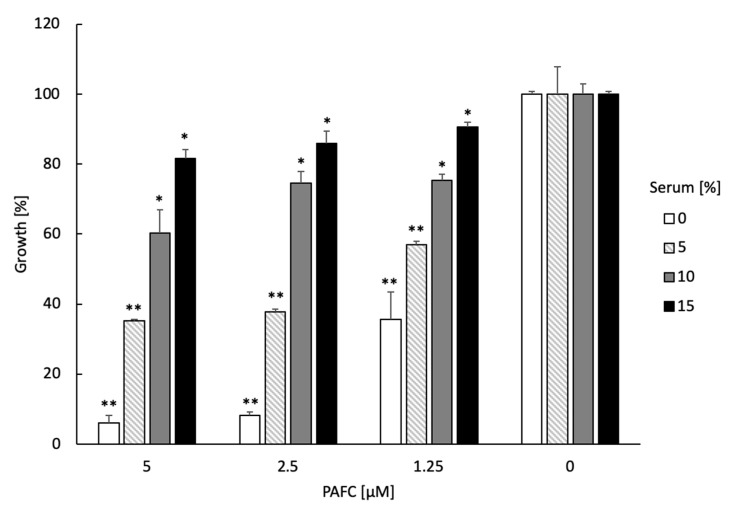
Small, cysteine-rich and cationic antimicrobial proteins (AMPs) from filamentous ascomycetes promise treatment alternatives to licensed antifungal drugs. In this study, we characterized the Penicillium chrysogenum Q176 antifungal protein C (PAFC), which is phylogenetically distinct to the other two Penicillium antifungal proteins, PAF and PAFB, that are expressed by this biotechnologically important ascomycete. PAFC is secreted into the culture broth and is co-expressed with PAF and PAFB in the exudates of surface cultures. This observation is in line with the suggested role of AMPs in the adaptive response of the host to endogenous and/or environmental stimuli. The in silico structural model predicted five β-strands stabilized by four intramolecular disulfide bonds in PAFC. The functional characterization of recombinant PAFC provided evidence for a promising new molecule in anti-Candida therapy. The thermotolerant PAFC killed planktonic cells and reduced the metabolic activity of sessile cells in pre-established biofilms of two Candidaalbicans strains, one of which was a fluconazole-resistant clinical isolate showing higher PAFC sensitivity than the fluconazole-sensitive strain. Candidacidal activity was linked to severe cell morphology changes, PAFC internalization, induction of intracellular reactive oxygen species and plasma membrane disintegration. The lack of hemolytic activity further corroborates the potential applicability of PAFC in clinical therapy.

Keywords: Candida albicans; PAFC; Penicillium chrysogenum antimicrobial protein C; cell death; exudate; plasma membrane permeabilization; reactive oxygen species.


Conflict of interest statement

The funders had no role in the design of the study; in the collection, analyses, or interpretation of data; in the writing of the manuscript, or in the decision to publish the results.

Figures

Figure 1
Figure 1
Predicted structure of PAFC. (A) Amino acid sequence (aa) of PAFC with the two predicted γ-core motifs highlighted in red. (B) Ribbon representation of PAFC in UCSF Chimera protein visualization and analysis software [21] depicting the structure of the β-strands (blue) and location of the two γ-cores (red), the N- and C-terminus is indicated. (C) Disulfide bonding of PAFC is shown with yellow sticks. (D) Surface representation of PAFC in two orientations colored according to electrostatic potential (blue: electropositive, red: electronegative). The model depicted on the right side visualizes the “mouth-like” cavity indicated by a black arrow in the left model. The basic aas surrounding the opening and the aa forming the funnel base are indicated. (E) Distribution of hydrophobic and hydrophilic patches on the surface of PAFC in two orientations colored according to the Kyte-Doolittle scale (blue: hydrophilic, orange: hydrophobic). The aas forming the hydrophobic patches are indicated in the model on the right.
Figure 2
Figure 2
Expression of the PAFC encoding gene and protein. Total RNA was extracted from (A) mycelium grown in submersed and (B) synchronized surface cultures up to 96 h. Ten μg of total RNA was loaded per lane on a 1.2% denaturing agarose gel, blotted onto a nylon membrane and hybridized with a pafC specific digoxigenin-labelled PCR probe (upper panels). Ethidium bromide-stained 26S and 18S rRNA provide loading controls (lower panels). (C) For Western blot analysis, 20 μL of the cell free supernatant from submersed cultures was loaded per lane, size fractionated on an 18% (w/v) SDS-polyacrylamide gel and transferred onto a nitrocellulose membrane. A polyclonal antibody generated against PeAfpC was used to probe for PAFC. Recombinant PAFC (0.5 μg) was used as a control for antibody binding. The black arrow indicates PAFC (6.6 kDa). LRM, low range rainbow marker (GE Healthcare Life Sciences, Little Chalfont, UK). The molecular weight marker bands of 3.5 kDa and 8.5 kDa are indicated.
Figure 3
Figure 3
Detection of PAFC in P. chrysogenum exudate. (A) Droplet formation on P. chrysogenum surface cultures grown on 1 × PcMM and 2 × PcMM for 120 h at 25 °C. Scale bar, 5 mm. (B) For Western blot analysis, 20 μL of droplets and exudate from cultures grown on 2 × PcMM were loaded per lane, fractionated on an 18% (w/v) SDS-polyacrylamide gel and transferred onto a nitrocellulose membrane. Polyclonal antibodies were used to detect PAFC, PAF and PAFB. As a control for antibody binding, 0.5 μg of the respective recombinant protein (PAFC, PAF and PAFB) was loaded per lane. LRM, low range rainbow marker (GE Healthcare Life Sciences, Little Chalfont, UK). The molecular weight marker bands of 3.5 kDa and 8.5 kDa are indicated.
Figure 4
Figure 4
SEM analysis of the impact of PAFC on the C. albicans cell morphology. (A) C. albicansfluS and (B) C. albicansfluR cells were incubated with 1 × IC90 (2.5 μM) PAFC or without PAFC (untreated) for 1 h, 12 h and 24 h at 30 °C with continuous shaking at 160 rpm. One representative image out of three replicates is shown in overview and high magnification, respectively. Scale bars are indicated in the images.
Figure 5
Figure 5
CLSM analysis of the cellular localization of PAFC and cell death induction. Cells of (A) C. albicansfluS and (B) C. albicansfluR were exposed to 1 × IC90 PAFC-Bd (2.5 μM) for 3 h, 6 h and 12 h and then stained with calcofluor white (CFW, 5 μg mL−1) and propidium iodide (PI, 5 μg mL−1) for 10 min. Control cells were left untreated. Sequential scanning was done for CFW (blue), PAFC-Bd (green) and PI (red) at 405, 488 and 543 nm, respectively. White arrows indicate vacuoles, white arrowheads dead cells. One representative image out of three replicates is shown. Scale bar, 5 μm.
Figure 6
Figure 6
Candidacidal activity of PAFC. CFU of (A) C. albicansfluS and (B) C. albicansfluR cells after PAFC treatment (2.5–10 μM) for 1 h, 8 h and 24 h. Untreated cells served as growth control and the CFU counts were set to be 100% surviving cells. The mean ± SD (technical quadruplicates of one representative experiment out of two biological replicates) is shown. A two-sample Student’s t-test was applied to calculate the significant difference between the treated samples compared to the untreated growth control (p ≤ 0.005 for all values shown, except for * p < 0.1).
Figure 7
Figure 7
Induction of iROS by PAFC. Fluorescence microscopy of DCF-positive C. albicansfluS and C. albicansfluR cells to visualize iROS burden after exposure to 1 × IC90 (2.5 µM) PAFC for 8 h at 30 °C and continuous shaking at 160 rpm. The samples were washed in PBS before incubation for 30 min with H2DCFDA (5 ng μL−1). Excess of fluorescent dye was removed by washing in PBS and the cells were mounted on glass slides for evaluation of iROS induction by fluorescence microscopy. Cells without treatment and exposed to nystatin (10 µg mL−1) were used as negative and iROS-positive controls, respectively. The merged images show the DCF signal (green) superimposed with the Candida cells visualized with brightfield microscopy. One representative experiment out of three independent experiments is shown. Scale bar, 5 μm.
Figure 8
Figure 8
Serum sensitivity of PAFC. The activity of 0.5 × IC90 (1.25 µM), 1 × IC90 (2.5 µM) and 2 × IC90 (5.0 µM) PAFC was tested on C. albicansfluS in the presence of increasing concentrations (0–15%) of inactivated fetal calf serum in a microdilution broth assay. Candida cells without PAFC treatment (0 µM) were used as control representing 100% growth in the presence of 0–15% serum. The mean ± SD (technical triplicate of one representative experiment out of two biological replicates) is shown. A two-sample Student’s t-test was applied to calculate the significant difference between the serum-treated samples compared to the untreated growth control (* p ≤ 0.05 and ** p ≤ 0.005).

References

    1. Vallabhaneni S., Mody R.K., Walker T., Chiller T. The global burden of fungal diseases. Infect. Dis. Clin. N. Am. 2016;30:1–11. doi: 10.1016/j.idc.2015.10.004. - DOI - PubMed
    1. Perlin D.S., Rautemaa-Richardson R., Alastruey-Izquierdo A. The global problem of antifungal resistance: Prevalence, mechanisms, and management. Lancet Infect. Dis. 2017;17:e383–e392. doi: 10.1016/S1473-3099(17)30316-X. - DOI - PubMed
    1. Berkow E.L. Fluconazole resistance in Candida species: A current perspective. Infect. Drug Resist. 2017;10:237–245. doi: 10.2147/IDR.S118892. - DOI - PMC - PubMed
    1. Nobile C.J., Johnson A.D. Candida albicans biofilms and human disease. Annu. Rev. Microbiol. 2005;69:71–92. doi: 10.1146/annurev-micro-091014-104330. - DOI - PMC - PubMed
    1. McManus D. Side effects of drugs annual: A worldwide yearly survey of new data in adverse drug reactions. In: Sidhartha D.R., editor. Antifungal Drugs. Volume 38. Elsevier; Amsterdam, The Netherlands: 2017. pp. 243–253.

LinkOut - more resources