Review
. 2020 Aug 20;13(17):3675.
doi: 10.3390/ma13173675.

A Comprehensive Review on Optical Properties of Polymer Electrolytes and Composites

Affiliations
Review

A Comprehensive Review on Optical Properties of Polymer Electrolytes and Composites

Shujahadeen B Aziz et al. Materials (Basel). .

Abstract

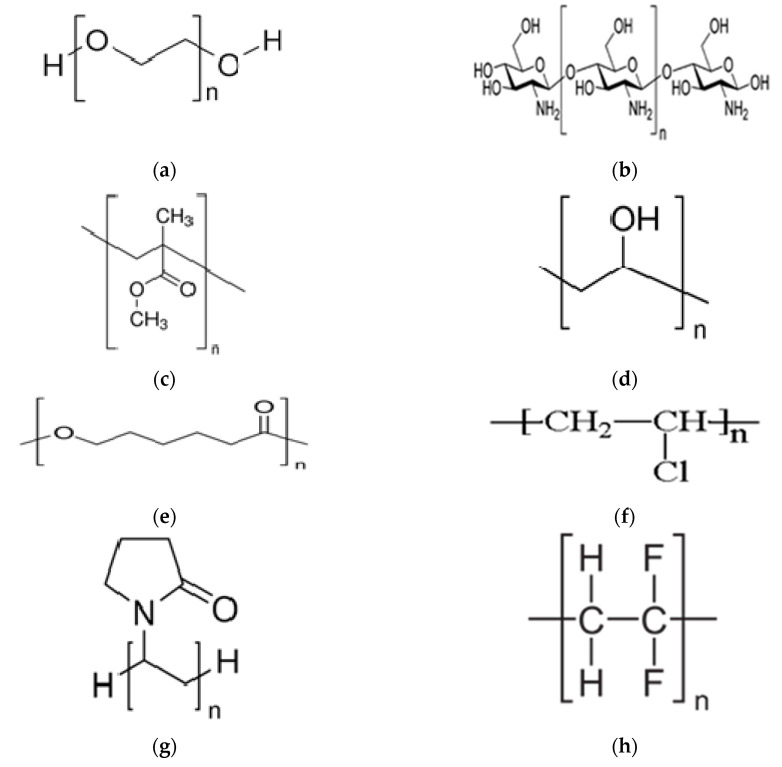
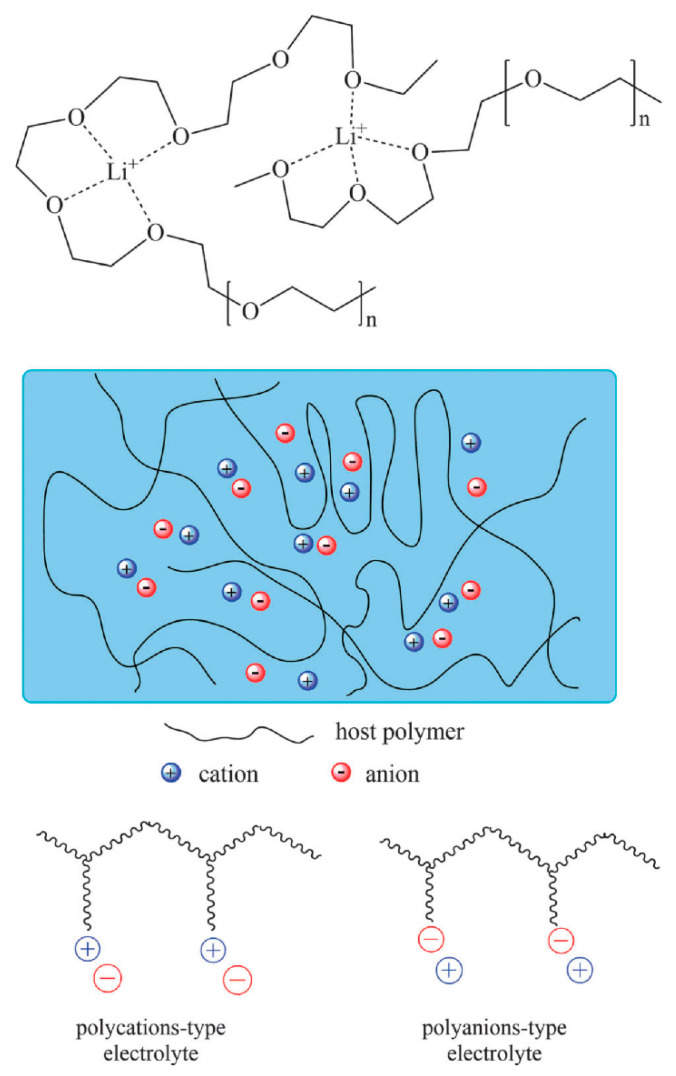
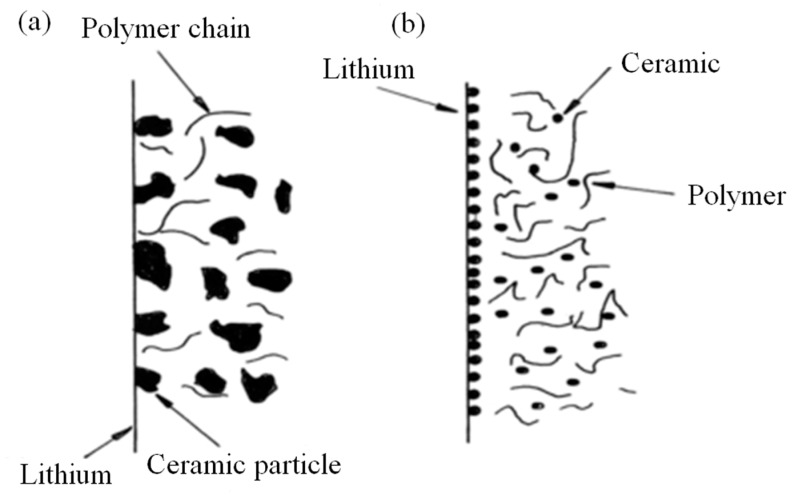
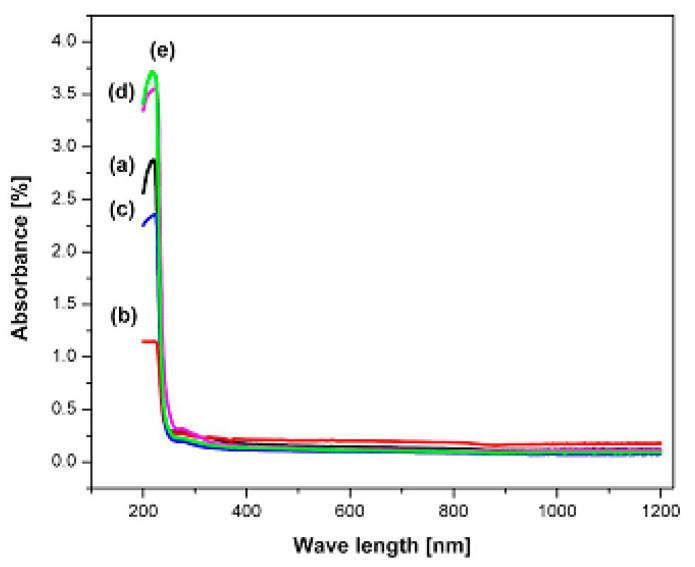
Polymer electrolytes and composites have prevailed in the high performance and mobile marketplace during recent years. Polymer-based solid electrolytes possess the benefits of low flammability, excellent flexibility, good thermal stability, as well as higher safety. Several researchers have paid attention to the optical properties of polymer electrolytes and their composites. In the present review paper, first, the characteristics, fundamentals, advantages and principles of various types of polymer electrolytes were discussed. Afterward, the characteristics and performance of various polymer hosts on the basis of specific essential and newly published works were described. New developments in various approaches to investigate the optical properties of polymer electrolytes were emphasized. The last part of the review devoted to the optical band gap study using two methods: Tauc's model and optical dielectric loss parameter. Based on recently published literature sufficient quantum mechanical backgrounds were provided to support the applicability of the optical dielectric loss parameter for the band gap study. In this review paper, it was demonstrated that both Tauc's model and optical dielectric loss should be studied to specify the type of electron transition and estimate the optical band gap accurately. Other parameters such as absorption coefficient, refractive index and optical dielectric constant were also explored.

Keywords: nanocomposite; optical dielectric loss; optical properties; polymer composite; polymer electrolyte; taucs model.


Conflict of interest statement

The authors declare no conflict of interest.

Figures

Figure 1
Figure 1
Various commonly used polar polymers structure in polymers electrolyte: (a) polyethylene oxide (PEO); (b) chitosan (CS); (c) poly methyl methacrylate (PMMA); (d) poly vinyl alcohol (PVA); (e) poly ξ-caprolactone (PCL); (f) poly vinyl chloride (PVC); (g) poly vinylpyrrolidone (PVP); (h) poly vinylidene fluoride (PVDF) [26,27].
Figure 2
Figure 2
Dry solid polymer electrolytes PEO with Li+ salt structure [35].
Figure 3
Figure 3
Illustration diagram of polymer host, nano/micrometer-sized inorganic doper within the polymer with particle radius: (a) micrometer; (b) nanometer [53].
Figure 4
Figure 4
UV absorption spectra of PVA-LiPF6 films (a) 100:0; (b) 95:05; (c) 90:10; (d) 85:15; (e) 80:20 [76].
Figure 5
Figure 5
UV–vis absorption spectra of pure and Mn2+-doped PVC polymer films: (a) pure; (b) 1 mol %; (c) 2 mol %; (d) 3 mol %; (e) 4 mol %; (f) 5 mol % [77].
Figure 6
Figure 6
Absorption spectra of pure CS and CS/CuI solid electrolyte films. The surface plasmonic resonance (SPR) peak appearing at approximately 667 nm for CS/CuI samples is related to the existence of Cu metallic NPs [78].
Figure 7
Figure 7
Absorption spectra of pure PVA (inset) and PVA/AgNt solid films. The SPR peak appearing at about 422 nm for PVA/AgNt samples is related to the existence of silver NPs [79].
Figure 8
Figure 8
UV–vis spectra of PS colloid, CuNPs colloid and CuNPs/PS colloid [91].
Figure 9
Figure 9
XRD patterns of PS, CuNPs and CuNPs/PS composites [91].
Figure 10
Figure 10
(A) Pure chitosan FTIR spectrum and (B) fabricated Cu-NPs in chitosan [97].
Figure 11
Figure 11
Surface plasmon resonance while the free electrons in the metal nanoparticles (NPs) derive into oscillation because of a robust interaction with incident light at a certain wavelength [102].
Figure 12
Figure 12
UV–vis spectra of chitosan–AgCF3SO3 before (room temperature) and after (high temperature) electrochemical impedance spectroscopy (EIS) [105].
Figure 13
Figure 13
The proposed structure for the fabrication copper (II)-complex [118].
Figure 14
Figure 14
The XRD of: (a) pure PVA; (b) PVA incorporated 0.02 M CdS; (c) PVA incorporated 0.04 M CdS; (d) pure CdS [133].
Figure 15
Figure 15
The pure PMMA and PMMA NCs absorption spectra of against wavelength. The films were specified as NCSP0, NCSP2, NCSP4, NCSP6 and NCSP8 for PMMA with 0 wt%, PMMA with 2 wt%, PMMA with 4 wt%, PMMA with 6 wt% and PMMA with 8 wt% of CuS, correspondingly [139].
Figure 16
Figure 16
Optical absorption versus wavelength for pure PVA/PVP and PVA/PVP doped with various molar ratios of Ag2S semiconductor particles [144].
Figure 17
Figure 17
X-ray diffraction pattern for (a) pure PVA, (b) pure TiO2 and (c) TiO2/PVA composites [154].
Figure 18
Figure 18
UV–visible absorption spectra for (a) pure PVA, (b) 1.5, (c) 2.5, (d) 5, (e) 7.5 (f) and 10 wt% TiO2 [154].
Figure 19
Figure 19
Films absorption spectra. Obviously, with a rising amount of carbon nanodots (CNDs), the absorption changes to longer wavelengths. All films were specified as CND0, CND1 and CND2 equivalent to doped PVA solution with 0 mL, 15 mL and 30 mL of 5 mg of dissolved CNDs, correspondingly [191].
Figure 20
Figure 20
CN-dots XRD spectrum at room temperature [191].
Figure 21
Figure 21
Pure PVA and PVA/CN-Dot XRD spectra. It is vital to observe that the PVA main peak is extra widened and its intensity reduced after the insertion of CN-dots. All films were specified as CND0 and CND2 equivalent to doped PVA with 0 mL and 30 mL of 5 mg of dissolved CNDs, correspondingly [191].
Figure 22
Figure 22
Graphene is a 2D building block of graphitic forms. It wraps to create 0D buckyball, rolls to create 1D nanotube, as well as stacks to create 3D graphite [206].
Figure 23
Figure 23
Pure PVVH and PVVH/GO nanocomposites absorption spectra in the range from 190 to 500 nm at ambient temperature [229].
Figure 24
Figure 24
XRD spectra for the pure PVVH copolymer and PVVH including dissimilar GO levels [229].
Figure 25
Figure 25
Halogen substituted polymethacrylates structure and values of refractive index [250,251].
Figure 26
Figure 26
Pure and doped PMMA refractive index. The samples were symbolized as NCSP0, NCSP2, NCSP4, NCSP6 and NCSP8 for PMMA with 0 wt%, PMMA with 2 wt%, PMMA with 4 wt%, PMMA with 6 wt% and PMMA with 8 wt% of CuS, correspondingly [139].
Figure 27
Figure 27
Optical dielectric constant spectra against wavelength for pure CS and doped CS films. The chitosan nanocomposite (CSN) films were symbolized as CSN0, CSN1, CSN2 and CSN3 for CS doped with 0 wt%, 4 wt%, 8 wt% and 12 wt% CuI, correspondingly [78].
Figure 28
Figure 28
Electronic transition (a) allowed direct, (b) forbidden direct, (c) allowed indirect and (d) forbidden indirect [303].
Figure 29
Figure 29
Energy bandgap and optical dielectric constant against amounts of CuS [281].
Figure 30
Figure 30
Energy band gap and refractive index (at 390 nm) of PMMA against CuS nanoparticles [139].

References

    1. Fenton D.E., Parker J.M., Wright P.V. Complexes of alkali metal ions with poly(ethylene oxide) Polymer. 1973;14:589. doi: 10.1016/0032-3861(73)90146-8. - DOI
    1. Bruce P.G. Solid State Electrochemistry. 1st ed. Cambridge University Press; Cambridge, UK: 1995. - DOI
    1. Hamsan M.H., Shukur M.F., Aziz S.B., Yusof Y.M., Kadir M.F.Z. Influence of NH4Br as an ionic source on the structural/electrical properties of dextran-based biopolymer electrolytes and EDLC application. Bull. Mater. Sci. 2019;43 doi: 10.1007/s12034-019-2008-9. - DOI
    1. Aziz S.B., Brza M.A., Hamsan M.H., Kadir M.F.Z., Muzakir S.K., Abdulwahid R.T. Effect of ohmic-drop on electrochemical performance of EDLC fabricated from PVA:Dextran:NH4I based polymer blend electrolytes. J. Mater. Res. Technol. 2020:1–12. doi: 10.1016/j.jmrt.2020.01.110. - DOI
    1. Hamsan M.H., Aziz S.B., Azha M.A.S., Azli A.A., Shukur M.F., Yusof Y.M., Muzakir S.K., Manan N.S.A., Kadir M.F.Z. Solid-state double layer capacitors and protonic cell fabricated with dextran from Leuconostoc mesenteroides based green polymer electrolyte. Mater. Chem. Phys. 2020;241 doi: 10.1016/j.matchemphys.2019.122290. - DOI

LinkOut - more resources