. 2020 Aug 20;9(9):772.
doi: 10.3390/antiox9090772.

The Catalytic Cycle of the Antioxidant and Cancer-Associated Human NQO1 Enzyme: Hydride Transfer, Conformational Dynamics and Functional Cooperativity

Affiliations

The Catalytic Cycle of the Antioxidant and Cancer-Associated Human NQO1 Enzyme: Hydride Transfer, Conformational Dynamics and Functional Cooperativity

Ernesto Anoz-Carbonell et al. Antioxidants (Basel). .

Abstract

Human NQO1 [NAD(H):quinone oxidoreductase 1] is a multi-functional and stress-inducible dimeric protein involved in the antioxidant defense, the activation of cancer prodrugs and the stabilization of oncosuppressors. Despite its roles in human diseases, such as cancer and neurological disorders, a detailed characterization of its enzymatic cycle is still lacking. In this work, we provide a comprehensive analysis of the NQO1 catalytic cycle using rapid mixing techniques, including multiwavelength and spectral deconvolution studies, kinetic modeling and temperature-dependent kinetic isotope effects (KIEs). Our results systematically support the existence of two pathways for hydride transfer throughout the NQO1 catalytic cycle, likely reflecting that the two active sites in the dimer catalyze two-electron reduction with different rates, consistent with the cooperative binding of inhibitors such as dicoumarol. This negative cooperativity in NQO1 redox activity represents a sort of half-of-sites activity. Analysis of KIEs and their temperature dependence also show significantly different contributions from quantum tunneling, structural dynamics and reorganizations to catalysis at the two active sites. Our work will improve our understanding of the effects of cancer-associated single amino acid variants and post-translational modifications in this protein of high relevance in cancer progression and treatment.

Keywords: antioxidant enzyme; antioxidant response; cancer; conformational dynamics; enzyme kinetic analysis; functional cooperativity; hydride transfer; kinetic isotope effects; oxidoreductase; quantum tunneling.


Conflict of interest statement

The authors declare no conflict of interest. The funders had no role in the design of the study; in the collection, analyses, or interpretation of data; in the writing of the manuscript, or in the decision to publish the results.

Figures

Figure A1
Figure A1
Viscosity dependence of NQO1 steady-state parameters. (A) Plot of (kcat/Km)o/(kcat/Km)η vs. ηrel. (B) (kcat)o/(kcat)η vs. ηrel. Dashed lines guide the eye along slopes with values of 1 and 0, respectively.
Figure 1
Figure 1
NQO1 catalytic mechanism and protein dynamics. (A) Plausible mechanism for the reductive and oxidative half-reactions (for details see the main text). FADH2 undergoes keto/enol tautomerism. Here, we show the initial and final structures of FAD in the enol tautomer. Some reaction steps require the enol or enolate tautomer. (B) Changes in NQO1 structural dynamics upon Dic binding from hydrogen-deuterium exchange (HDX) analysis [42]. The upper panel shows the position of the FAD, Y156 and H162 (involved in the stabilization of FADH2) and Y127 and Y129 (critical for Dic and NAD+ binding). (C and D) Dic binding. (C) leads to decreased dynamics in residues covering the whole active site, particularly regarding the inhibitor and the FAD binding sites that may contribute to optimizing HT from NAD(P)H and FADH2. (D) Δ%Dav is a simple stability metric that refers to the averaged maximal difference in HDX kinetics between two given ligation states according to [42], and a negative value for this parameter reflects an increase in local stability for a given protein segment upon ligand binding (i.e., either HDX is slower and/or its amplitude is reduced upon ligand binding, thus reflecting a locally stabilizing effect upon ligand binding). Note that residue numbering follows the full-length sequence of the protein.
Figure 2
Figure 2
Purification of NQO1. (A) Size-exclusion chromatography (SEC) chromatogram of NQO1 protein. About 20 mg of protein from IMAC (immobilized-metal affinity chromatography) were injected into a HiLoad® 16/600 Superdex® 200 pg (GE Healthcare) running on 20 mM HEPES-NaOH, 200 mM NaCl pH 7.4 at 20 °C. Void (V0) and total (VT) volumes are indicated. Fractions eluted between 75 and 90 mL were pooled and concentrated. The purity was checked by SDS-PAGE in 12% acrylamide gels (inset). (B) Concentrated protein was exchanged to HEPES-KOH 50 mM pH 7.4 and the UV–visible absorption spectrum was collected at a 20 μM protein concentration. The extinction coefficient of free FAD is indicated for sake of comparison.
Figure 3
Figure 3
Photoreduction of NQO1. Colored spectra correspond to different illumination time points throughout the photoreduction process. The dashed black line indicates the spectra corresponding to a sample chemically reduced by dithionite (S2O42−).
Figure 4
Figure 4
Kinetics of the NQO1 flavin reduction by NADH/D. (A) Spectral evolution on a 0−60 s timescale after mixing NQO1ox (7.5 μM) with NADH (7.5 µM) in 20 mM HEPES-KOH, pH 7.4, at 6 °C. Different colored lines correspond to the spectra at different reaction times. (B) Spectral deconvolution of intermediate species observed during the reaction when fitting to a four-state model and the corresponding calculated observed rate constants. In panels A and B, the dashed line represents the spectrum of NQO1ox before mixing. (C,D) Decay of kinetic traces at 450 nm and 475 nm and fittings to the model. (E) Dependence of kobs values on the NADH/D concentration. The trace for the fitting to Equation (1) for kobsA→B values is shown as a black line. Error bars correspond to the SD for at least three different replicates. Spectral evolution (A) and deconvolution (B) are from a single measurement and representative from n > 3.
Figure 5
Figure 5
Kinetics of the NQO1 flavin reduction by NADPH. (A) Spectral evolution on a 0–0.5 s timescale after the mixing NQO1ox (7.5 μM) with NADH (7.5 µM) in 20 mM HEPES-KOH, pH 7.4, at 6 °C. Different colored lines correspond to the spectra at different reaction times. The inset shows the decay of kinetic traces at 450 nm and 475 nm, the fittings to the model, and the residuals at 450 nm to show the quality of the fitting. (B) Spectral deconvolution into the different species observed along the reaction from fittings to a two-step model and calculated rate constants. Spectral evolution (A) and deconvolution (B) are from a single measurement and representative from n > 3.
Figure 6
Figure 6
Kinetics of NQO1 flavin reduction by NADH in the presence of the Dic inhibitor. (A) Spectral evolution after the mixing in the stopped-flow equipment of NQO1ox (7.5 μM) with NADH (7.5 µM) in the presence of Dic (7.5 µM) in 20 mM HEPES-KOH, pH 7.4, at 6 °C on a 0–800 s timescale. Different colored lines correspond to the spectra at different reaction times. The inset shows the decay of kinetic traces at 450 nm and 475 nm, as well as the fitting to a three-state model. (B) Spectral deconvolution of intermediate species observed during the reaction upon fitting to a two-step model and calculated observed rate constants. In panels A and B, the dashed line represents the protein spectrum before mixing. Spectral evolution (A) and deconvolution (B) are from a single measurement and representative from n > 3.
Figure 7
Figure 7
Kinetics of the reaction of NQO1hq with NAD+. (A) Spectral evolution after mixing (in an anaerobic cuvette) NQO1hq (7.5 μM)) with a 1:1 ratio of NAD+ in 20 mM HEPES-KOH, pH 7.0, at 6 °C on a 0–35 min timescale. Different colored lines correspond to the spectra at different reaction times. (B) Detail of kinetic traces at 450 nm and 475 nm and fitting to a single exponential function. Spectral evolution (A) is from a single measurement and representative from n > 3.
Figure 8
Figure 8
Kinetics of NQO1hq re-oxidation by DCPIP (2,6-dichlorophenol indophenol). (A) Spectral evolution after mixing NQO1hq (7.5 μM) with DCPIP (7.5 µM) in 20 mM HEPES-KOH, pH 7.4, at 6 °C on a 0–0.1 s timescale. (B) Spectral deconvolution of intermediate species observed during the reaction when using a three-state model. (C) Kinetic traces at 450 nm, 475 nm and 600 nm. Experimental data as well as the fitting to the three-state mechanism are shown. (D) Spectral evolution after mixing NQO1hq (7.5 μM) with DCPIP (7.5 µM) in the presence of Dic (7.5 µM) in 20 mM HEPES-KOH, pH 7.4, at 6 °C on a 0–1 s timescale. (E) Spectral deconvolution of intermediate species obtained from analysis using a three-state model. (F) Kinetic traces at 450 nm, 475 nm and 600 nm. Experimental data as well as the fitting to the three-state mechanisms are shown. Dashed lines (panels A,B and D,E) correspond to the initial spectra of NQO1hq and DCPIP (bold), the bold black line is the addition of these two spectra (species at t = 0) and the different colored lines correspond to the spectra at different reaction times. Spectral evolution (A,D) and deconvolution (B,E) are from a single measurement and representative from n > 3.
Figure 9
Figure 9
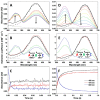
Temperature dependence of kinetic parameters for the two hydride/deuteride transfer (HT/DT) processes from NADH to NQO1. (A) Arrhenius plots of kinetic constants. (B) Temperature dependence of the kinetic isotope effects (KIEs). (C) Eyring plots of kinetic constants.

References

    1. Ross D., Siegel D. NQO1 in protection against oxidative stress. Curr. Opin. Toxicol. 2018;7:67–72. doi: 10.1016/j.cotox.2017.10.005. - DOI
    1. Beaver S.K., Mesa-Torres N., Pey A.L., Timson D.J. NQO1: A target for the treatment of cancer and neurological diseases, and a model to understand loss of function disease mechanisms. Biochim. Biophys. Acta Proteins Proteom. 2019;1867:663–676. doi: 10.1016/j.bbapap.2019.05.002. - DOI - PubMed
    1. Anusevicius Z., Sarlauskas J., Cenas N. Two-electron reduction of quinones by rat liver NAD(P)H: Quinone oxidoreductase: Quantitative structure-activity relationships. Arch. Biochem. Biophys. 2002;404:254–262. doi: 10.1016/S0003-9861(02)00273-4. - DOI - PubMed
    1. Salido E., Timson D.J., Betancor-Fernández I., Palomino-Morales R., Pey A.L. Targeting HIF-1alpha Function in Cancer through the Chaperone Action of NQO1. Preprints. 2020;2020:030285. - PMC - PubMed
    1. Ingram B.O., Turbyfill J.L., Bledsoe P.J., Jaiswal A.K., Stafford D.W. Assessment of the contribution of NAD(P)H-dependent quinone oxidoreductase 1 (NQO1) to the reduction of vitamin K in wild-type and NQO1-deficient mice. Biochem. J. 2013;456:47–54. doi: 10.1042/BJ20130639. - DOI - PubMed

LinkOut - more resources