. 2020 Aug 20;12(9):2359.
doi: 10.3390/cancers12092359.

Distinct Mutation Patterns Reveal Melanoma Subtypes and Influence Immunotherapy Response in Advanced Melanoma Patients

Affiliations

Distinct Mutation Patterns Reveal Melanoma Subtypes and Influence Immunotherapy Response in Advanced Melanoma Patients

Franz J Hilke et al. Cancers (Basel). .

Abstract

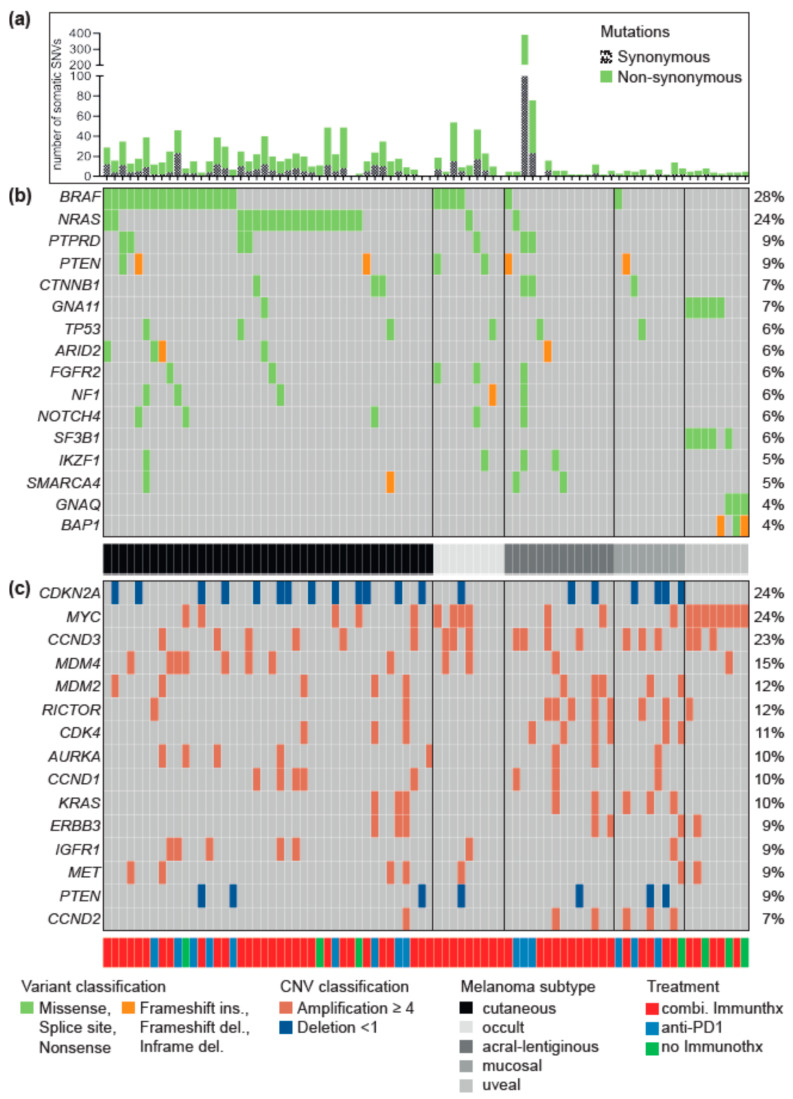
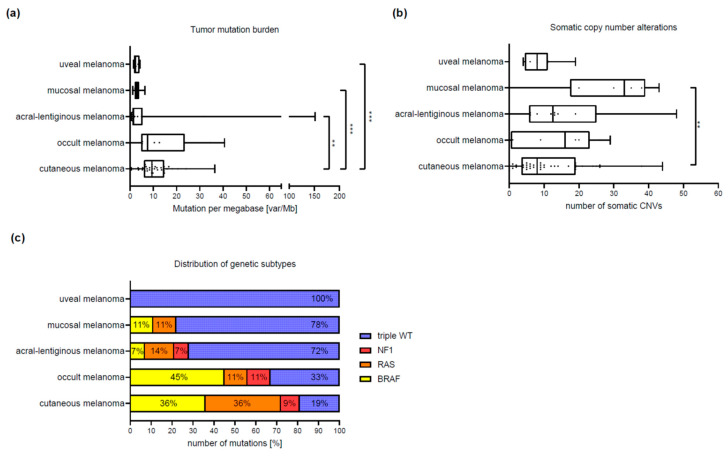
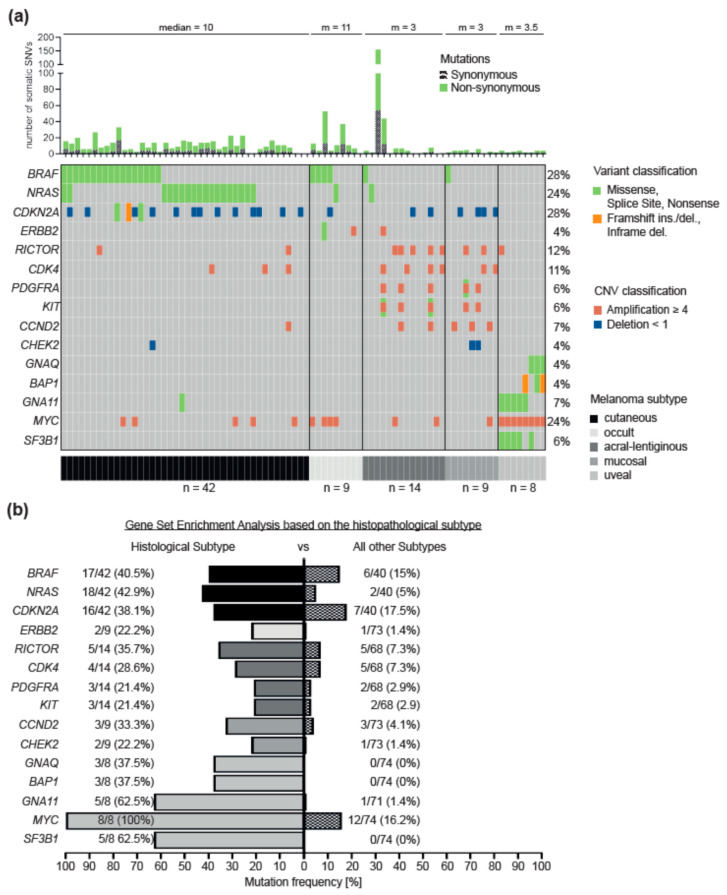
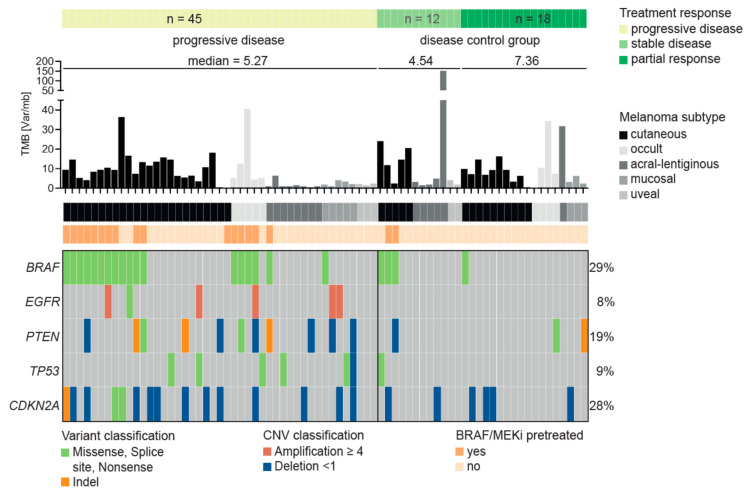
The detection of somatic driver mutations by next-generation sequencing (NGS) is becoming increasingly important in the care of advanced melanoma patients. In our study, we evaluated the NGS results of 82 melanoma patients from clinical routine in 2017. Besides determining the tumor mutational burden (TMB) and annotation of all genetic driver alterations, we investigated their potential as a predictor for resistance to immune checkpoint inhibitors (ICI) and as a distinguishing feature between melanoma subtypes. Melanomas of unknown primary had a similar mutation pattern and TMB to cutaneous melanoma, which hints at its cutaneous origin. Besides the typical hotspot mutation in BRAF and NRAS, we frequently observed CDKN2A deletions. Acral and mucosal melanomas were dominated by CNV alterations affecting PDGFRA, KIT, CDK4, RICTOR, CCND2 and CHEK2. Uveal melanoma often had somatic SNVs in GNA11/Q and amplification of MYC in all cases. A significantly higher incidence of BRAF V600 mutations and EGFR amplifications, PTEN and TP53 deletions was found in patients with disease progression while on ICI. Thus, NGS might help to characterize melanoma subtypes more precisely and to identify possible resistance mechanisms to ICI therapy. Nevertheless, NGS based studies, including larger cohorts, are needed to support potential genetic ICI resistance mechanisms.

Keywords: Genome of advanced melanoma; TMB; acral; immune checkpoint inhibitors; melanoma of unknown origin; mucosal; next-generation sequencing; tumor mutation burden; uveal.


Conflict of interest statement

A.F. served as consultant to Roche, Novartis, MSD, Pierre-Fabre; received travel support from Roche, Novartis, BMS, Pierre-Fabre, received speaker fees from Roche, Novartis, BMS, MSD and CeGaT, received research funding from BMS outside the submitted work. T.A. reports personal fees and travel grants from BMS, grants, personal fees and travel grants from Novartis, personal fees from Pierre Fabre and CeCaVa, grants from Neracare, grants from Sanofi, outside the submitted work. I.B. received speaker fees from Novartis and AstraZeneca and honoraria for advisory board participation from BMS and Novartis. CG reports grants and personal fees from Novartis, BMS, Roche, personal fees from MSD. Personal fees from Amgen, Philogen, LEO, Incyte, outside the submitted work. F.J.H., O.R. and C.S. received an institutional grant from Novartis. C.S. received research funding from BMS outside the submitted work. T.S. received grants from Novartis and Pierre-Fabre and personal fees from Neracare. The other authors declared no competing interests.

Figures

Figure 1
Figure 1
Oncoplot of the most frequently mutated genes with driver mutations. Figure 1 shows a summary of the most frequent driver mutations of the melanoma cohort based on the 275 genes contained in all 3 panel versions. The Oncoplot shows the patients in a horizontal orientation and the gene and the corresponding driver mutations per patient in the vertical orientation. The plot is divided into three parts, in the upper area (a) all somatic single nucleotide variants (SNVs) and small insertions and deletions (INDELs) per patient, including the synonymous variants, are shown. The middle panel (b) summarizes all somatic SNVs found with a frequency of at least five percent, plus the two genes GNAQ and BAP1. The lower panel (c) summarizes the 15 most mutated genes with somatic copy number changes (CNVs). For both panel (b) and (c), only mutations that were annotated as drivers or druggable biomarkers by the Cancer Genome Interpreter (CGI) are shown. Colors indicate different mutation types (s. legend for details). The entire cohort is sorted by the histopathological subtype in a grayscale (cutaneous, acral-lentiginous, mucosal, uveal, melanoma of unknown primary = occult). In addition, the type of therapy is annotated (red: combined immunotherapy, n = 60; blue: anti-PD-1, n = 15; green: no immunotherapy, n = 7).
Figure 2
Figure 2
Tumor mutation burden, copy number variants and genetic subtypes. Figure 2 shows the comparison of tumor mutation burden (TMB), number of somatic copy number changes (CNVs) and the frequency of the genetic subtypes BRAF, NRAS, NF1 and Triple wild-type (triple-WT) between the four histopathological subtypes (cutaneous, acral-lentiginous, mucosal, uveal) and the melanoma of unknown primary (occult). The figure consists of 3 histograms (ac), whereby the y-axis always represents the histopathological subtypes. On the x-axis the TMB is indicated in (a), as mutations per megabase (Mut/Mb), in (b) the number of somatic CNVs, in absolute numbers related to the 275 genes analyzed and in (c) the genetic subtype in absolute numbers. Patients with cutaneous melanoma have the most somatic SNVs and thus the highest median TMB compared to the remaining three subtypes (p ≤ 0.003). The median TMB of occult and cutaneous melanoma is only slightly different with 7.5 var/Mb versus 9.4 var/Mb, respectively. The mucosal melanoma clearly has the most somatic CNVs with a median of 33 and there is a significant difference between the mucosal and cutaneous melanoma (p = 0.025) and the uveal and occult melanoma (p = 0.025). Cutaneous melanoma shows an even distribution of BRAF and RAS mutated patients (40% each) and patients with melanoma of unknown primary are also in 45% BRAF mutated. The other three subtypes show a clear overweight of tumors with the status triple-WT.
Figure 3
Figure 3
Gene set enrichment analysis of histopathological subtypes. Figure 3 summarizes the genetic differences, based on the gene set enrichment analysis (subtype versus rest of the cohort), of the four histopathological subtypes and the melanoma of unknown primary (occult). The figure consists of a histogram (a) showing the number of somatic changes (SNVs), including synonymous variants and the median (m) of each subtype. Below is an Oncoplot. It is sorted by histopathological subtypes cutaneous, acral-lentiginous, mucosal, occult and uveal melanoma (gray scale). It summarizes the genes that are significant (p < 0.05) for each subtype. In vertical alignment, the patients are summarized and in horizontal alignment the genes and the corresponding changes. On the left side the frequency, as a histogram in percent, of the somatic mutations (drivers) per gene, related to the total cohort, is shown. The panel (b) shows the frequency (in percent) of mutations per gene related to the subtypes (gray scale) compared to the rest of the cohort. For cutaneous melanoma, the genes BRAF (p = 0.009), NRAS (p = 0.0004) and CDKN2A (p = 0.03) are significantly enriched mutated compared to the rest of the cohort. For the acral-lentiginous melanoma the genes RICTOR (p = 0.01), CDK4 (p = 0.04), PDGFRA (p = 0.03) and KIT (p = 0.03) are enriched mutated, for the mucosal melanoma the genes CCND2 (p = 0.01) and CHEK2 (p = 0.03) are enriched mutated, for the melanoma of unknown primary the gene ERBB2 (p = 0.03) is enriched mutated and for the uveal melanoma the genes GNAQ (p = 0.0006), GNA11 (p = 0.00001), BAP1 (p = 0.0006), MYC (p = 0.000003) and SF3B1 (p = 0.0000002) are enriched mutated.
Figure 4
Figure 4
Predictor for resistance to immune checkpoint therapy. Figure 4 shows the result of the Fisher’s test identifying a genetic predictor for the resistance to immune checkpoint inhibitor therapy based on the RECIST response classification (progressive disease versus disease control [stable disease, partial response]). Mutations in three genes—EGFR, PTEN and TP53 - were identified as individual predictors for a progressive disease at the first staging. In 89% of cases (16 out of 18), patients with BRAF mutations had previously received BRAF/MEK inhibition before receiving immunotherapy. Together the mutations and the failed BRAF/MEKi pre-therapy predict 82% of the patients as PD (p = 0.007).

References

    1. Cancer Genome Atlas Network Genomic Classification of Cutaneous Melanoma. Cell. 2015;161:1681–1696. doi: 10.1016/j.cell.2015.05.044. - DOI - PMC - PubMed
    1. Krauthammer M., Kong Y., Bacchiocchi A., Evans P., Pornputtapong N., Wu C., McCusker J.P., Ma S., Cheng E., Straub R., et al. Exome sequencing identifies recurrent mutations in NF1 and RASopathy genes in sun-exposed melanomas. Nat. Genet. 2015;47:996–1002. doi: 10.1038/ng.3361. - DOI - PMC - PubMed
    1. Hodis E., Watson I.R., Kryukov G.V., Arold S.T., Imielinski M., Theurillat J.P., Nickerson E., Auclair D., Li L., Place C., et al. A landscape of driver mutations in melanoma. Cell. 2012;150:251–263. doi: 10.1016/j.cell.2012.06.024. - DOI - PMC - PubMed
    1. Hayward N.K., Wilmott J.S., Waddell N., Johansson P.A., Field M.A., Nones K., Patch A.M., Kakavand H., Alexandrov L.B., Burke H., et al. Whole-genome landscapes of major melanoma subtypes. Nature. 2017;545:175–180. doi: 10.1038/nature22071. - DOI - PubMed
    1. Liang W.S., Hendricks W., Kiefer J., Schmidt J., Sekar S., Carpten J., Craig D.W., Adkins J., Cuyugan L., Manojlovic Z., et al. Integrated genomic analyses reveal frequent TERT aberrations in acral melanoma. Genome Res. 2017;27:524–532. doi: 10.1101/gr.213348.116. - DOI - PMC - PubMed