

Computer-Aided Diagnosis in Multiparametric MRI of the Prostate: An Open-Access Online Tool for Lesion Classification with High Accuracy
- PMID: 32825612
- PMCID: PMC7565879
- DOI: 10.3390/cancers12092366
Computer-Aided Diagnosis in Multiparametric MRI of the Prostate: An Open-Access Online Tool for Lesion Classification with High Accuracy
Abstract
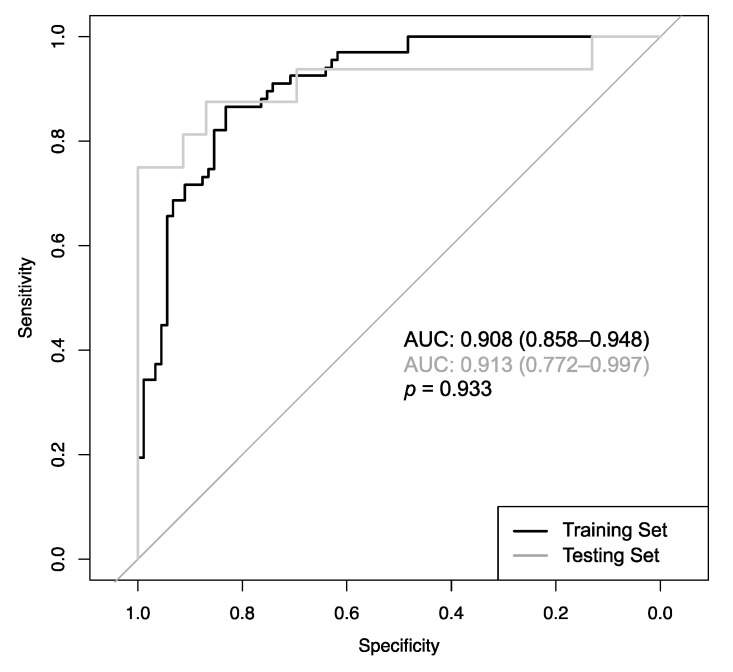
Computer-aided diagnosis (CADx) approaches could help to objectify reporting on prostate mpMRI, but their use in many cases is hampered due to common-built algorithms that are not publicly available. The aim of this study was to develop an open-access CADx algorithm with high accuracy for classification of suspicious lesions in mpMRI of the prostate. This retrospective study was approved by the local ethics commission, with waiver of informed consent. A total of 124 patients with 195 reported lesions were included. All patients received mpMRI of the prostate between 2014 and 2017, and transrectal ultrasound (TRUS)-guided and targeted biopsy within a time period of 30 days. Histopathology of the biopsy cores served as a standard of reference. Acquired imaging parameters included the size of the lesion, signal intensity (T2w images), diffusion restriction, prostate volume, and several dynamic parameters along with the clinical parameters patient age and serum PSA level. Inter-reader agreement of the imaging parameters was assessed by calculating intraclass correlation coefficients. The dataset was stratified into a train set and test set (156 and 39 lesions in 100 and 24 patients, respectively). Using the above parameters, a CADx based on an Extreme Gradient Boosting algorithm was developed on the train set, and tested on the test set. Performance optimization was focused on maximizing the area under the Receiver Operating Characteristic curve (ROCAUC). The algorithm was made publicly available on the internet. The CADx reached an ROCAUC of 0.908 during training, and 0.913 during testing (p = 0.93). Additionally, established rule-in and rule-out criteria allowed classifying 35.8% of the malignant and 49.4% of the benign lesions with error rates of <2%. All imaging parameters featured excellent inter-reader agreement. This study presents an open-access CADx for classification of suspicious lesions in mpMRI of the prostate with high accuracy. Applying the provided rule-in and rule-out criteria might facilitate to further stratify the management of patients at risk.
Keywords: artificial intelligence; computer-aided diagnosis; machine learning; prostate cancer; prostate mpMRI.
Conflict of interest statement
The authors declare no conflict of interest. The funders had no role in the design of the study; in the collection, analyses, or interpretation of data; in the writing of the manuscript, or in the decision to publish the results.
Figures


Similar articles
-
Multiparametric MRI in detection and staging of prostate cancer.Dan Med J. 2017 Feb;64(2):B5327. Dan Med J. 2017. PMID: 28157066 Review.
-
Multiparametric Magnetic Resonance Imaging (MRI) and MRI-Transrectal Ultrasound Fusion Biopsy for Index Tumor Detection: Correlation with Radical Prostatectomy Specimen.Eur Urol. 2016 Nov;70(5):846-853. doi: 10.1016/j.eururo.2015.12.052. Epub 2016 Jan 19. Eur Urol. 2016. PMID: 26810346
-
Prostate cancer detection on transrectal ultrasonography-guided random biopsy despite negative real-time magnetic resonance imaging/ultrasonography fusion-guided targeted biopsy: reasons for targeted biopsy failure.BJU Int. 2016 Jul;118(1):35-43. doi: 10.1111/bju.13327. Epub 2015 Oct 20. BJU Int. 2016. PMID: 26384851
-
Association Between Prostate Imaging Reporting and Data System (PI-RADS) Score for the Index Lesion and Multifocal, Clinically Significant Prostate Cancer.Eur Urol Oncol. 2018 May;1(1):29-36. doi: 10.1016/j.euo.2018.01.002. Epub 2018 May 15. Eur Urol Oncol. 2018. PMID: 31100225
-
Applications of Artificial Intelligence to Prostate Multiparametric MRI (mpMRI): Current and Emerging Trends.Cancers (Basel). 2020 May 11;12(5):1204. doi: 10.3390/cancers12051204. Cancers (Basel). 2020. PMID: 32403240 Free PMC article. Review.
Cited by
-
Machine learning-based MRI imaging for prostate cancer diagnosis: systematic review and meta-analysis.Prostate Cancer Prostatic Dis. 2025 Jul 28. doi: 10.1038/s41391-025-00997-2. Online ahead of print. Prostate Cancer Prostatic Dis. 2025. PMID: 40721879
-
Diffusion kurtosis imaging and standard diffusion imaging in the magnetic resonance imaging assessment of prostate cancer.Gland Surg. 2023 Dec 26;12(12):1806-1822. doi: 10.21037/gs-23-53. Epub 2023 Dec 22. Gland Surg. 2023. PMID: 38229839 Free PMC article. Review.
-
Artificial Intelligence Based Algorithms for Prostate Cancer Classification and Detection on Magnetic Resonance Imaging: A Narrative Review.Diagnostics (Basel). 2021 May 26;11(6):959. doi: 10.3390/diagnostics11060959. Diagnostics (Basel). 2021. PMID: 34073627 Free PMC article. Review.
References
-
- Hoeks C.M.A., Barentsz J.O., Hambrock T., Yakar D., Somford D.M., Heijmink S.W.T.P.J., Scheenen T.W.J., Vos P.C., Huisman H., van Oort I.M., et al. Prostate cancer: Multiparametric MR imaging for detection, localization, and staging. Radiology. 2011;261:46–66. doi: 10.1148/radiol.11091822. - DOI - PubMed
-
- EAU Guidelines: Prostate Cancer | Uroweb. [(accessed on 28 July 2020)]; Available online: https://uroweb.org/guideline/prostate-cancer/
Grants and funding
LinkOut - more resources
Full Text Sources
Research Materials
Miscellaneous
