. 2020 Aug 21;20(17):4732.
doi: 10.3390/s20174732.

Acoustic Description of the Soundscape of a Real-Life Intensive Farm and Its Impact on Animal Welfare: A Preliminary Analysis of Farm Sounds and Bird Vocalisations

Affiliations

Acoustic Description of the Soundscape of a Real-Life Intensive Farm and Its Impact on Animal Welfare: A Preliminary Analysis of Farm Sounds and Bird Vocalisations

Gerardo José Ginovart-Panisello et al. Sensors (Basel). .

Abstract

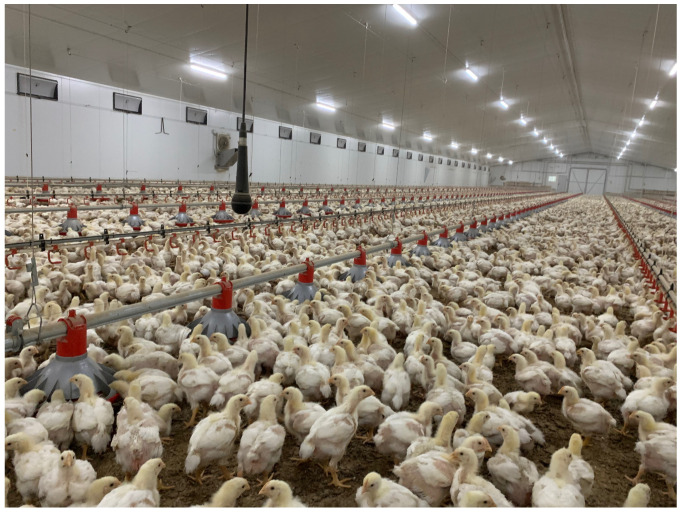
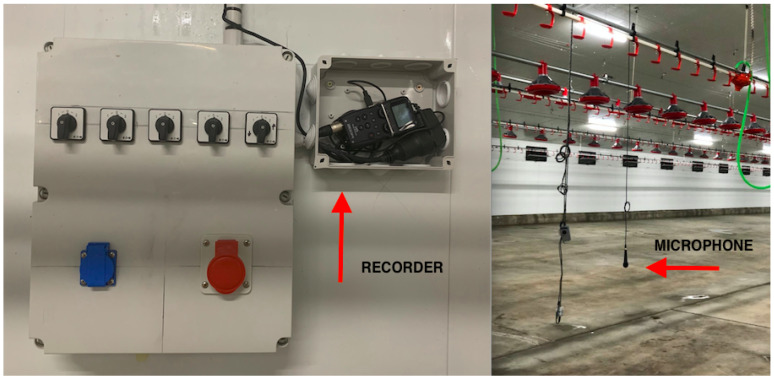
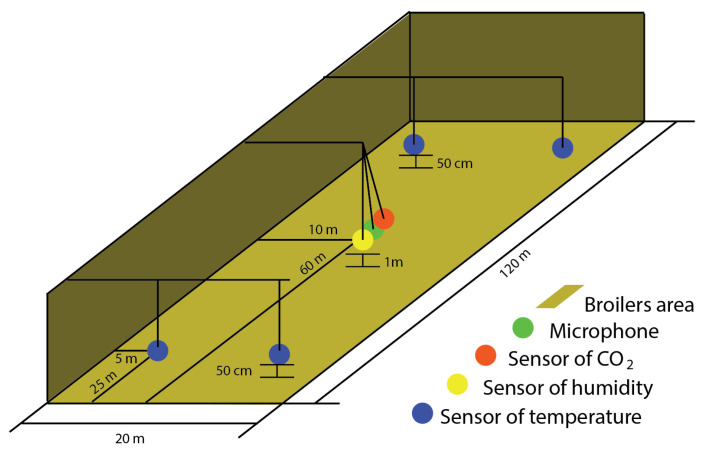
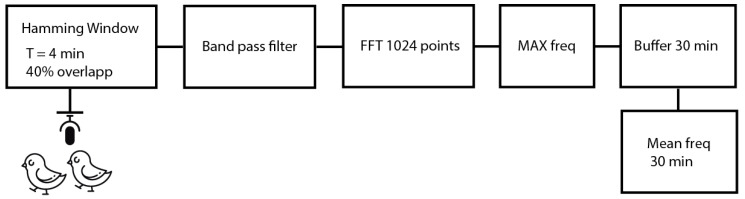
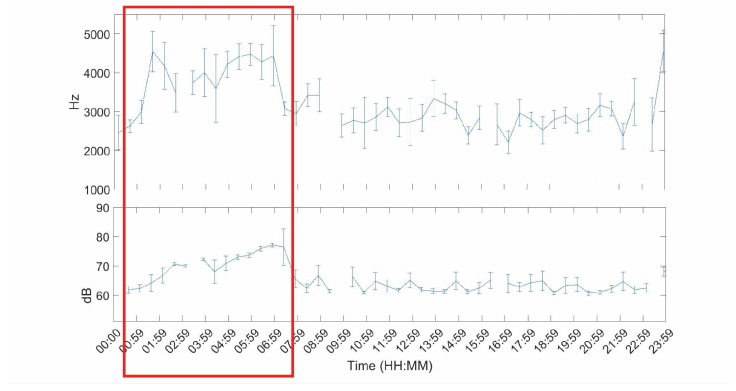
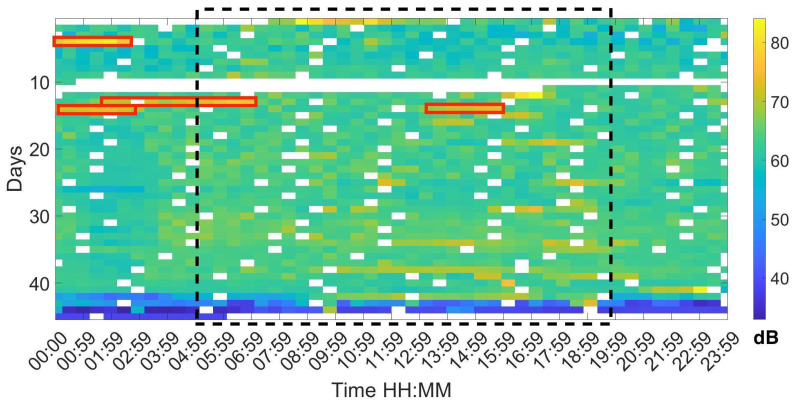
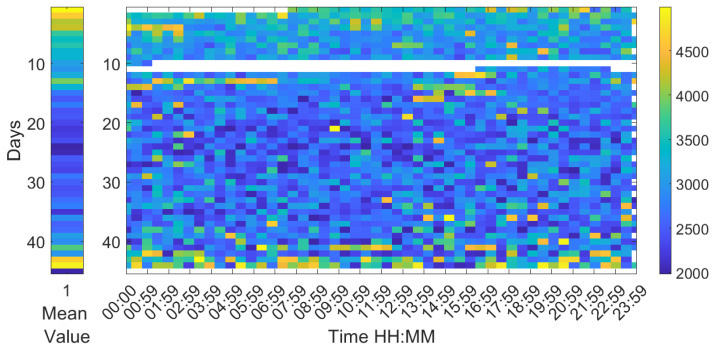
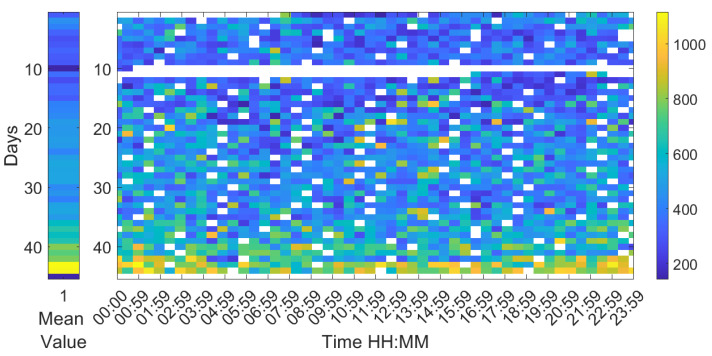
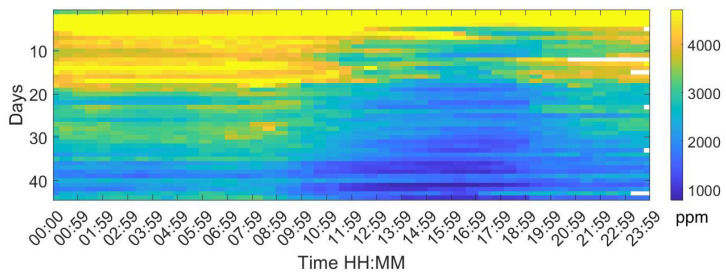
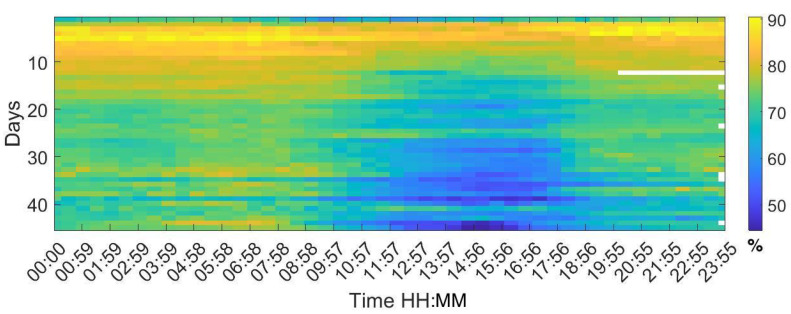
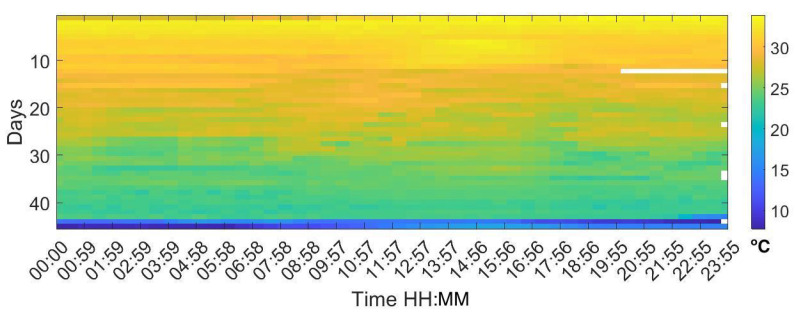
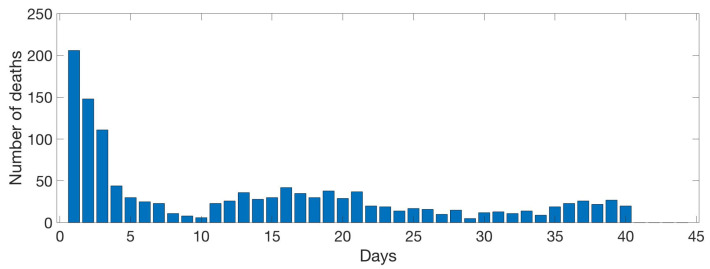
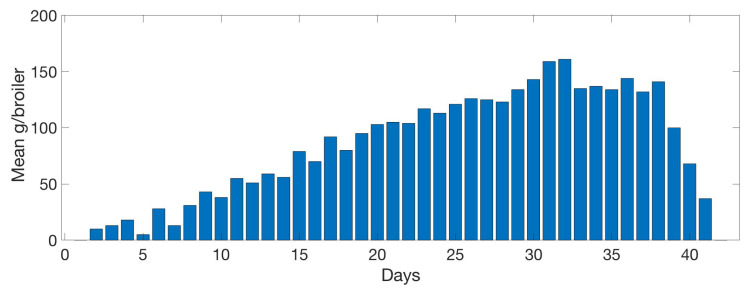
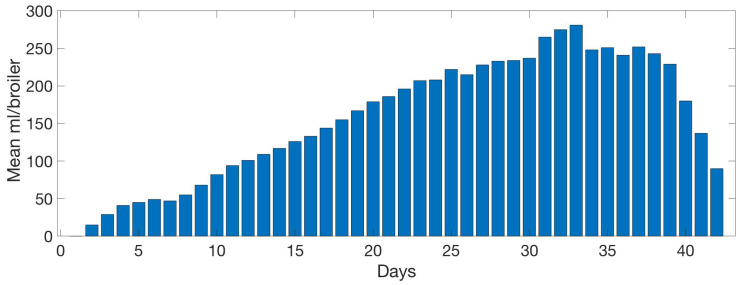
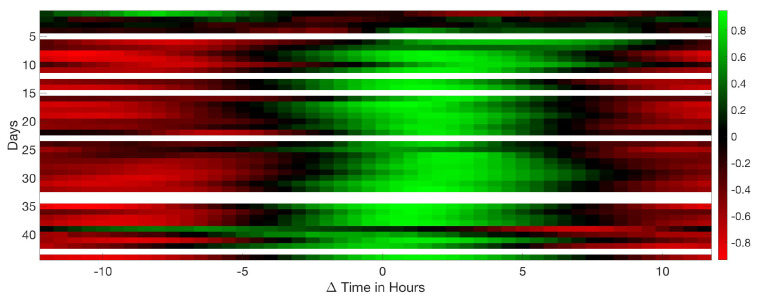
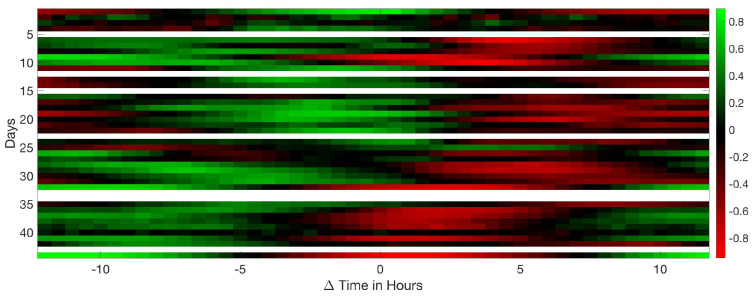
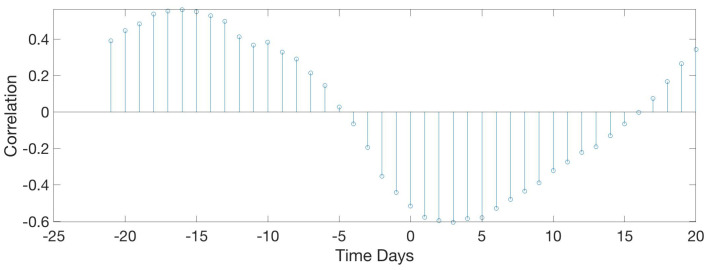
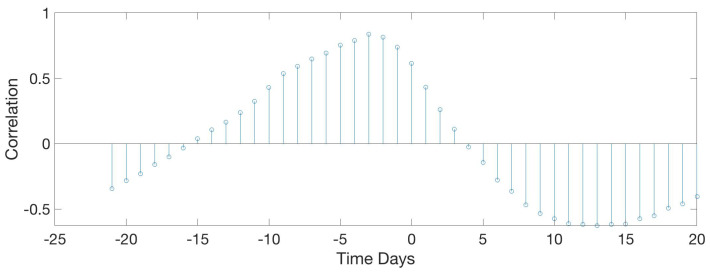
Poultry meat is the world's primary source of animal protein due to low cost and is widely eaten at a global level. However, intensive production is required to supply the demand although it generates stress to animals and welfare problems, which have to be reduced or eradicated for the better health of birds. In this study, bird welfare is measured by certain indicators: CO2, temperature, humidity, weight, deaths, food, and water intake. Additionally, we approach an acoustic analysis of bird vocalisations as a possible metric to add to the aforementioned parameters. For this purpose, an acoustic recording and analysis of an entire production cycle of an intensive broiler Ross 308 poultry farm in the Mediterranean area was performed. The acoustic dataset generated was processed to obtain the Equivalent Level (Leq), the mean Peak Frequency (PF), and the PF variation, every 30 min. This acoustical analysis aims to evaluate the relation between traditional indicators (death, weight, and CO2) as well as acoustical metrics (equivalent level impact (Leq) and Peak Frequency) of a complete intensive production cycle. As a result, relation between CO2 and humidity versus Leq was found, as well as decreases in vocalisation when the intake of food and water was large.

Keywords: Leq; bird well-fare; farm management noise; food and water intake; poultry farm; stress; vocalisation frequency; weight.


Conflict of interest statement

The authors declare no conflicts of interest.

Figures

Figure 1
Figure 1
Picture of day 21 in H1 house. The birds live with the microphone installation. It is recording continuous raw acoustic data.
Figure 2
Figure 2
Acoustic equipment deployment in the farm H1. On the left, the recorder location. On the right, the microphone hanging from the ceiling in order to avoid physical interaction with the birds.
Figure 3
Figure 3
Diagram of the sensors location in the H1 farm, microphone, CO2 sensor, humidity, and temperature sensor.
Figure 4
Figure 4
Peak frequency detection algorithm implementation.
Figure 5
Figure 5
Temporal Leq sample in which the increase due to machinery is clearly identificable. In the horizontal axis we find the time and in the vertical axis the frequency (top) and the Leq (bottom).
Figure 6
Figure 6
Map of the Leq at 30 min intervals during the 44 days of a complete production cycle. The red rectangles correspond to the areas where there is a high Leq measurement due to machinery.
Figure 7
Figure 7
Map of the maximum frequency at 30 min intervals during the 44 days of a complete production cycle. The horizontal axis shows the hours of the day and night, and the vertical axis shows the days of the cycle.
Figure 8
Figure 8
Map of the variance in frequency at 30 min intervals during the 44 days of a complete production cycle. The horizontal axis shows the hours of the day and night, and the vertical axis shows the days of the cycle.
Figure 9
Figure 9
Map of the mean CO2 values for each day of the campaign. The horizontal axis shows the hours of the day and night, displaying a value every 30 min, and the vertical axis shows the days of the cycle.
Figure 10
Figure 10
Map of the humidity values for each day of the campaign. The horizontal axis shows the hours of the day and night, displaying a value every 30 min, and the vertical axis shows the days of the cycle.
Figure 11
Figure 11
Map of the temperature values for each day of the campaign. The horizontal axis shows the hours of the day and night, displaying a value every 30 min, and the vertical axis shows the days of the cycle.
Figure 12
Figure 12
Evolution of the animal death count per day. Data evaluated daily by the farm management.
Figure 13
Figure 13
Evolution of the mean food intake per day by the birds. Data collected daily by the farm management.
Figure 14
Figure 14
Evolution of the mean water intake per day by the birds. Data collected daily by the farm management.
Figure 15
Figure 15
Results of the circular correlation CO2—humidity. Horizontal axis corresponds to the ΔTime measured in hours, evaluating the delay between CO2 and humidity. Vertical axis stands for the days of the cycle.
Figure 16
Figure 16
Results of the circular correlation CO2—temperature. Horizontal axis corresponds to the ΔTime measured in hours, evaluating the delay between CO2 and temperature. Vertical axis stands for the days of the cycle.
Figure 17
Figure 17
Results of the circular correlation CO2Leq. Horizontal axis corresponds to the ΔTime measured in hours, evaluating the delay between CO2 and Leq. Vertical axis stands for the days of the cycle.
Figure 18
Figure 18
Results of the circular correlation humidity—Leq. Horizontal axis corresponds to the ΔTime measured in hours, evaluating the delay between humidity and Leq. Vertical axis stands for the days of the cycle.
Figure 19
Figure 19
Results of the circular correlation temperature—humidity. Horizontal axis corresponds to the ΔTime measured in hours, evaluating the delay between temperature and humidity. Vertical axis stands for the days of the cycle.
Figure 20
Figure 20
Results of the circular correlation food—max freq. Horizontal axis corresponds to the time (in days), evaluating the delay between the food intake and the maximum frequency detected.
Figure 21
Figure 21
Results of the circular correlation water—max freq. Horizontal axis corresponds to the time (in days), evaluating the delay between the water intake and the maximum frequency detected.
Figure 22
Figure 22
Results of the circular correlation food—weight. Horizontal axis corresponds to the time (in days), evaluating the delay between the food intake and the mean weight of the birds.

References

    1. Meluzzi A., Sirri F. Welfare of broiler chickens. Ital. J. Anim. Sci. 2009;8:161–173. doi: 10.4081/ijas.2009.s1.161. - DOI
    1. Panisello M. Jornadas Profesionales de Avicultura de Carne. Volume 2. Real Escuela de Avicultura; Valladolid, Spain: 2005. La patología y el medio ambiente en las granjas de broilers; pp. 1–15.
    1. Mead G. Poultry Meat Processing and Quality. Elsevier; Amsterdam, The Netherlands: 2004.
    1. Petracci M., Mudalal S., Soglia F., Cavani C. Meat quality in fast-growing broiler chickens. World’s Poult. Sci. J. 2015;71:363–374. doi: 10.1017/S0043933915000367. - DOI
    1. Gardiner E., Hunt J., Newberry R., Hall J. Relationships between age, body weight, and season of the year and the incidence of sudden death syndrome in male broiler chickens. Poult. Sci. 1988;67:1243–1249. doi: 10.3382/ps.0671243. - DOI - PubMed