. 2020 Dec;10(12):1894-1911.
doi: 10.1158/2159-8290.CD-19-0970. Epub 2020 Aug 21.

The Folate Cycle Enzyme MTHFR Is a Critical Regulator of Cell Response to MYC-Targeting Therapies

Affiliations

The Folate Cycle Enzyme MTHFR Is a Critical Regulator of Cell Response to MYC-Targeting Therapies

Angela Su et al. Cancer Discov. 2020 Dec.

Abstract

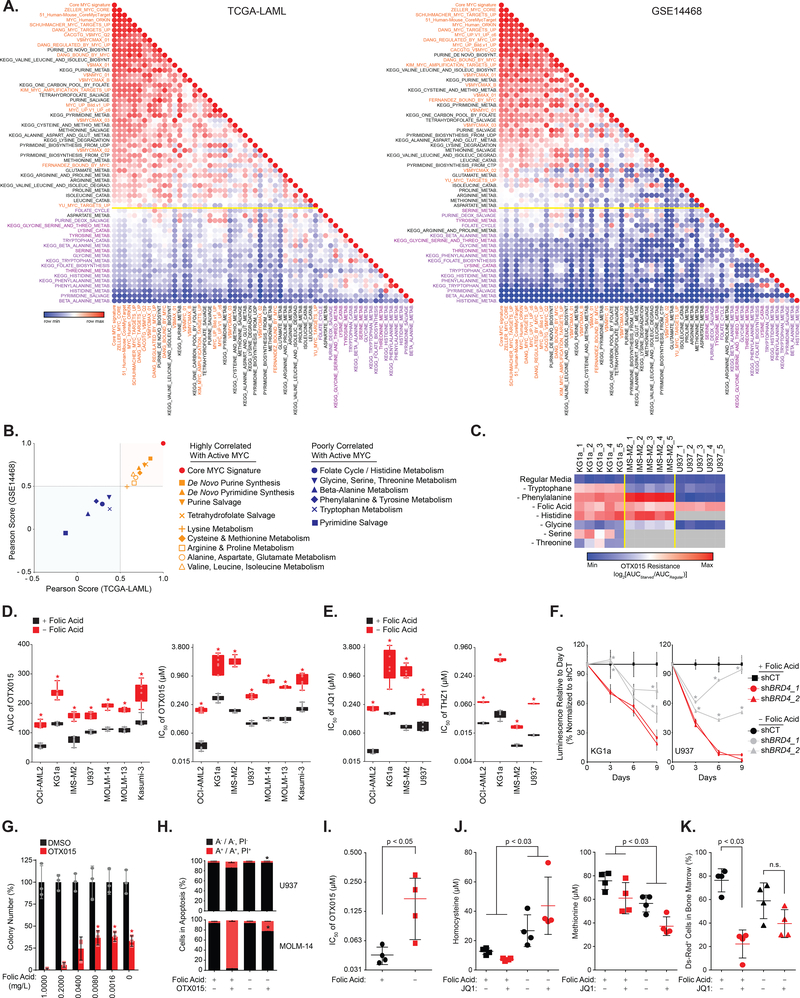
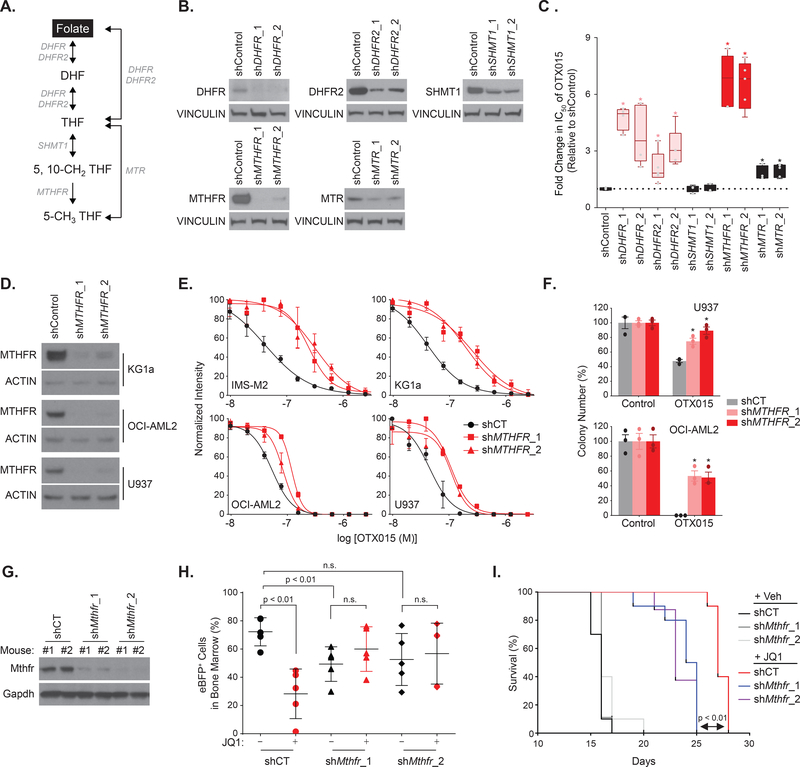
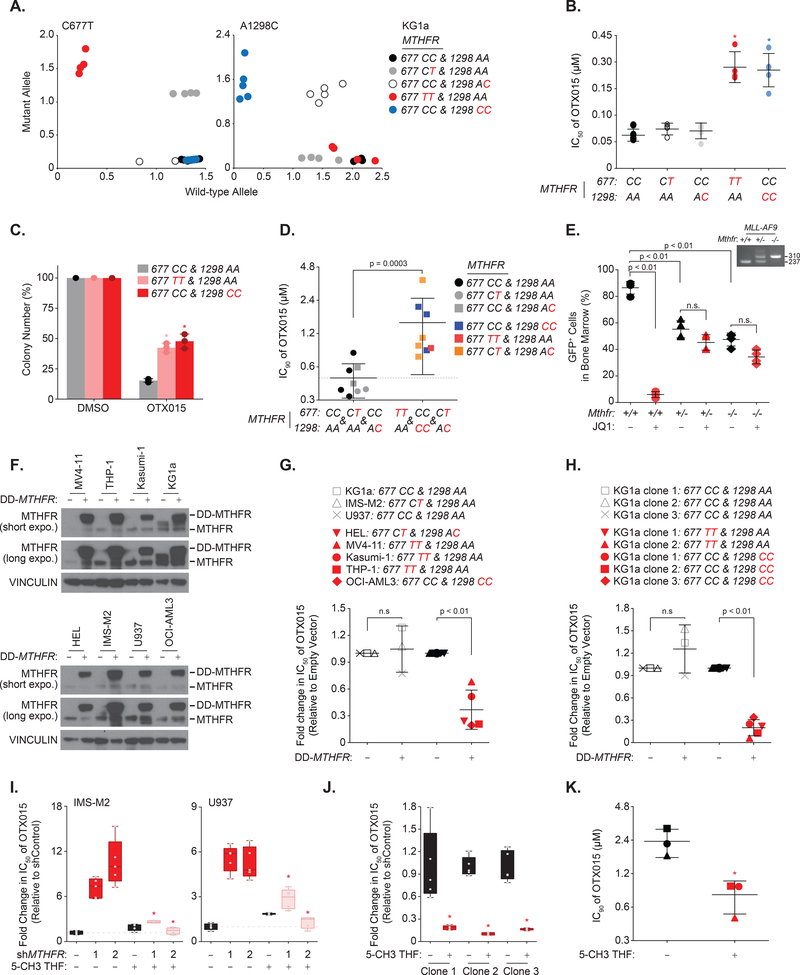
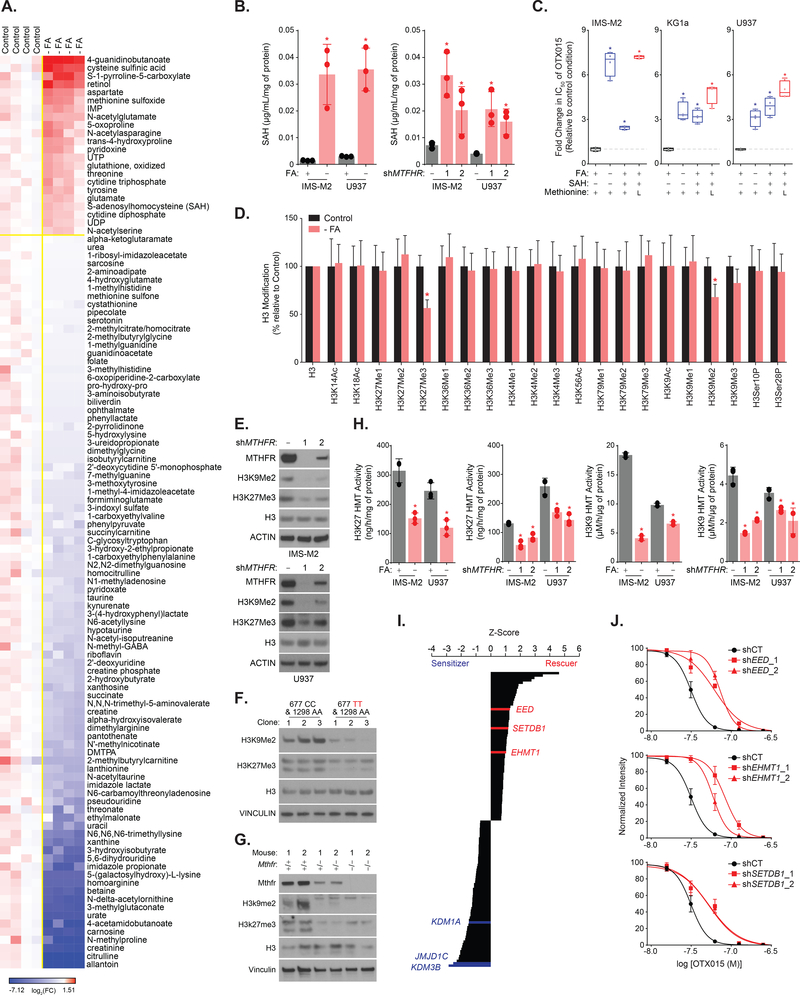
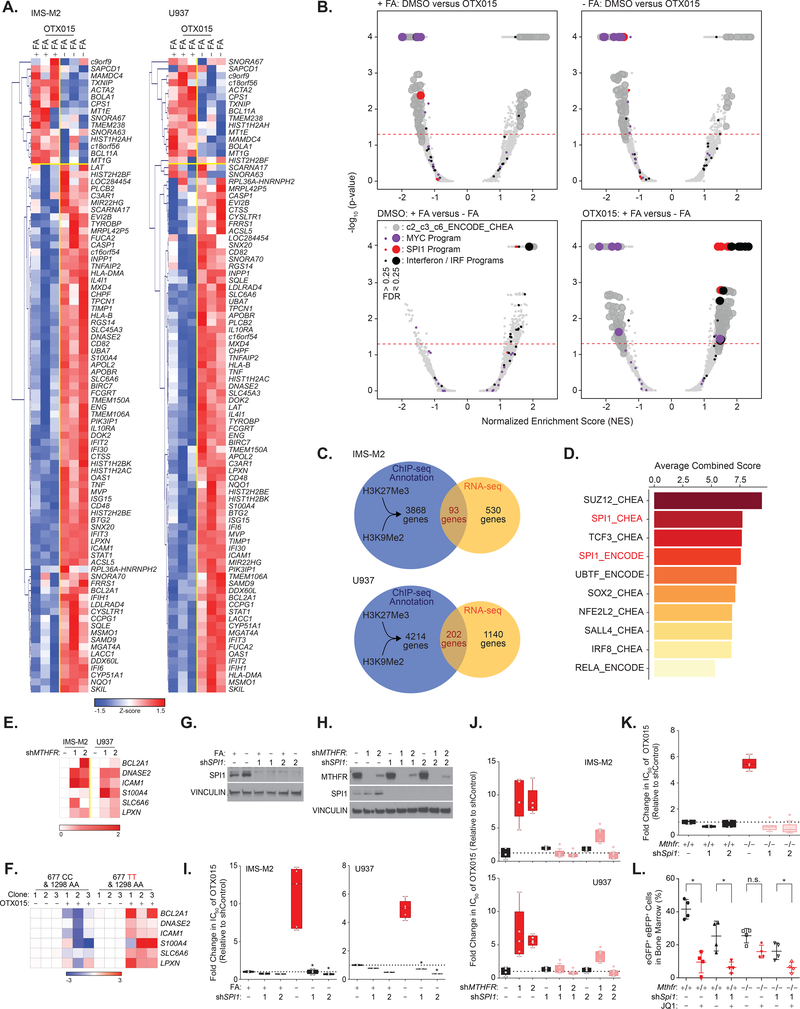
Deciphering the impact of metabolic intervention on response to anticancer therapy may elucidate a path toward improved clinical responses. Here, we identify amino acid-related pathways connected to the folate cycle whose activation predicts sensitivity to MYC-targeting therapies in acute myeloid leukemia (AML). We establish that folate restriction and deficiency of the rate-limiting folate cycle enzyme MTHFR, which exhibits reduced-function polymorphisms in about 10% of Caucasians, induce resistance to MYC targeting by BET and CDK7 inhibitors in cell lines, primary patient samples, and syngeneic mouse models of AML. Furthermore, this effect is abrogated by supplementation with the MTHFR enzymatic product CH3-THF. Mechanistically, folate cycle disturbance reduces H3K27/K9 histone methylation and activates a SPI1 transcriptional program counteracting the effect of BET inhibition. Our data provide a rationale for screening MTHFR polymorphisms and folate cycle status to nominate patients most likely to benefit from MYC-targeting therapies. SIGNIFICANCE: Although MYC-targeting therapies represent a promising strategy for cancer treatment, evidence of predictors of sensitivity to these agents is limited. We pinpoint that folate cycle disturbance and frequent polymorphisms associated with reduced MTHFR activity promote resistance to BET inhibitors. CH3-THF supplementation thus represents a low-risk intervention to enhance their effects.See related commentary by Marando and Huntly, p. 1791.This article is highlighted in the In This Issue feature, p. 1775.


Figures

Figure 1:
Figure 1:. Folate restriction promotes resistance to MYC-targeting therapies.
(A) Heatmaps depicting Pearson correlation of MYC-related and metabolic gene sets (from KEGG and curated BIOCYC databases) interrogated using ssGSEA in two AML patient cohorts: TCGA-LAML; GSE14468. Orange connotes MYC-related gene sets; black and purple connote metabolic pathways most and least correlated with MYC-related signatures. Core MYC signature is defined by leading-edge genes from each MYC-related gene set. (B) XY graph representation of two patient datasets (TCGA-LAML; GSE14468) by Pearson correlation of defined clusters of metabolic pathways with core MYC signature. Red indicates core transcriptional MYC signature; orange and blue indicate metabolic signatures clusters highly and poorly correlated with core MYC signature. (C) Heatmap of OTX015 resistance of three AML cell lines (KG1a, IMS-M2, U937) in standard versus indicated amino acid-starved media. Results shown as log2 fold change of area under curve (AUC) normalized to average standard media. Each column for each condition represents a technical replicate (n=5/condition). Gray indicates that given condition is lethal. (D) Distribution of AUC and IC50 for human AML cell lines with OTX015 for 5 days. Error bars represent mean ± SD of seven technical replicates. (E) Distribution of IC50 for human AML cell lines with JQ1 (left) or THZ1 (right) for 5 days. Error bars represent mean ± SD of five technical replicates. (D-E) * p value ≤ 0.05 versus + folic acid condition calculated with Mann-Whitney test. (F) Two human AML cell lines were infected with two BRD4-directed shRNAs and grown in regular versus folic acid-starved media. Growth after treatment with 0.5μg/ml doxycycline normalized to control and shown relative to day 0 (time of seeding). Error bars represent mean ± SD of five technical replicates. * p value ≤ 0.05 calculated with Welch’s t-test versus shCT. (G) Colony formation from human U937 AML cells with 300nM OTX015 and indicated folic acid concentrations. Results represent average of triplicate assays. *p-value ≤ 0.05 calculated with Welch’s t-test versus 1mg/L folic acid condition. Error bars represent mean ± SD. (H) Bar graphs showing proportion of U937 and MOLM-14 human AML cells in apoptosis (Annexin V=A+/propidium iodide=PI+) with 750nM OTX015 combined with folic acid restriction. *p-value ≤ 0.05 with Welch’s t-test versus OTX015-treated cells grown in folic acid. Error bars represent mean ± SD of three technical replicates. (I) Distribution of IC50 for four MLL-translocated AML patient samples with OTX015 for 5 days. p-value calculated using nonparametric Mann-Whitney test. Error bars represent mean ± SD. (J-K) Mice fed regular or folic acid-restricted diet one month before injection of murine Ds-Redpositive MLL-AF9-driven leukemic cells. Mice treated with either vehicle or 35 mg/kg JQ1 for 7 days. Assessment of plasma homocysteine and methionine levels (J), and flow cytometry-based quantification of Ds-Red-positive leukemic blasts in bone marrow (K). p-value calculated using nonparametric Mann-Whitney test. n.s, nonsignificant (p > 0.05). Error bars represent mean ± SD of four mice/group. Each experiment in C–H performed at least twice. Each experiment in C–H performed by comparison of standard media (1000 ng/mL folic acid) and no folic acid media (0 ng/mL folic acid).
Figure 2:
Figure 2:. MTHFR suppression enhances resistance to BET inhibitors.
(A) Schematic of folate cycle, involved enzymes. (B) Immunoblot for each indicated enzyme, and VINCULIN (loading control) from human IMS-M2 cell line infected with control or two shRNAs. (C) Fold change in IC50 of OTX015 in IMS-M2 cells infected with indicated shRNAs targeting folate cycle enzymes. Results shown as fold change of IC50 normalized to average shControl. *p-value ≤ 0.05 by nonparametric Mann-Whitney test. Error bars represent mean ± SD of four technical replicates. Experiment performed at least two independent times. (D) Immunoblot for MTHFR and VINCULIN (loading control) from indicated human AML cell lines infected with control or two MTHFR-directed shRNAs (shMTHFR_1 and shMTHFR_2). (E) Growth inhibition of indicated AML cell lines infected with control or two MTHFR-directed shRNAs (shMTHFR_1 and shMTHFR_2) and treated with increasing OTX015 for 5 days. Error bars represent mean ± SD of seven technical replicates. (F) Colony formation from human U937 and OCI-AML2 AML cells infected with control (shCT) or MTHFR-directed shRNAs, and treated with 100nM and 30nM OTX015, respectively. Results represent average of triplicate assays. *p-value ≤ 0.05 by Welch’s t-test versus shCT. Error bars represent mean ± SD. Each experiment in E and F performed at least two independent times. (G) Immunoblot for Mthfr knockdown in murine eBFP-sorted bone marrow MLL-AF9-driven leukemic cells. Two mice depicted per condition. (H) Proportion of eBFP-positive MLL-AF9 leukemic cells harboring control (shCT) or two Mthfr-directed shRNAs (shMthfr_1 and shMthfr_2) in bone marrow from five mice per group treated with vehicle or 35mg/kg JQ1 for 7 days. p-value ≤ 0.01 by Mann-Whitney test. n.s, nonsignificant (p > 0.05). Error bars represent mean ± SD. (I) Kaplan-Meier curves showing overall survival of mice (n = 5 for each group) transplanted with MLL-AF9-positive blasts infected with control (shCT) or two Mthfr-directed shRNAs and treated with vehicle or 35mg/kg JQ1 for 7 days. Statistical significance by log-rank (Mantel-Cox) test. Each experiment in H and I performed at least two independent times.
Figure 3:
Figure 3:. C677T and A1298C MTHFR variants promote resistance to BET Inhibitors.
(A) Allelic discrimination plots depicting polymorphic status of MTHFR at C677 and A1298. Five CRISPR/Cas9-edited KG1a clones with various MTHFR genetic variants on C677 and A1298 were selected. (B) Distribution of IC50 with OTX015 for 6 days of CRISPR/Cas9-edited KG1a clones exhibiting various MTHFR genetic variants (n=5 clones per genotype). *p-value ≤ 0.05 by nonparametric Mann-Whitney test. Error bars represent mean ± SD. Experiment performed at least two independent times. (C) Colony formation from CRISPR/Cas9-edited KG1a clones exhibiting various MTHFR genetic variants with 1μM OTX015. Results represent average of triplicate assays. *p-value ≤ 0.05 by Welch’s t-test versus MTHFR 677CC & A1298AA clone with OTX015. Error bars represent mean ± SD. (D) Distribution of IC90 with OTX015 for 5 days of 16 MLL-translocated patient samples with AML divided into 2 subgroups according to MTHFR genetic status at C677, A1298. p-value by nonparametric Mann-Whitney test. Error bars represent mean ± SD. (E) MLL-AF9-transformed GFP-positive granulomonocytic progenitors (Sca-1/c-KIT+/CD16/32+/CD34+/MPO+) from homozygous wild-type (+/+), or heterozygous (+/−) and homozygous (−/−) Mthfr knockout mice transplanted into sublethally-irradiated recipient mice before treatment with vehicle or 50mg/kg JQ1 for 7 days. Proportion of GFP-positive MLL-AF9 leukemic cells in bone marrow from five mice per group. p-value by Mann-Whitney test. n.s, nonsignificant (p > 0.05). Error bars represent mean ± SD. (F) Immunoblot for MTHFR and VINCULIN (loading control) from human AML cell lines overexpressing wild-type DD-tagged MTHFR. (G-H) Fold change in IC50 of OTX015 for 5 days in AML cell lines (G) or CRISPR/Cas9-edited KG1a clones (H) expressing a construct encoding either empty control or DD-tagged wild-type MTHFR divided into two groups according to MTHFR genotypes at C677, A1298. Results shown as fold change of IC50 normalized to average empty vector condition. *p-value by nonparametric Mann-Whitney test. n.s, nonsignificant (p > 0.05). Error bars represent mean ± SD. (I-J) Fold change in IC50 of OTX015 in IMS-M2 and U937 cells infected with control or two MTHFR-directed shRNAs (I) or indicated CRISPR/Cas9-edited KG1a clones (J) with 50μM 5-CH3 THF for 5 days. Results shown as fold change of IC50 normalized to average untreated condition. *p-value ≤ 0.05 by nonparametric Mann-Whitney test. n.s, nonsignificant (p > 0.05). Error bars represent mean ± SD. Each experiment in G–J performed at least two independent times. (K) Distribution of IC90 to OTX015 for 5 days and 50μM 5-CH3 THF treatment of three MLL-translocated AML patient samples. Square represents a patient with MTHFR 677 CT & 1298 AC genotype; the two others exhibit MTHFR 677 CC & A1298 CC genotype. *p-value ≤ 0.05 by nonparametric Mann-Whitney test. Error bars represent mean ± SD.
Figure 4:
Figure 4:. Folate cycle disruption impacts metabolic and histone H3 methylation state in AML cells.
(A) Heatmap of top upregulated or downregulated metabolites (p-value ≤ 0.05) identified by steady-state metabolism profiling in human U937 cells in standard or folic acid-restricted media (− FA). Each column for each condition represents a technical replicate (n=4 per condition). (B) Intracellular SAH in indicated human AML cell lines with folic acid (FA) withdrawal (leftl) or MTHFR suppression using two MTHFR-directed shRNAs (shMTHFR_1 and shMTHFR_2, right). *p-value ≤ 0.05 by Welch’s t-test versus respective control. Error bars represent mean ± SD of three technical replicates. (C) Fold change in IC50 of OTX015 for 5 days in human AML cell lines depleted or supplemented with indicated metabolites. L = low. Results shown as fold change of IC50 normalized to average control condition. SAH was used at 50μM. *p-value ≤ 0.05 by nonparametric Mann-Whitney test. n.s, nonsignificant (p > 0.05). Error bars represent mean ± SD of five technical replicates. Each experiment in A–C performed at least two independent times. (D) ELISA quantification of H3 modifications with folic acid withdrawal in U937 and IMS-M2 AML cells. Results normalized to total H3 per cell type and shown relative to average control across the two lines. *p-value ≤ 0.05 by nonparametric Mann-Whitney test. Error bars represent mean ± SD of three technical replicates per line. (E-G) Immunoblot for MTHFR, H3K9Me2, H3K27me3, total H3, ACTIN, and VINCULIN (loading control) from indicated human AML cell lines (E), CRISPR/Cas9-edited KG1a clones exhibiting indicated MTHFR genetic variants (F), and primary MLL-AF9-expressing bone marrow either wild-type (+/+), or heterozygous (+/−) and homozygous (−/−) Mthfr knockout murine cells (G). (H) Quantification of H3K27me3 (right) and H3K9Me2 (left) methyltransferase activities in U937 and IMS-M2 cells upon folate withdrawal or MTHFR knockdown (shMTHFR_1 and shMTHFR_2). *p-value ≤ 0.05 by Welch’s t-test versus respective control. Error bars represent mean ± SD of three technical replicates. (I) Waterfall plot of top rescuers of or sensitizers to JQ1 from CRISPR/Cas9-based screen on epigenetic regulators. Absolute cut-off of z-score ≥ 0.70 defines rescuers and z-score ≤ − 0.70 defines sensitizers. In red and blue are H3K27me3 or H3K9me2 methyltransferases and demethylases, respectively. (J) Growth inhibition of U937 cells expressing control hairpin (shCT) or hairpins against EED, EHMT1, or SETDB1 and treated with increasing OTX015 for 6 days. Error bars represent mean ± SD of seven technical replicates. Experiment performed at least two independent times. Each experiment in B–D, and H performed by comparison of standard media (1000 ng/mL folic acid) and no folic acid media (0 ng/mL folic acid).
Figure 5:
Figure 5:. Folate cycle disruption combined with BET inhibitors activate a SPI1 transcriptional program.
(A) Heatmap of top common up- and down-regulated genes in human IMS-M2 and U937 cell lines with 1μM and 300nM OTX015, respectively for 24 hours in regular (1000 ng/mL folic acid) versus folic acid-deprived media (0 ng/mL folic acid). p-value ≤ 0.05, FDR ≤ 0.05, and absolute fold change for log2(FPKM) scores ≥ 1.5. Each column for each condition represents an independent biological replicate (n=3 per condition in two human cell lines). (B) Quantitative comparison of gene sets from MSigDB, ENCODE, and CHEA by GSEA for IMS-M2 and U937 cell lines. Top volcano plots compare DMSO versus OTX015 in +folic acid (+FA) or -folic acid (−FA) conditions. Bottom volcano plots compare +FA versus −FA in DMSO- or OTX015-treated cells. Red indicates sets for SPI1 program, black for Interferon / IRF program, purple for MYC program, and gray for all other available gene sets. All datasets above dashed red line have p-value ≤ 0.05, big dots have FDR ≤ 0.25. (C) Venn diagrams for integrative analysis deployed to select top genes from ChIP-Sequencing and RNA-sequencing in IMS-M2 and U937 cells. (D) Enrichr overlapping analysis of top-enriched transcription factor-related gene sets from combined list of genes identified at intersection of ChIP- and RNA-sequencing in IMS-M2 and U937 cell lines. (E-F) Heatmap showing expression of SPI1 transcriptional targets by qRT-PCR. Normalized data presented as log2-ratio versus control shRNA (shCT) (E) or log2-ratio versus DMSO-treated clones (F). Experiment performed at least two independent times. (G-H) Immunoblot for MTHFR, SPI1, and VINCULIN (loading control) from U937 cells infected with control or two SPI1-directed shRNAs (shSPI1_1 and shSPI1_2) with folic acid (FA) withdrawal (G) or in combination with MTHFR depletion using MTHFR-directed shRNAs (shMTHFR_1 and shMTHFR_2) (H). (I-J) Fold change in IC50 of OTX015 for 5 days in U937 and IMS-M2 cells infected with control or two SPI1-directed shRNAs and starved from folic acid (−FA, 0 ng/mL folic acid) (I) or co-infected with control or two MTHFR-directed shRNAs (J). (K) Fold change in IC50 of OTX015 for 5 days in homozygous wild-type (+/+) or homozygous (−/−) Mthfr knockout MLL-AF9 leukemic cells infected with control or two Spi1-directed shRNAs. (I-K) Results shown as fold change of IC50 normalized to average shControl. *p-value ≤ 0.05 by nonparametric Mann-Whitney test. n.s, nonsignificant (p > 0.05). Error bars represent mean ± SD of five technical replicates. Each experiment in E, F, and I–K performed at least two independent times. (L) Proportion of eGFP- and eBFP-positive expressing either a control (shCT) or a Spi1-directed shRNA (shSpi1_1) in bone marrow from four mice per group treated with either vehicle or 50mg/kg JQ1 for 7 days. *p-value ≤ 0.05 by Mann-Whitney test. n.s, nonsignificant (p > 0.05). Error bars represent mean ± SD.

Comment in

Similar articles

Cited by

References

    1. Hanahan D, Weinberg RA. Hallmarks of cancer: the next generation. Cell. 2011;144:646–74. - PubMed
    1. Hsu PP, Sabatini DM. Cancer cell metabolism: Warburg and beyond. Cell. 2008;134:703–7. - PubMed
    1. Lunt SY, Vander Heiden MG. Aerobic glycolysis: meeting the metabolic requirements of cell proliferation. Annual review of cell and developmental biology. 2011;27:441–64. - PubMed
    1. Pavlova NN, Thompson CB. The Emerging Hallmarks of Cancer Metabolism. Cell metabolism. 2016;23:27–47. - PMC - PubMed
    1. Luengo A, Gui DY, Vander Heiden MG. Targeting Metabolism for Cancer Therapy. Cell chemical biology. 2017;24:1161–80. - PMC - PubMed

Publication types