

Resolving the Connectome, Spectrally-Specific Functional Connectivity Networks and Their Distinct Contributions to Behavior
- PMID: 32826259
- PMCID: PMC7484267
- DOI: 10.1523/ENEURO.0101-20.2020
Resolving the Connectome, Spectrally-Specific Functional Connectivity Networks and Their Distinct Contributions to Behavior
Abstract
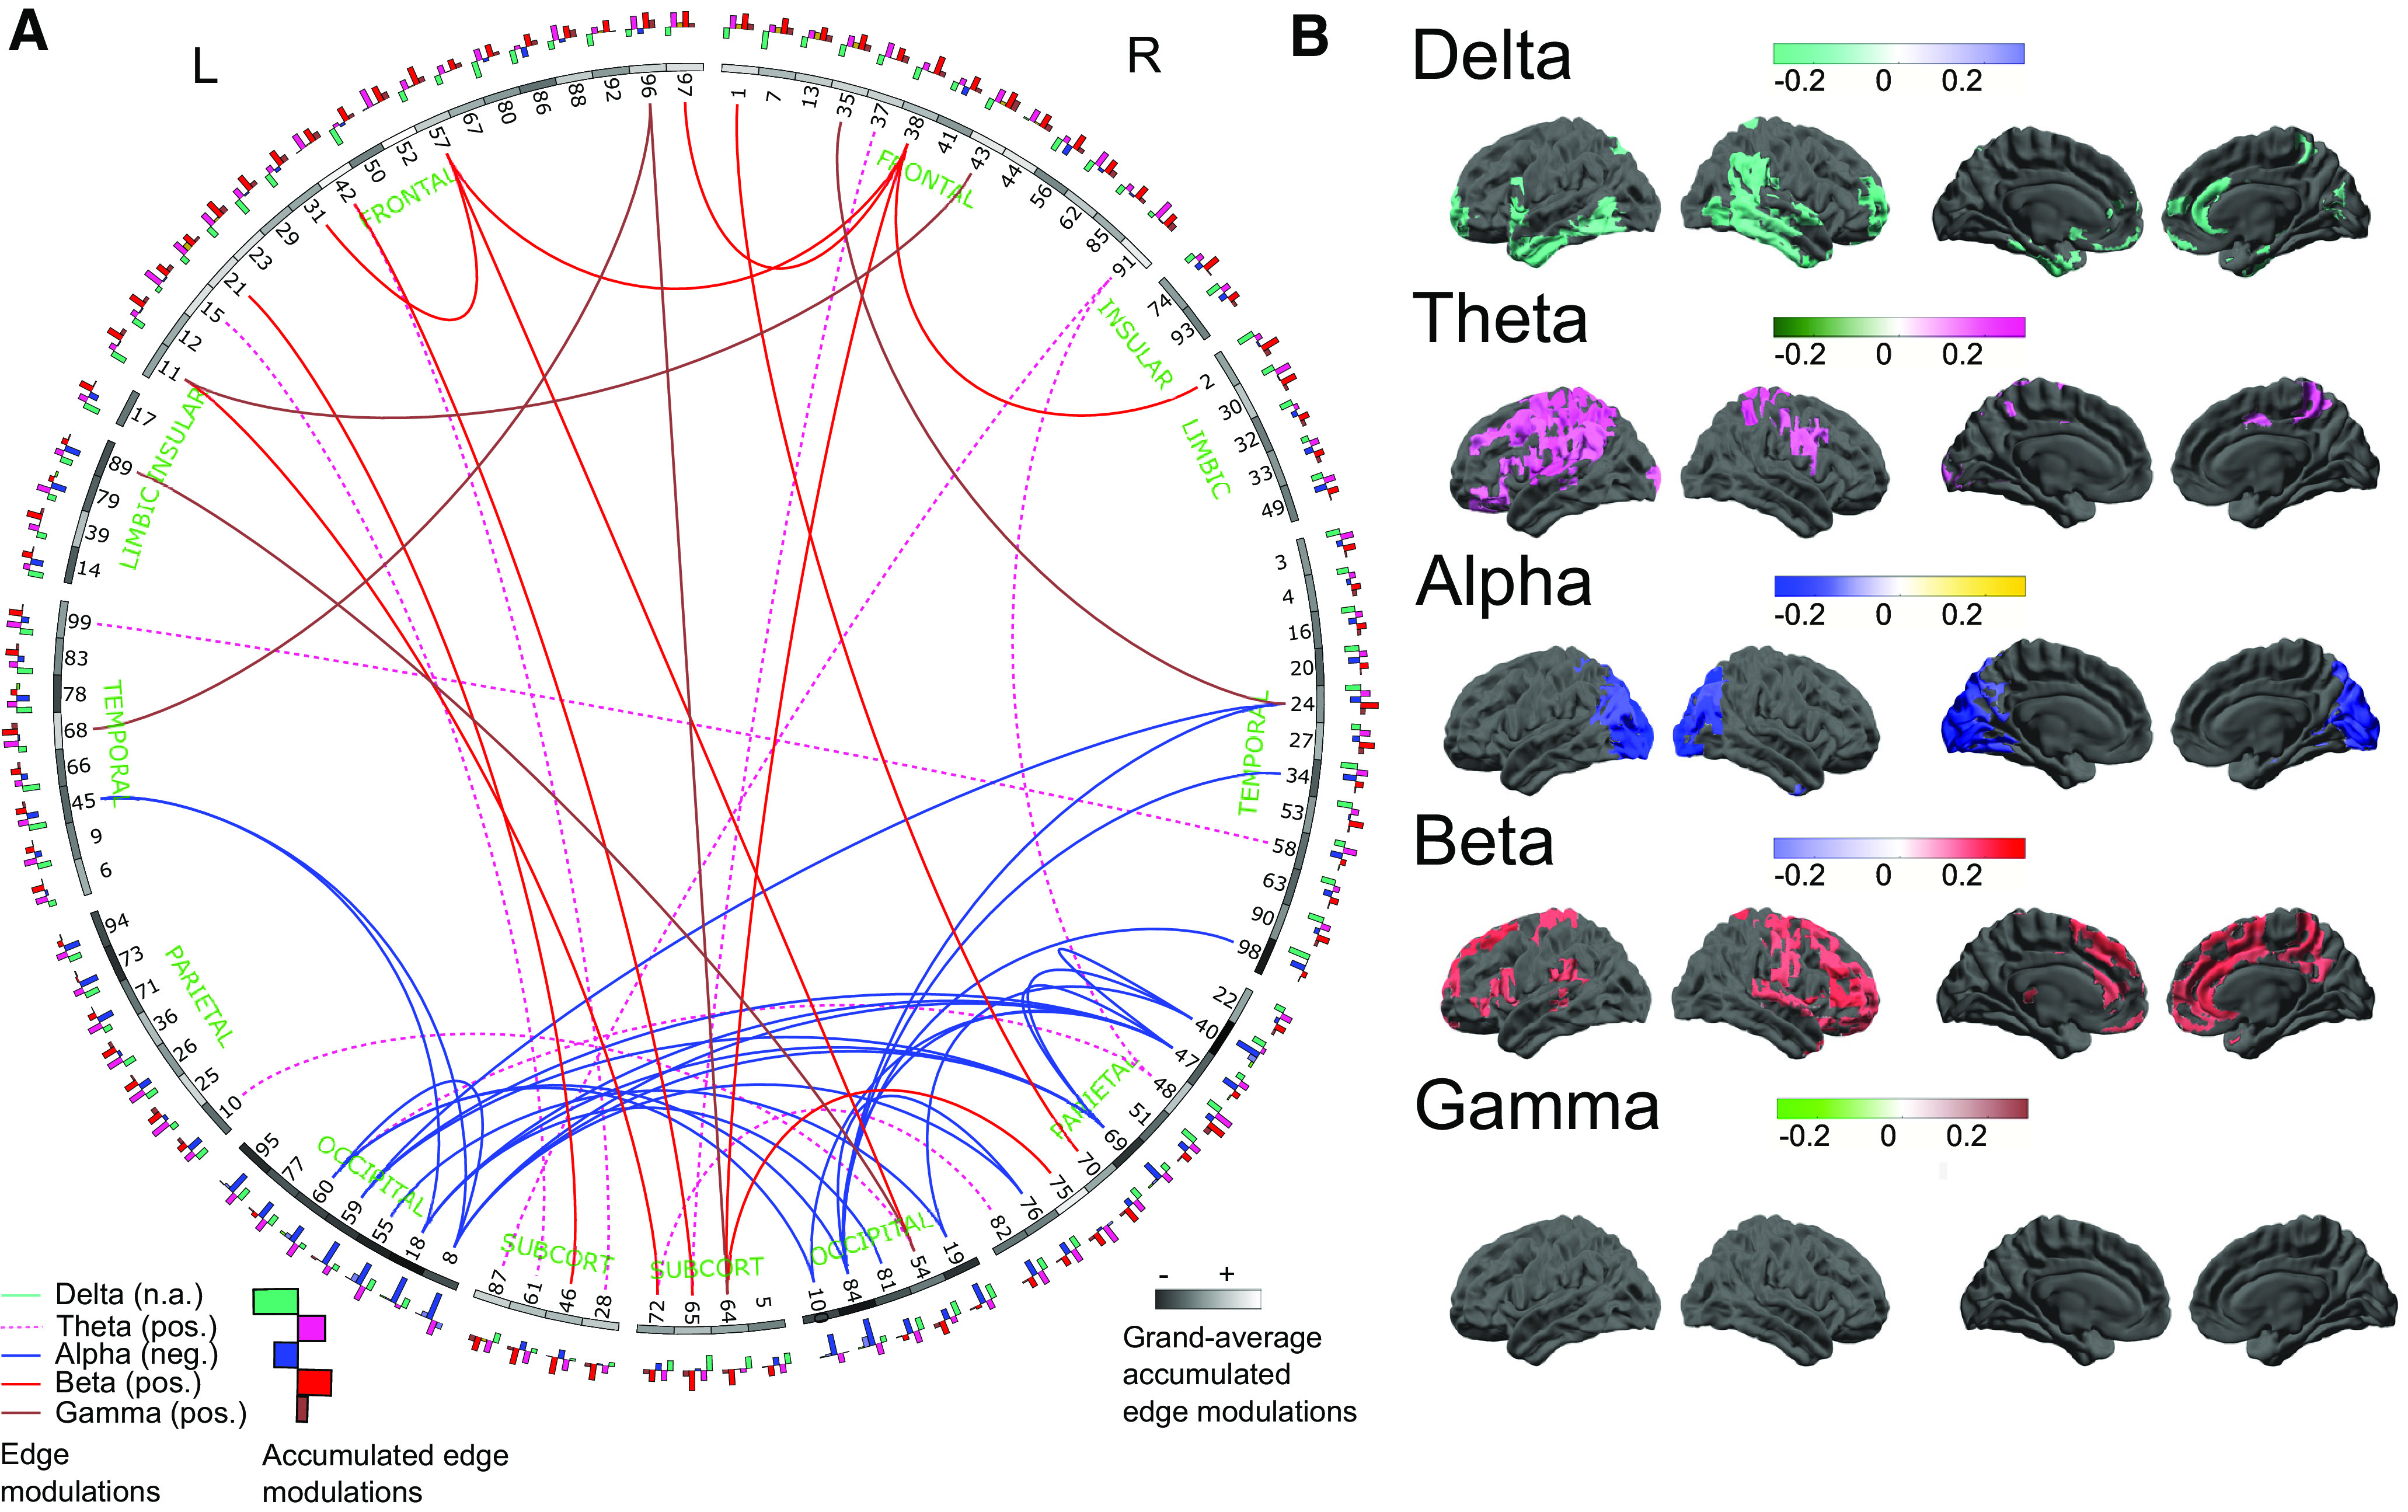
The resting human brain exhibits spontaneous patterns of activity that reflect features of the underlying neural substrate. Examination of interareal coupling of resting-state oscillatory activity has revealed that the brain's resting activity is composed of functional networks, whose topographies differ depending on oscillatory frequency, suggesting a role for carrier frequency as a means of creating multiplexed, or functionally segregated, communication channels between brain areas. Using canonical correlation analysis (CCA), we examined spectrally resolved resting-state connectivity patterns derived from magnetoencephalography (MEG) recordings to determine the relationship between connectivity intrinsic to different frequency channels and a battery of over a hundred behavioral and demographic indicators, in a group of 89 young healthy participants. We demonstrate that each of the classical frequency bands in the range 1-40 Hz (δ, θ, α, β, and γ) delineates a subnetwork that is behaviorally relevant, spatially distinct, and whose expression is either negatively or positively predictive of individual traits, with the strongest link in the α-band being negative and networks oscillating at different frequencies, such as θ, β, and γ carrying positive function.
Keywords: canonical correlation analysis; connectome; networks; oscillations; resting state; variability.
Copyright © 2020 Becker and Hervais-Adelman.
Figures


Similar articles
-
Measuring robust functional connectivity from resting-state MEG using amplitude and entropy correlation across frequency bands and temporal scales.Neuroimage. 2021 Feb 1;226:117551. doi: 10.1016/j.neuroimage.2020.117551. Epub 2020 Nov 10. Neuroimage. 2021. PMID: 33186722 Free PMC article.
-
Frequency-dependent functional connectivity within resting-state networks: an atlas-based MEG beamformer solution.Neuroimage. 2012 Feb 15;59(4):3909-21. doi: 10.1016/j.neuroimage.2011.11.005. Epub 2011 Nov 9. Neuroimage. 2012. PMID: 22122866 Free PMC article.
-
Reliability of Magnetoencephalography and High-Density Electroencephalography Resting-State Functional Connectivity Metrics.Brain Connect. 2019 Sep;9(7):539-553. doi: 10.1089/brain.2019.0662. Epub 2019 Jun 26. Brain Connect. 2019. PMID: 31115272
-
Adult lifespan trajectories of neuromagnetic signals and interrelations with cortical thickness.Neuroimage. 2023 Sep;278:120275. doi: 10.1016/j.neuroimage.2023.120275. Epub 2023 Jul 13. Neuroimage. 2023. PMID: 37451375 Free PMC article. Review.
-
Brain Functional Connectivity Through Phase Coupling of Neuronal Oscillations: A Perspective From Magnetoencephalography.Front Neurosci. 2019 Sep 12;13:964. doi: 10.3389/fnins.2019.00964. eCollection 2019. Front Neurosci. 2019. PMID: 31572116 Free PMC article. Review.
Cited by
-
Multilayer MEG functional connectivity as a potential marker for suicidal thoughts in major depressive disorder.Neuroimage Clin. 2020;28:102378. doi: 10.1016/j.nicl.2020.102378. Epub 2020 Aug 8. Neuroimage Clin. 2020. PMID: 32836087 Free PMC article.
-
Brain rhythms define distinct interaction networks with differential dependence on anatomy.Neuron. 2021 Dec 1;109(23):3862-3878.e5. doi: 10.1016/j.neuron.2021.09.052. Epub 2021 Oct 20. Neuron. 2021. PMID: 34672985 Free PMC article.
-
Global and localized network characteristics of the resting brain predict and adapt to foreign language learning in older adults.Sci Rep. 2022 Mar 7;12(1):3633. doi: 10.1038/s41598-022-07629-y. Sci Rep. 2022. PMID: 35256672 Free PMC article.
-
Graph Analysis of EEG Functional Connectivity Networks During a Letter-Speech Sound Binding Task in Adult Dyslexics.Front Psychol. 2021 Nov 19;12:767839. doi: 10.3389/fpsyg.2021.767839. eCollection 2021. Front Psychol. 2021. PMID: 34899515 Free PMC article.
-
Individual theta-band cortical entrainment to speech in quiet predicts word-in-noise comprehension.Cereb Cortex Commun. 2023 Jan 5;4(1):tgad001. doi: 10.1093/texcom/tgad001. eCollection 2023. Cereb Cortex Commun. 2023. PMID: 36726796 Free PMC article.
References
-
- Altenmueller EO, Muente TF, Gerloff C (2005) Neurocognitive functions and the EEG In: Electroencephalography: basic principles, clinical applications, and related fields (Niedermeyer E, Lopes da Silva FH, eds). Philadelphia: Lippincott Williams & Wilkins Company.
MeSH terms
LinkOut - more resources
Full Text Sources