. 2020 Sep 23;40(39):7523-7530.
doi: 10.1523/JNEUROSCI.0771-20.2020. Epub 2020 Aug 21.

Beta-Band Activity Is a Signature of Statistical Learning

Affiliations

Beta-Band Activity Is a Signature of Statistical Learning

Louisa Bogaerts et al. J Neurosci. .

Abstract

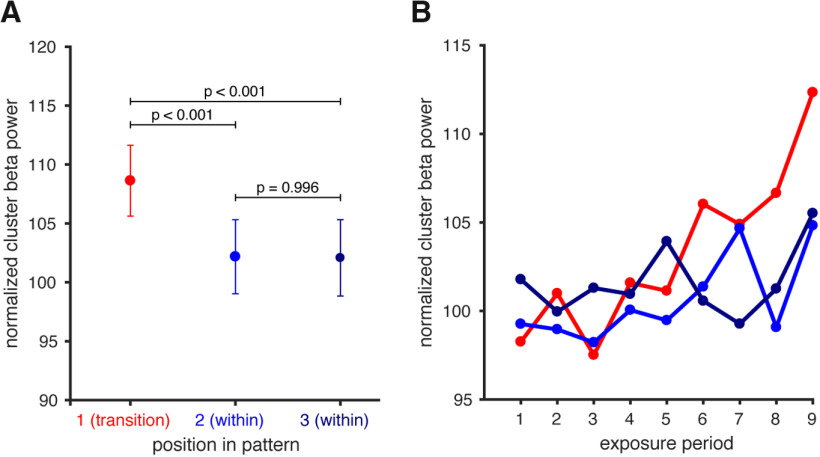
Through statistical learning (SL), cognitive systems may discover the underlying regularities in the environment. Testing human adults (n = 35, 21 females), we document, in the context of a classical visual SL task, divergent rhythmic EEG activity in the interstimulus delay periods within patterns versus between patterns (i.e., pattern transitions). Our findings reveal increased oscillatory activity in the beta band (∼20 Hz) at triplet transitions that indexes learning: it emerges with increased pattern repetitions; and importantly, it is highly correlated with behavioral learning outcomes. These findings hold the promise of converging on an online measure of learning regularities and provide important theoretical insights regarding the mechanisms of SL and prediction.SIGNIFICANCE STATEMENT Statistical learning has become a major theoretical construct in cognitive science, providing the primary means by which organisms learn about regularities in the environment. As such, it is a critical building block for basic and higher-order cognitive functions. Here we identify, for the first time, a spectral neural index in the time window before stimulus presentation, which evolves with increased pattern exposure, and is predictive of learning performance. The manifestation of learning that is revealed, not in stimulus processing but in the blank interval between stimuli, makes a direct link between the fields of statistical learning on the one hand and either prediction or consolidation on the other hand, suggesting a possible mechanistic account of visual statistical learning.

Keywords: electroencephalography; neurobiological signature; prediction; statistical learning.


Figures

Figure 1.
Figure 1.
Schematic depiction of the structured familiarization stream, containing 9 exposure periods each consisting of 6 repetitions of 8 embedded triplets.
Figure 2.
Figure 2.
A, Peaks in the grand-average raw power spectrum of all prestimulus epochs within the structured and random stream. Yellow lines indicate the peak frequency. B, Time-frequency plots for the grand-average for the entire trial epoch. A, B, Bottom, Lower frequencies; Top, Higher frequencies (with separate axes).
Figure 3.
Figure 3.
A, Average normalized beta power for the significant cluster (based on learners). Error bars indicate the between-subject SE. p-values are corrected for multiple comparisons. B, Temporal evolution of the cluster beta power for each of the prestimulus intervals, across the structured familiarization stream. Exposure Period 1 indicates the start of the structured familiarization stream. Period 9 indicates the end of the structured familiarization stream.
Figure 4.
Figure 4.
Temporal evolution of the topography of the difference between prestimulus beta-band power for within versus between triplet transitions (based on the full sample). Period 1 indicates the start of the structured familiarization stream. Period 9 indicates the end of the structured familiarization stream. Electrodes that are part of the significant cluster are filled black.
Figure 5.
Figure 5.
A, Boxplot summarizing the beta power modulation (average difference across exposure Periods 4-9) for participants classified as learners versus other. On each box, the central line indicates the median, and bottom and top edges of the box indicate the 25th and 75th percentiles. Dashed whiskers extend to the most extreme data points not considering outliers. +, Outliers. B, Relation between the size of the beta power difference and behavioral test scores. C, The relation between the beta power difference (calculated per exposure period) and test scores increases over time. Dashed line indicates the critical rho value.

References

    1. Abla D, Katahira K, Okanoya K (2008) On-line assessment of statistical learning by event-related potentials. J Cogn Neurosci 20:952–964. 10.1162/jocn.2008.20058 - DOI - PubMed
    1. Abla D, Okanoya K (2009) Visual statistical learning of shape sequences: an ERP study. Neurosci Res 64:185–190. 10.1016/j.neures.2009.02.013 - DOI - PubMed
    1. Arnal LH, Giraud AL (2012) Cortical oscillations and sensory predictions. Trends Cogn Sci 16:390–398. 10.1016/j.tics.2012.05.003 - DOI - PubMed
    1. Aslin RN, Saffran JR, Newport EL (1998) Computation of conditional probability statistics by 8-month-old infants. Psychol Sci 9:321–324. 10.1111/1467-9280.00063 - DOI
    1. Bastos AM, Usrey MW, Adams RA, Mangun GR, Fries P, Friston KJ (2012) Canonical Microcircuits for Predictive Coding. Neuron 76:695–711. - PMC - PubMed

Publication types