. 2020 Aug 21;5(50):eabb4432.
doi: 10.1126/sciimmunol.abb4432.

Heterogeneity and clonal relationships of adaptive immune cells in ulcerative colitis revealed by single-cell analyses

Affiliations

Heterogeneity and clonal relationships of adaptive immune cells in ulcerative colitis revealed by single-cell analyses

Brigid S Boland et al. Sci Immunol. .

Abstract

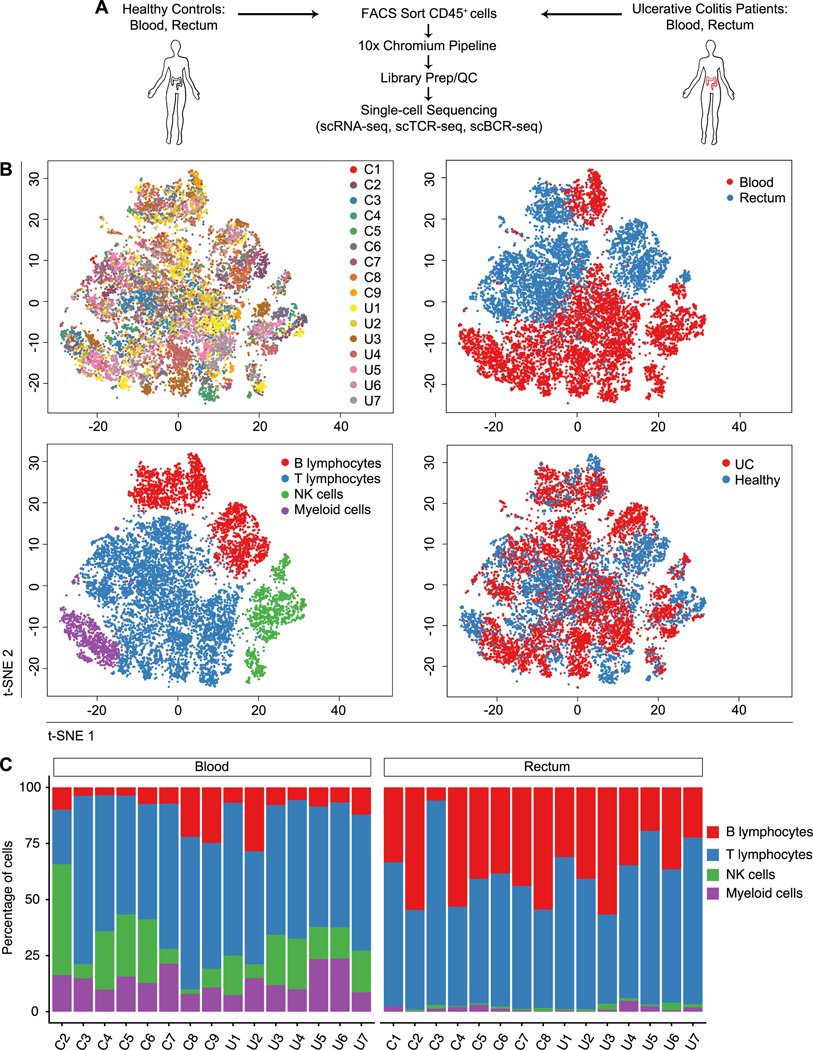
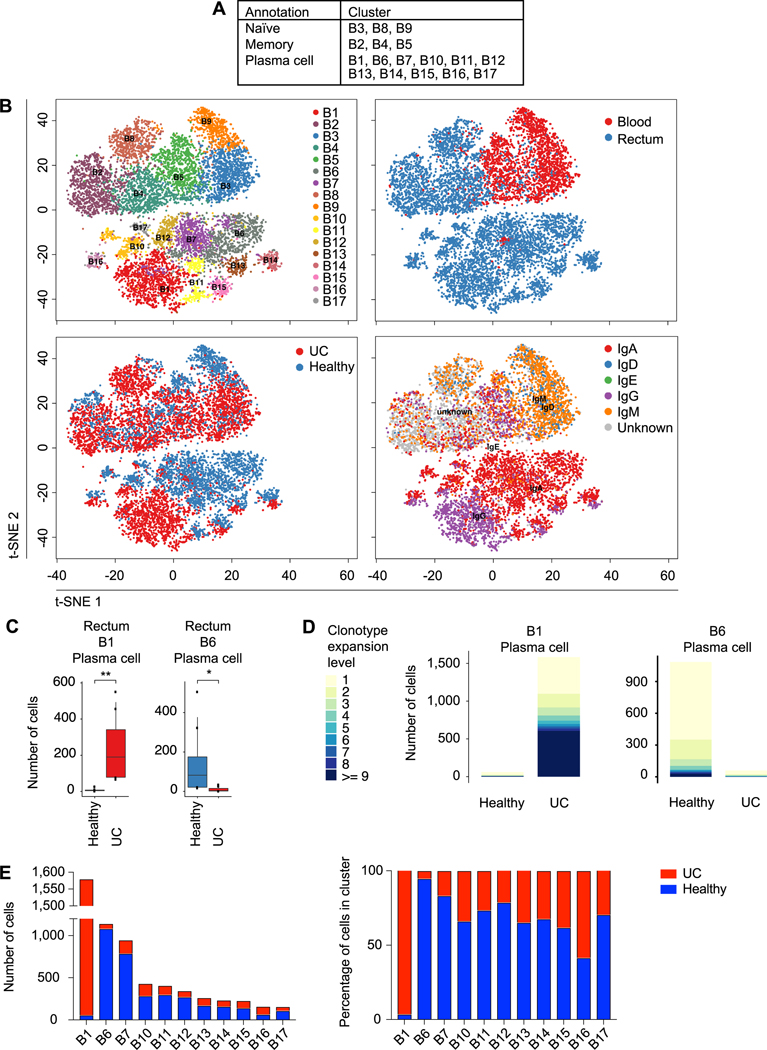
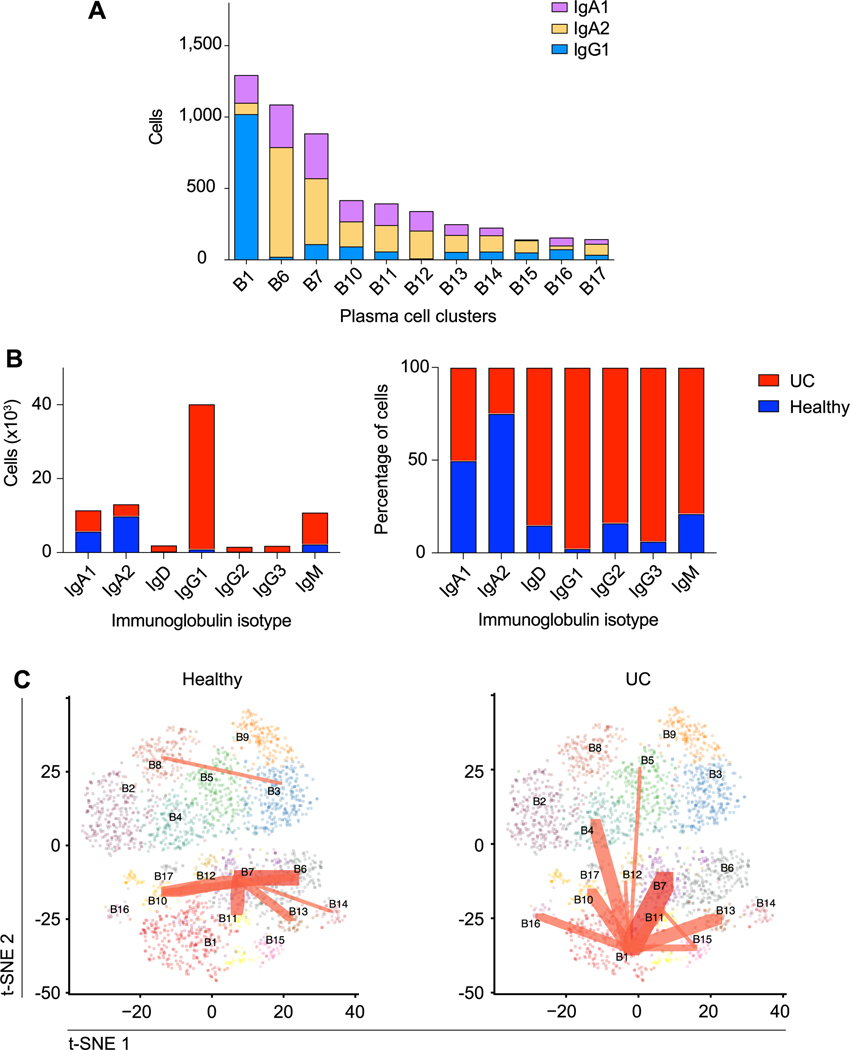
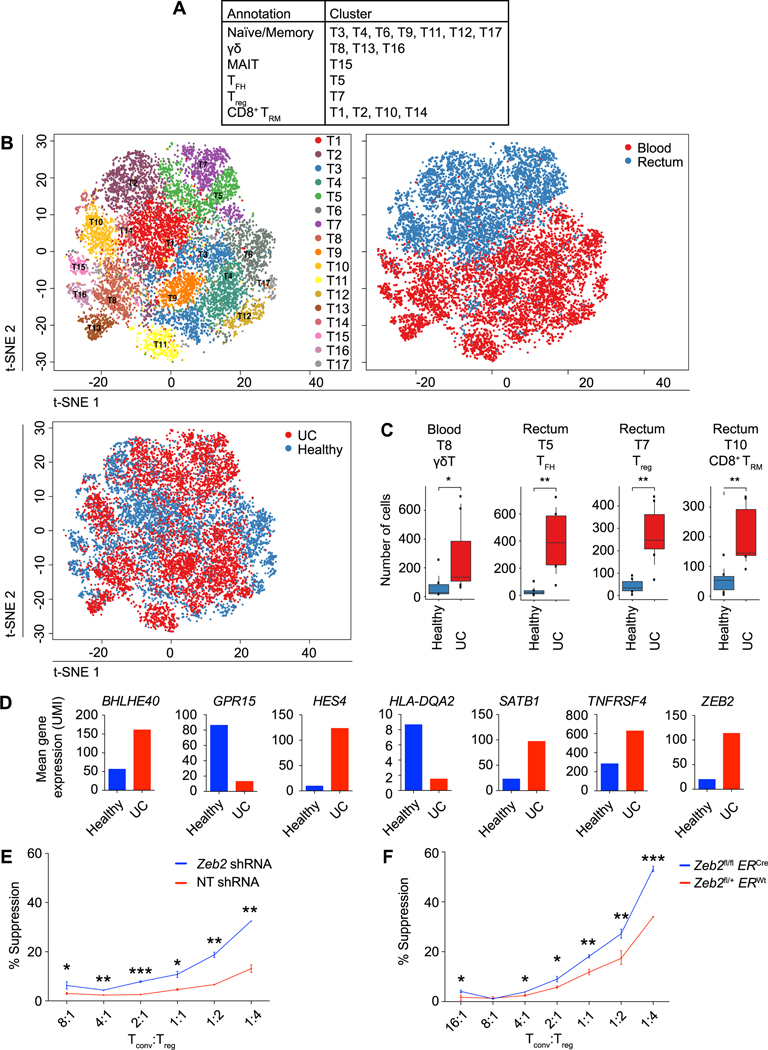
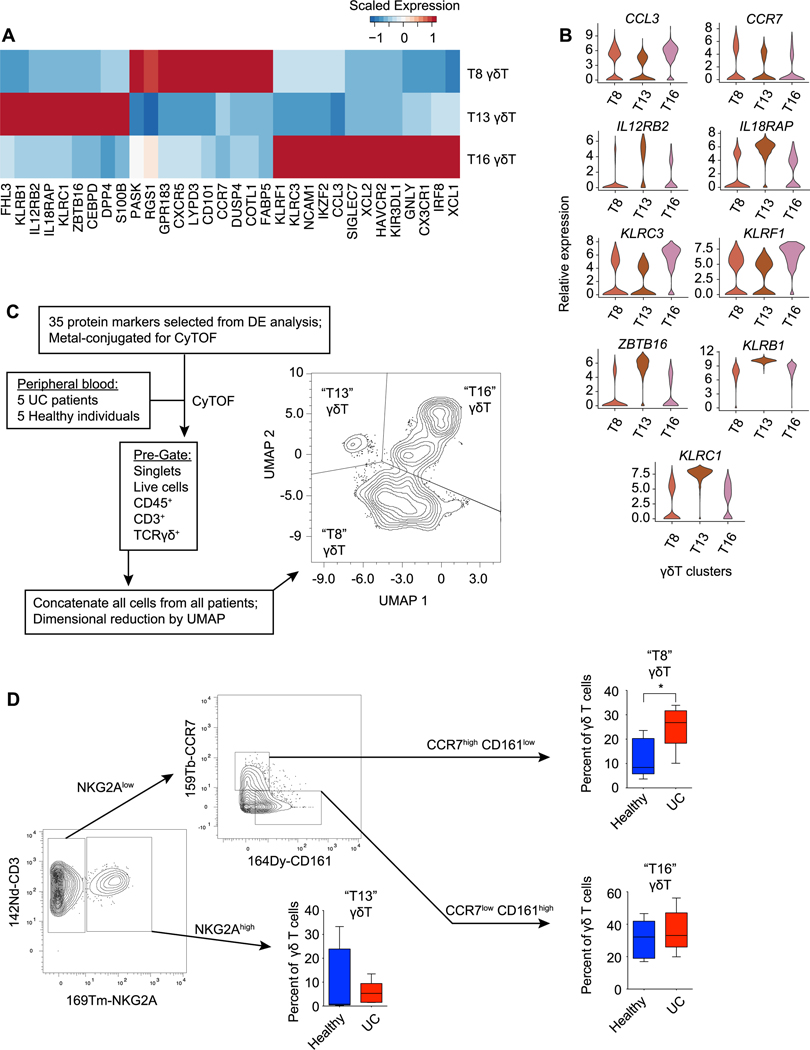
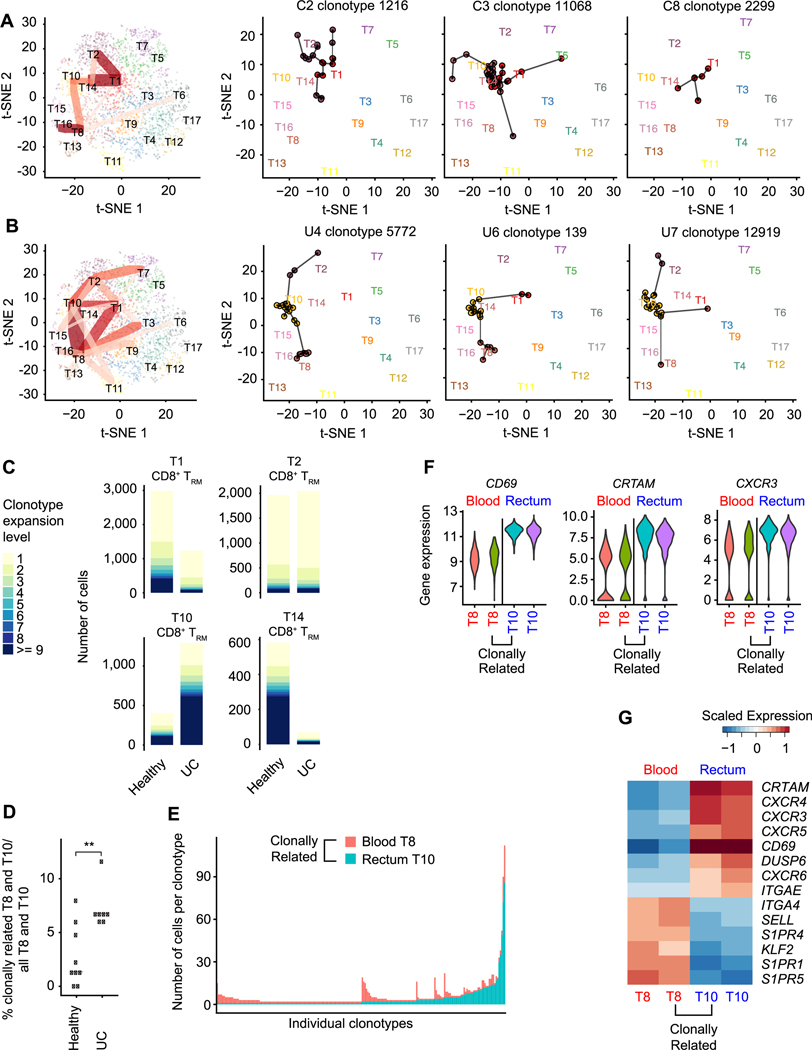
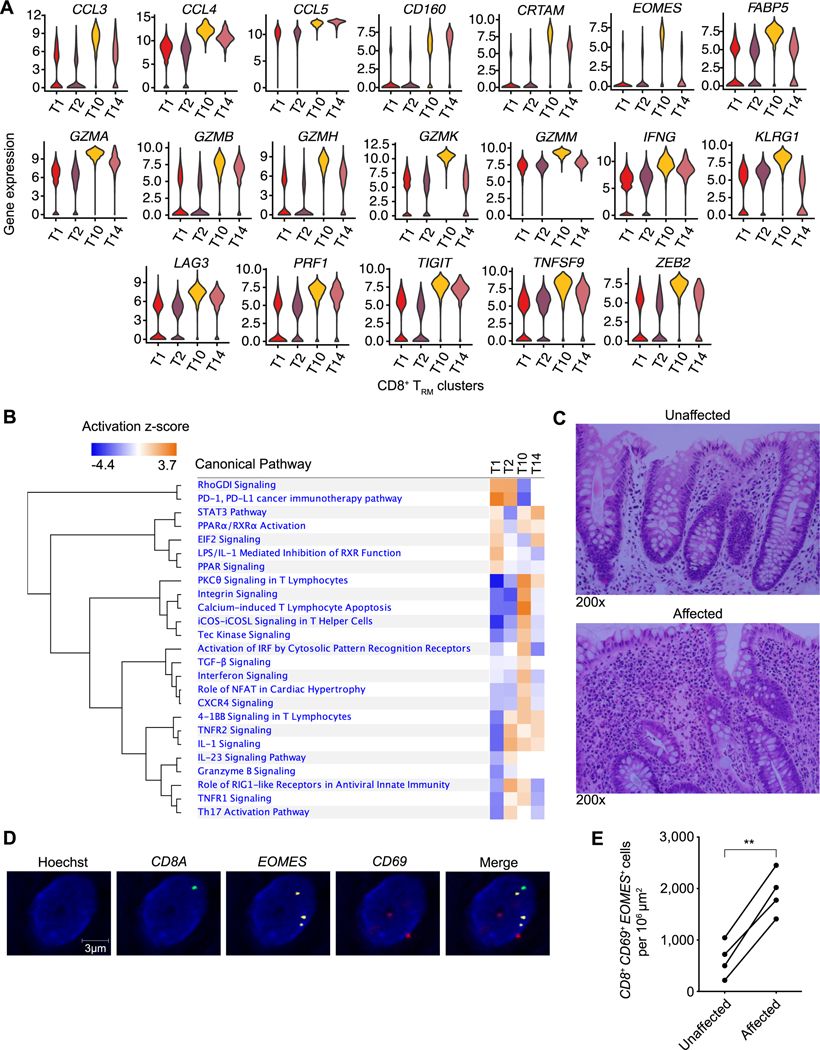
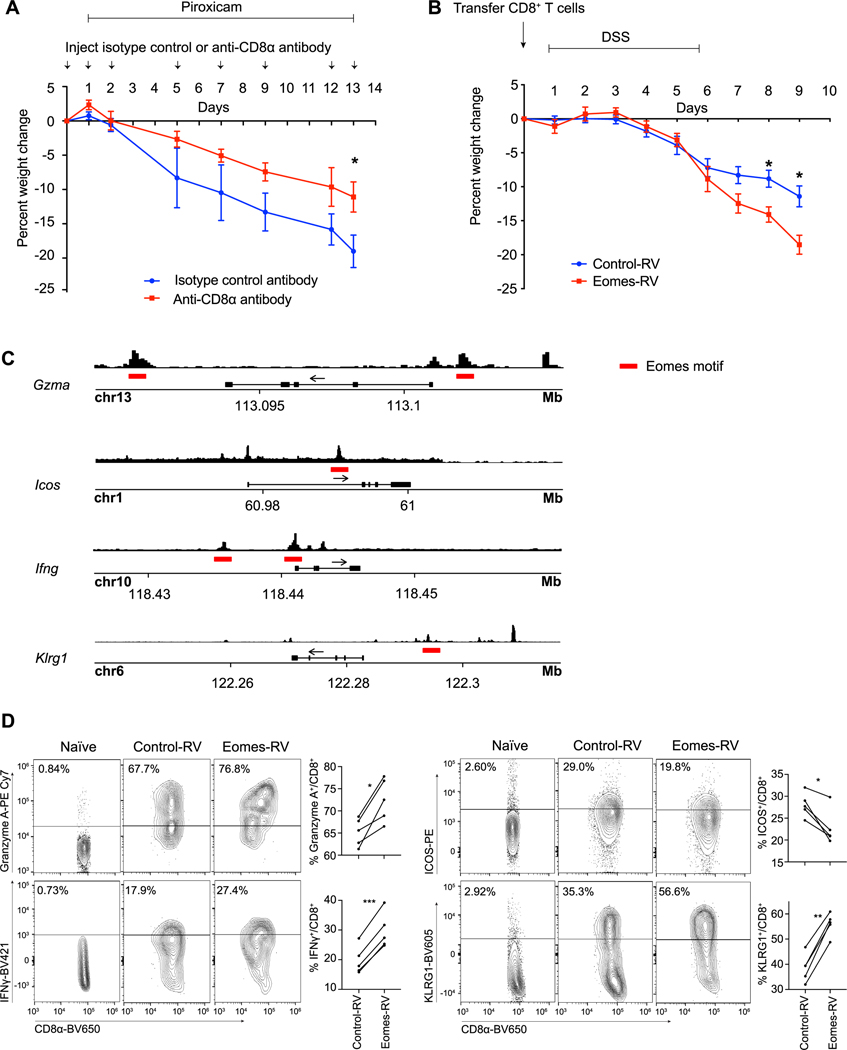
Inflammatory bowel disease (IBD) encompasses a spectrum of gastrointestinal disorders driven by dysregulated immune responses against gut microbiota. We integrated single-cell RNA and antigen receptor sequencing to elucidate key components, cellular states, and clonal relationships of the peripheral and gastrointestinal mucosal immune systems in health and ulcerative colitis (UC). UC was associated with an increase in IgG1+ plasma cells in colonic tissue, increased colonic regulatory T cells characterized by elevated expression of the transcription factor ZEB2, and an enrichment of a γδ T cell subset in the peripheral blood. Moreover, we observed heterogeneity in CD8+ tissue-resident memory T (TRM) cells in colonic tissue, with four transcriptionally distinct states of differentiation observed across health and disease. In the setting of UC, there was a marked shift of clonally related CD8+ TRM cells toward an inflammatory state, mediated, in part, by increased expression of the T-box transcription factor Eomesodermin. Together, these results provide a detailed atlas of transcriptional changes occurring in adaptive immune cells in the context of UC and suggest a role for CD8+ TRM cells in IBD.


Figures

Fig. 1.
Fig. 1.. Single-cell analyses reveals cellular composition of the human immune system in health and ulcerative colitis.
(A) Overview of the experimental design and analysis. (B) t-SNE plots of cells from all subjects across all anatomic sites (upper left; “C” labels indicate healthy controls, “U” labels indicate UC patients); colored by anatomic location from which cells were derived (upper right); major immune cell groups (lower left); or by health status (lower right; UC patients vs. healthy individuals). (C) Proportion of each major immune cell group in healthy individuals and UC patients, across both anatomic sites for each subject, as a percentage of all cells.
Fig. 2.
Fig. 2.. Enrichment and clonal expansion of an intestinal plasma B cell cluster in ulcerative colitis.
(A) Phenotypic annotations of B lymphocyte clusters. (B) t-SNE plots of B lymphocyte clusters, colored by cluster identity (upper left); anatomic location from which cells were derived (upper right); health status (lower left; “C” labels indicate healthy controls, “U” labels indicate UC patients); and immunoglobulin heavy chain expression, determined using scBCR-seq data (lower right). (C) Quantitation of selected B lymphocyte clusters enriched or depleted in health vs. disease, expressed as absolute numbers. (D) Comparison of clonotypic expansion exhibited by cells from indicated plasma cell clusters, quantitated separately in healthy individuals vs. UC patients. (E) Absolute number (left) and percentage of cells (right) from each cluster derived from healthy individuals (blue) or UC patients (red). Two-sided Wilcoxon rank sum test (C). * p < 0.05, ** p < 0.01.
Fig. 3.
Fig. 3.. Clonal relationships of intestinal plasma B cell clusters in health and ulcerative colitis.
(A) Quantitation of IgA1+, IgA2+, and IgG1+ cells within each plasma cell cluster, determined using scBCR-seq data. (B) Absolute number and percentage of cells from UC patients or healthy individuals are shown for each immunoglobulin isotype (IgA1+, IgA2+, IgD+, IgG1+, IgG2+, and IgM+ only; very few IgG3+, IgG4+, or IgE+ cells were detected). (C) t-SNE plots of plasma cell clusters, colored by cluster identity, with red lines indicating BCR clonotypes shared among clusters and line weight representing number of shared clonotypes, for healthy individuals (left) vs. UC patients (right).
Fig. 4.
Fig. 4.. CD4+ Treg cells from UC patients and healthy individuals exhibit distinct transcriptional signatures.
(A) Phenotypic annotations of T lymphocyte clusters. (B) t-SNE plots of T lymphocyte clusters, colored by cluster identity (upper left); anatomic location from which cells were derived (upper right); and health status (lower left; “C” labels indicate healthy controls, “U” labels indicate UC patients). (C) Quantitation of T lymphocyte clusters that were enriched or depleted in health vs. disease, expressed as absolute numbers. (D) Mean expression of selected genes that were differentially expressed between T7 cluster CD4+ Treg cells derived from healthy individuals (blue) vs. UC patients (red); see also table S5. (E) In vitro suppression assay using induced Treg cells transduced with non-targeting shRNA (n=3) or Zeb2 shRNA (n=3) or (F) induced Treg cells from tamoxifen-treated ERWtZeb2fl/+ (n=3) and ERCreZeb2fl/fl (n= 3) mice. Putative Treg cells were sorted on the basis of high CD4 and CD25 expression and these cells expressed high levels of Foxp3; see also fig. S5. Error bars indicate s.e.m. Two-sided Wilcoxon rank sum test (B); unpaired Student’s t-test for each Tconv:Treg ratio (D, E). * p < 0.05, ** p < 0.01, *** p < 0.001.
Fig. 5.
Fig. 5.. Differential enrichment of γδ T cell clusters in health vs. ulcerative colitis.
(A) Heatmap of mean expression of selected genes differentially expressed between γδ T cell clusters (T8, T13, and T16). (B) Violin plots of selected genes differentially expressed by γδ T cell clusters (T8, T13, and T16). (C) Overview of the design for mass cytometry (CyTOF) analysis of peripheral blood from healthy individuals (n= 5) and UC patients (n=5), with UMAP analysis of γδ T cells from all patients. (D) Gating strategy to identify CCR7highCD161lowNKG2Alow (“T8”), NKG2Ahigh (“T13”), and CCR7lowCD161high NKG2Alow (“T16”) clusters, with proportion of each cell cluster represented among all γδ T cells for each subject, calculated separately for healthy individuals vs. UC patients. Error bars indicate s.e.m. Unpaired Student’s t-test (D). * p < 0.05.
Fig. 6.
Fig. 6.. Clonally expanded cells from a CD8+ TRM cluster enriched in UC patients.
t-SNE plots of T cell clusters of healthy individuals (A) and UC patients (B), colored by cluster identity. For summary plots (left plots), red lines indicate TCR clonotypes shared among clusters and line weight represents number of shared clonotypes; three selected clonotypes from 3 representative healthy individuals (A, right 3 plots) or UC patients (B, right 3 plots) are shown as examples. (C) Comparison of clonotypic expansion exhibited by cells from CD8+ TRM cell clusters (T1, T2, T10, T14) from healthy individuals and UC patients. (D) Quantitation of clonally related T8 and T10 cells in healthy controls and UC patients, represented as proportion of clonally related T8 and T10 cells among all T8 and T10 cells in each individual. (E) Anatomic origin of clonally related blood T8 and rectal T10 cells. Each column represents a single clonotype and is colored based on anatomic location (rectum, blue; peripheral blood, red); numbers of clonally related cells derived from each location are indicated on the y axis. (F, G) Violin plots (F) and heatmap (G) of selected differentially expressed genes in clonally related and clonally unrelated T8 and T10 cells (peripheral blood, red; rectum, blue). Two-sided Wilcoxon rank sum test (D). ** p < 0.01.
Fig. 7.
Fig. 7.. Cells from a CD8+ TRM cell cluster with enhanced inflammatory properties are increased in affected colonic tissue from UC patients.
(A) Violin plots of selected genes differentially expressed by the four CD8+ TRM cell clusters (T1, T2, T10, T14). (B) Pathway analysis of genes differentially expressed by the T10 CD8+ TRM cluster compared to all other CD8+ TRM clusters. (C) Representative H&E-stained images of unaffected vs. affected colonic tissue from a UC patient used for RNA in situ hybridization (ISH) analyses shown in D, E. Representative ISH images of affected colonic tissue (D) and quantitation of CD8+CD69+EOMES+ cells from unaffected vs. affected regions of colonic tissue from UC patients (n=5) (E). Paired Student’s t-test (E). ** p < 0.01.
Fig. 8.
Fig. 8.. Eomes may regulate the T10 CD8+ TRM cluster transcriptional program.
(A) Percent weight change observed with CD8α depletion (n=5) vs. isotype control (n=5) in a piroxicam-induced IL-10-deficient mouse model, expressed as percent of weight at the start of the experiment. Error bars indicate s.e.m. Data are representative of 2 independent experiments. (B) Percent weight change observed in RAG1-deficient mice receiving 5×10⁵ FACS-sorted, GFP+ control-retrovirus (RV) (n = 13) or Eomes-RV (n= 8) CD8+ T cells and treated with DSS, expressed as percent of weight at the start of the experiment. Error bars indicate s.e.m. Data are representative of 2 independent experiments. (C) ATAC-seq tracks with putative Eomes motifs (indicated with red lines) near accessible promoter regions for selected genes are shown. P14 CD8+ T cells were adoptively transferred into congenic recipients subsequently infected with LCMV-Armstrong; cells were FACS-sorted at days 7 and 30 post-infection (2 technical replicates per time point) and subjected to ATAC-seq. Representative day 7 post-infection ATAC-seq tracks are shown. (D) P14 CD8+ T cells were transduced with control-RV (CD45.1) or Eomes-RV (CD45.1.2) constructs and adoptively transferred into congenic recipients (CD45.1.2) subsequently infected with LCMV-Armstrong (n=5). Expression of selected proteins by control-RV- vs. Eomes-RV-expressing CD8+ T cells was analyzed by FACS at 7 days after infection; staining of naïve CD8+ T cells from an uninfected mouse are shown as a control. Data are representative of 2 independent experiments. Unpaired Student’s t-test (A, B) or paired Student’s t-test (D). * p < 0.05, ** p < 0.01, *** p < 0.001.

References

    1. Khor B, Gardet A, Xavier RJ, Genetics and pathogenesis of inflammatory bowel disease. Nature 474, 307–317 (2011). - PMC - PubMed
    1. Abraham C, Cho JH, Inflammatory bowel disease. N Engl J Med 361, 2066–2078 (2009). - PMC - PubMed
    1. Kamada N, Hisamatsu T, Okamoto S, Chinen H, Kobayashi T, Sato T, Sakuraba A, Kitazume MT, Sugita A, Koganei K, Akagawa KS, Hibi T, Unique CD14 intestinal macrophages contribute to the pathogenesis of Crohn disease via IL-23/IFN-gamma axis. J Clin Invest 118, 2269–2280 (2008). - PMC - PubMed
    1. Na YR, Stakenborg M, Seok SH, Matteoli G, Macrophages in intestinal inflammation and resolution: a potential therapeutic target in IBD. Nature reviews. Gastroenterology & hepatology 16, 531–543 (2019). - PubMed
    1. Bal SM, Golebski K, Spits H, Plasticity of innate lymphoid cell subsets. Nature reviews. Immunology, (2020). - PubMed

Publication types

Substances