. 2020 Aug 21;5(50):eabd6832.
doi: 10.1126/sciimmunol.abd6832.

Natural killer cell immunotypes related to COVID-19 disease severity

Collaborators, Affiliations

Natural killer cell immunotypes related to COVID-19 disease severity

Christopher Maucourant et al. Sci Immunol. .

Abstract

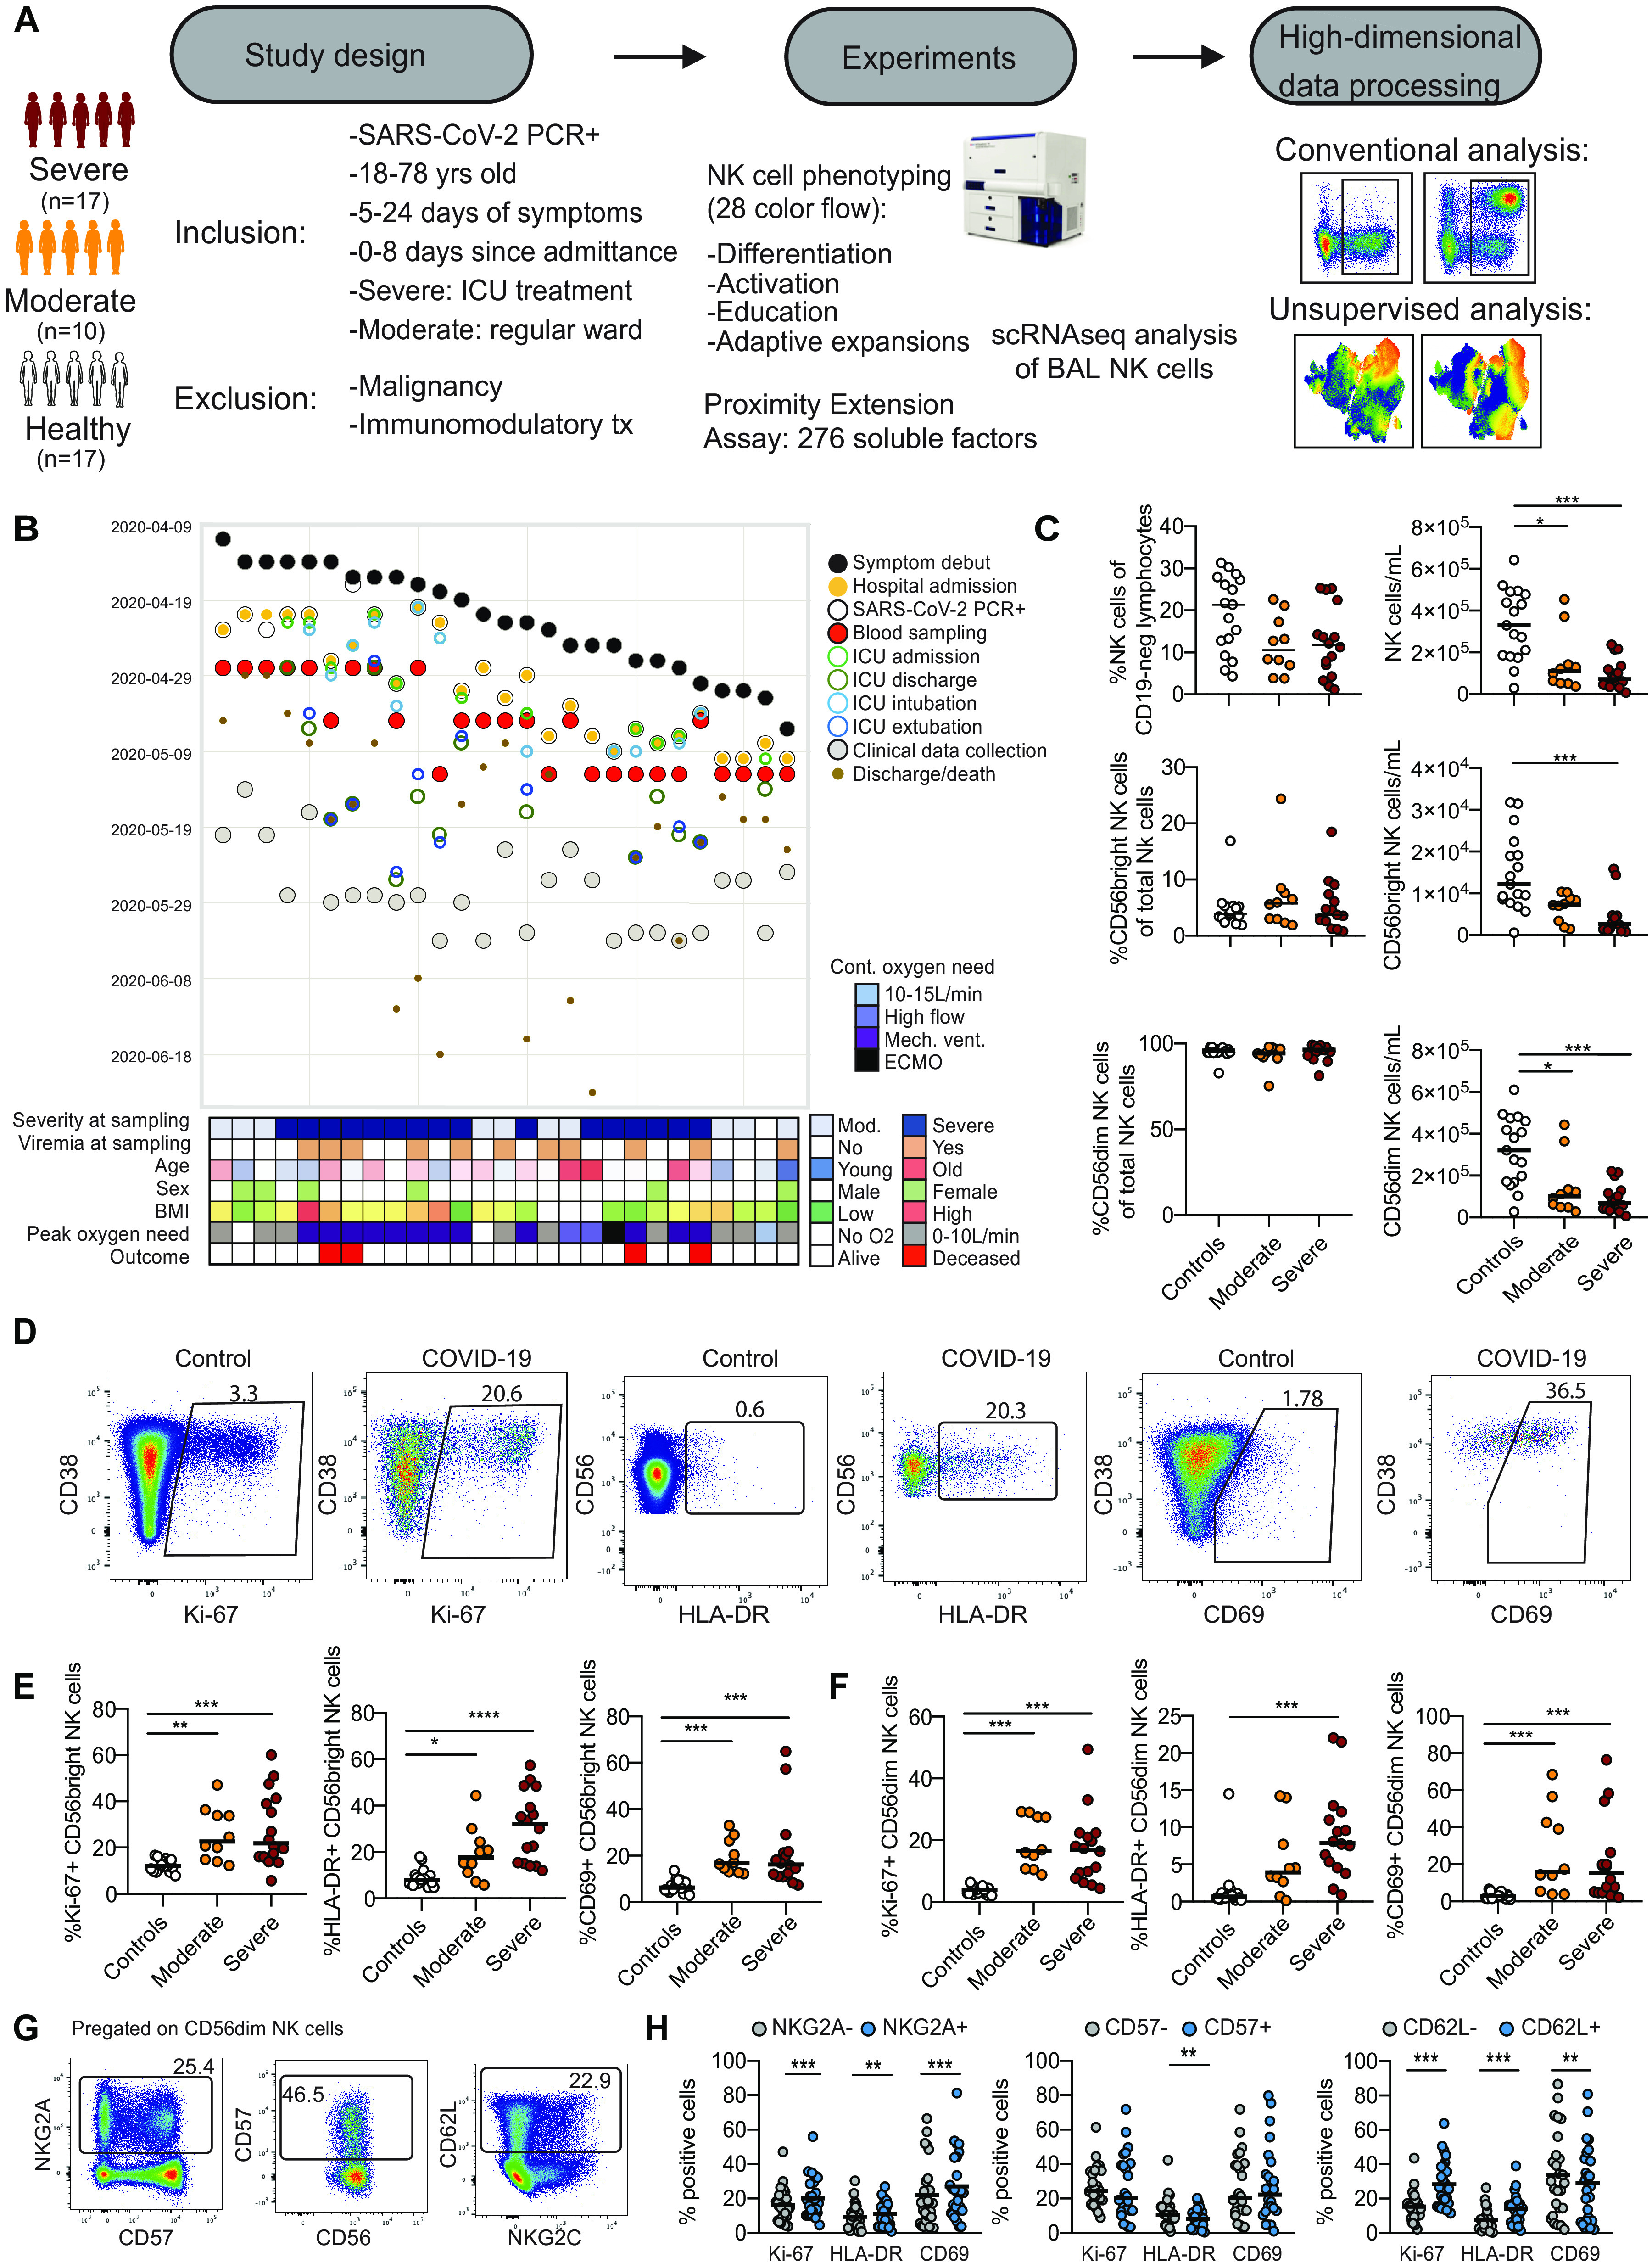
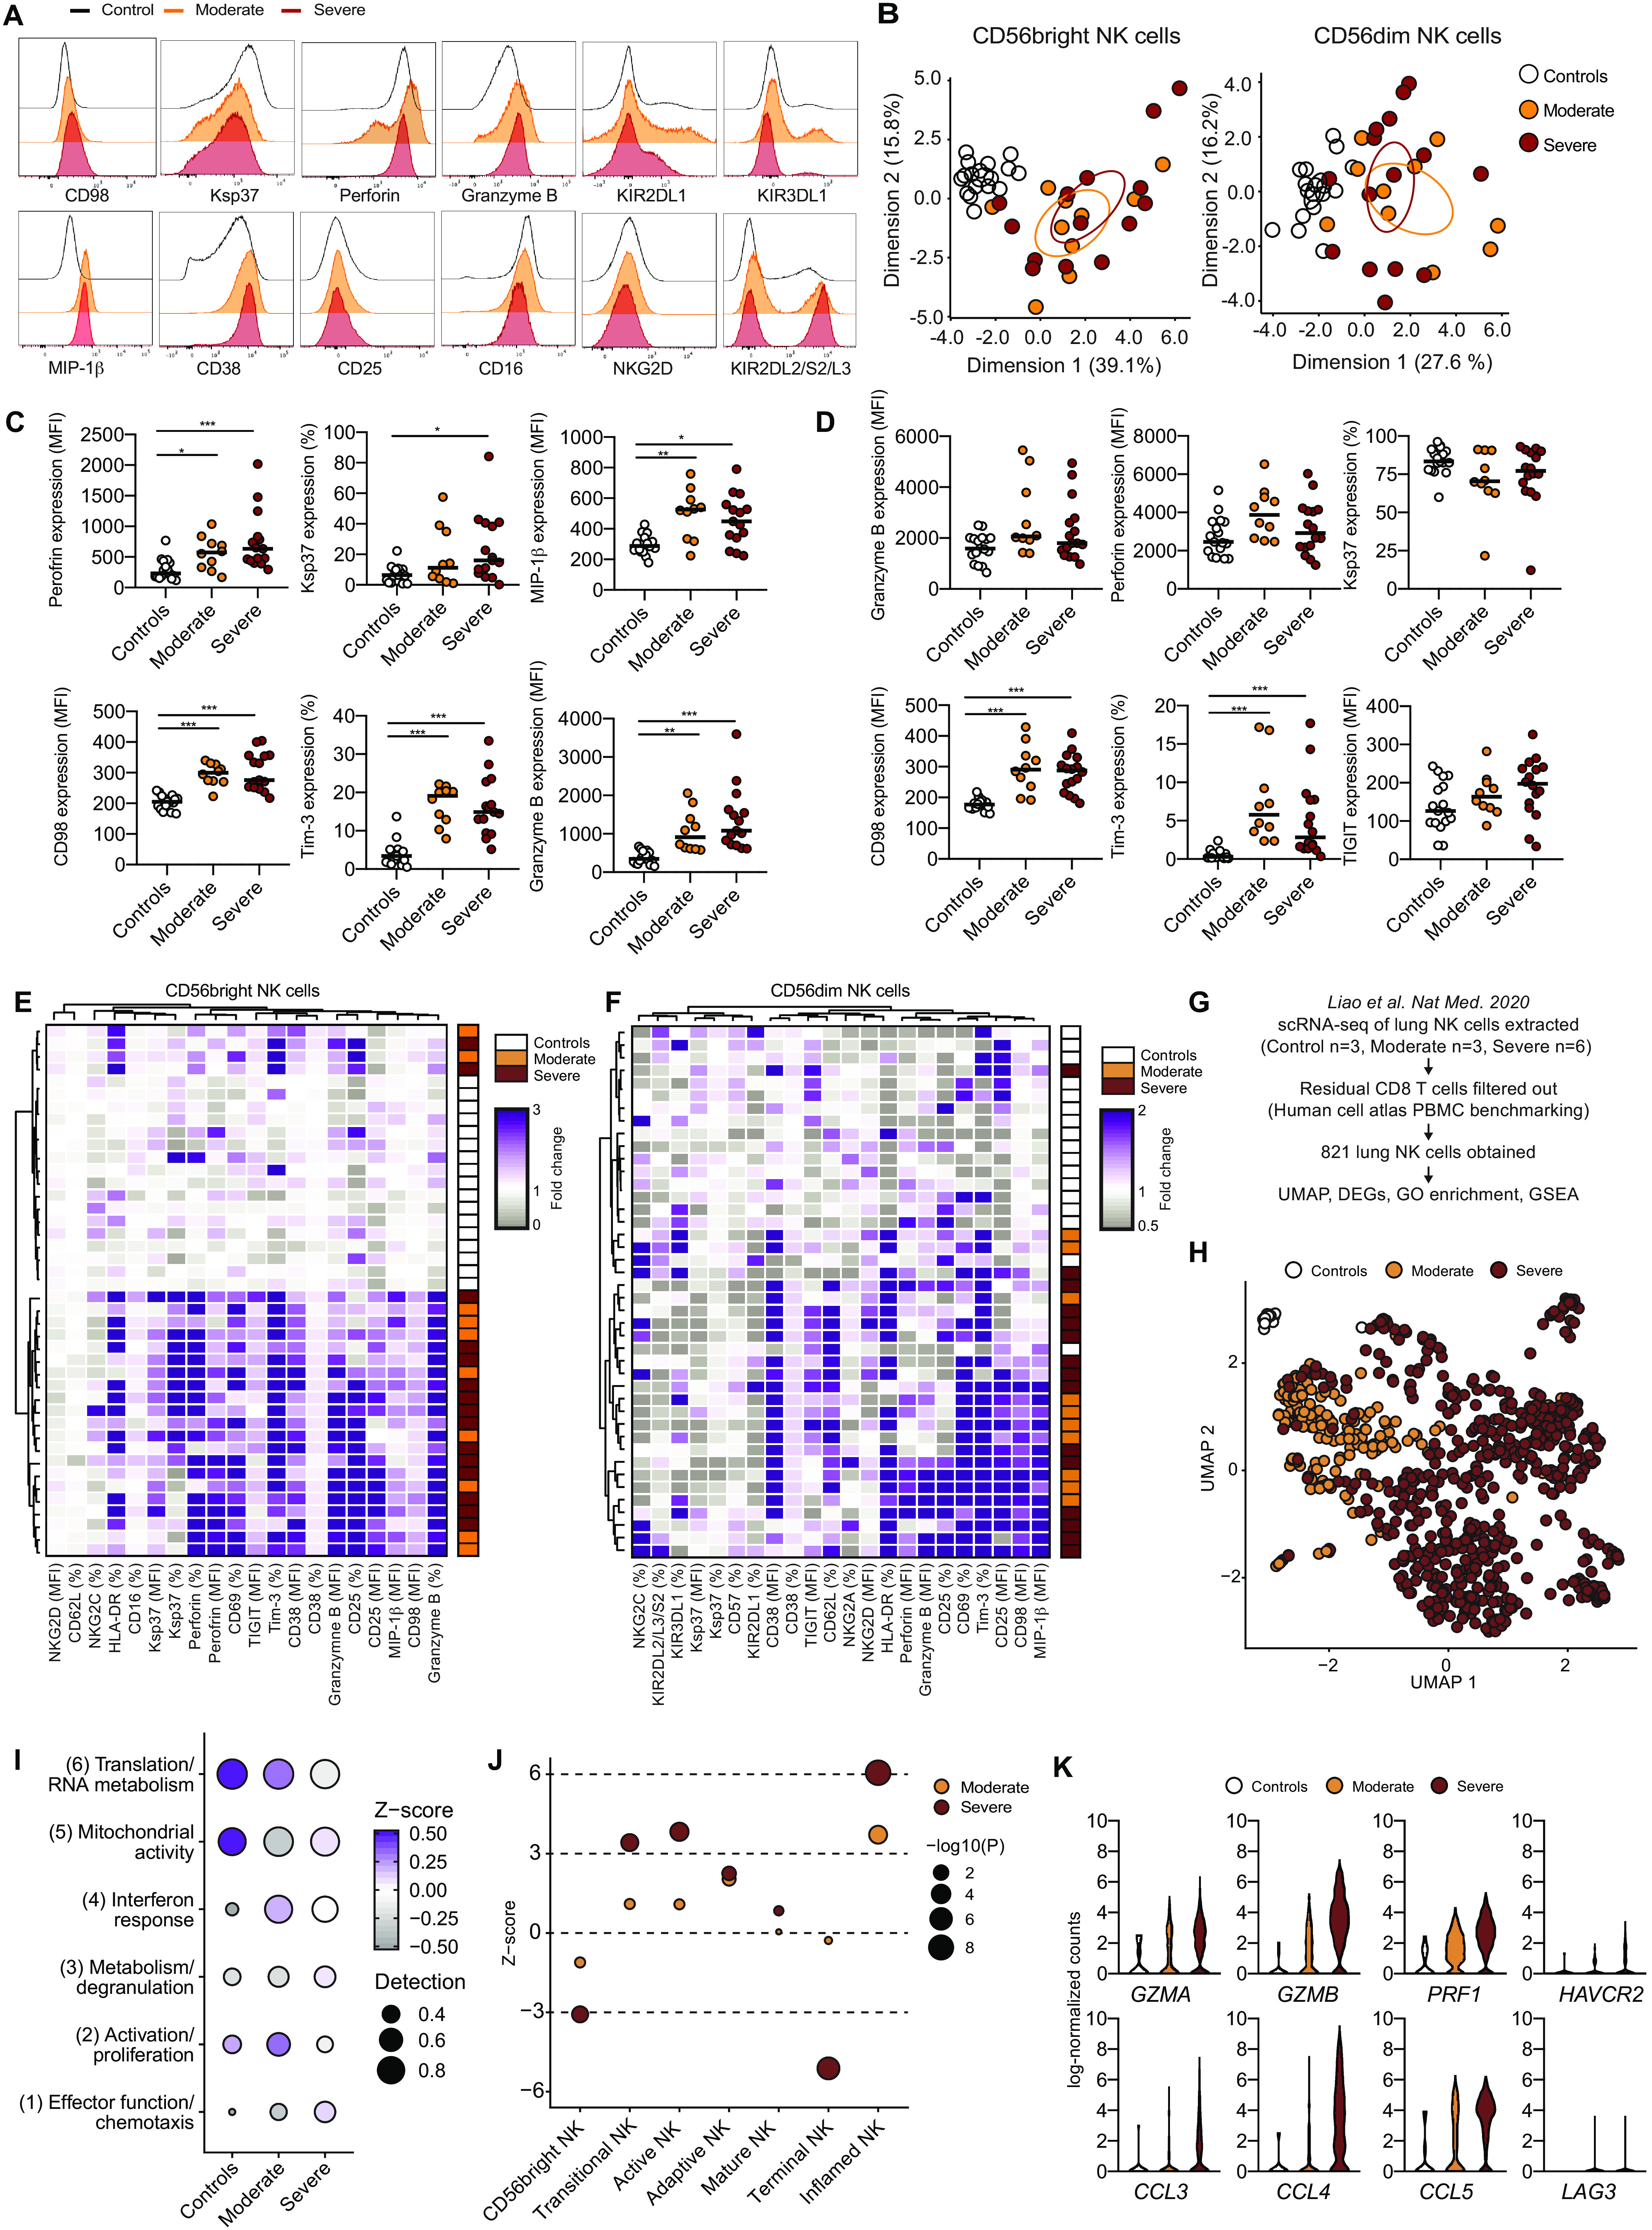
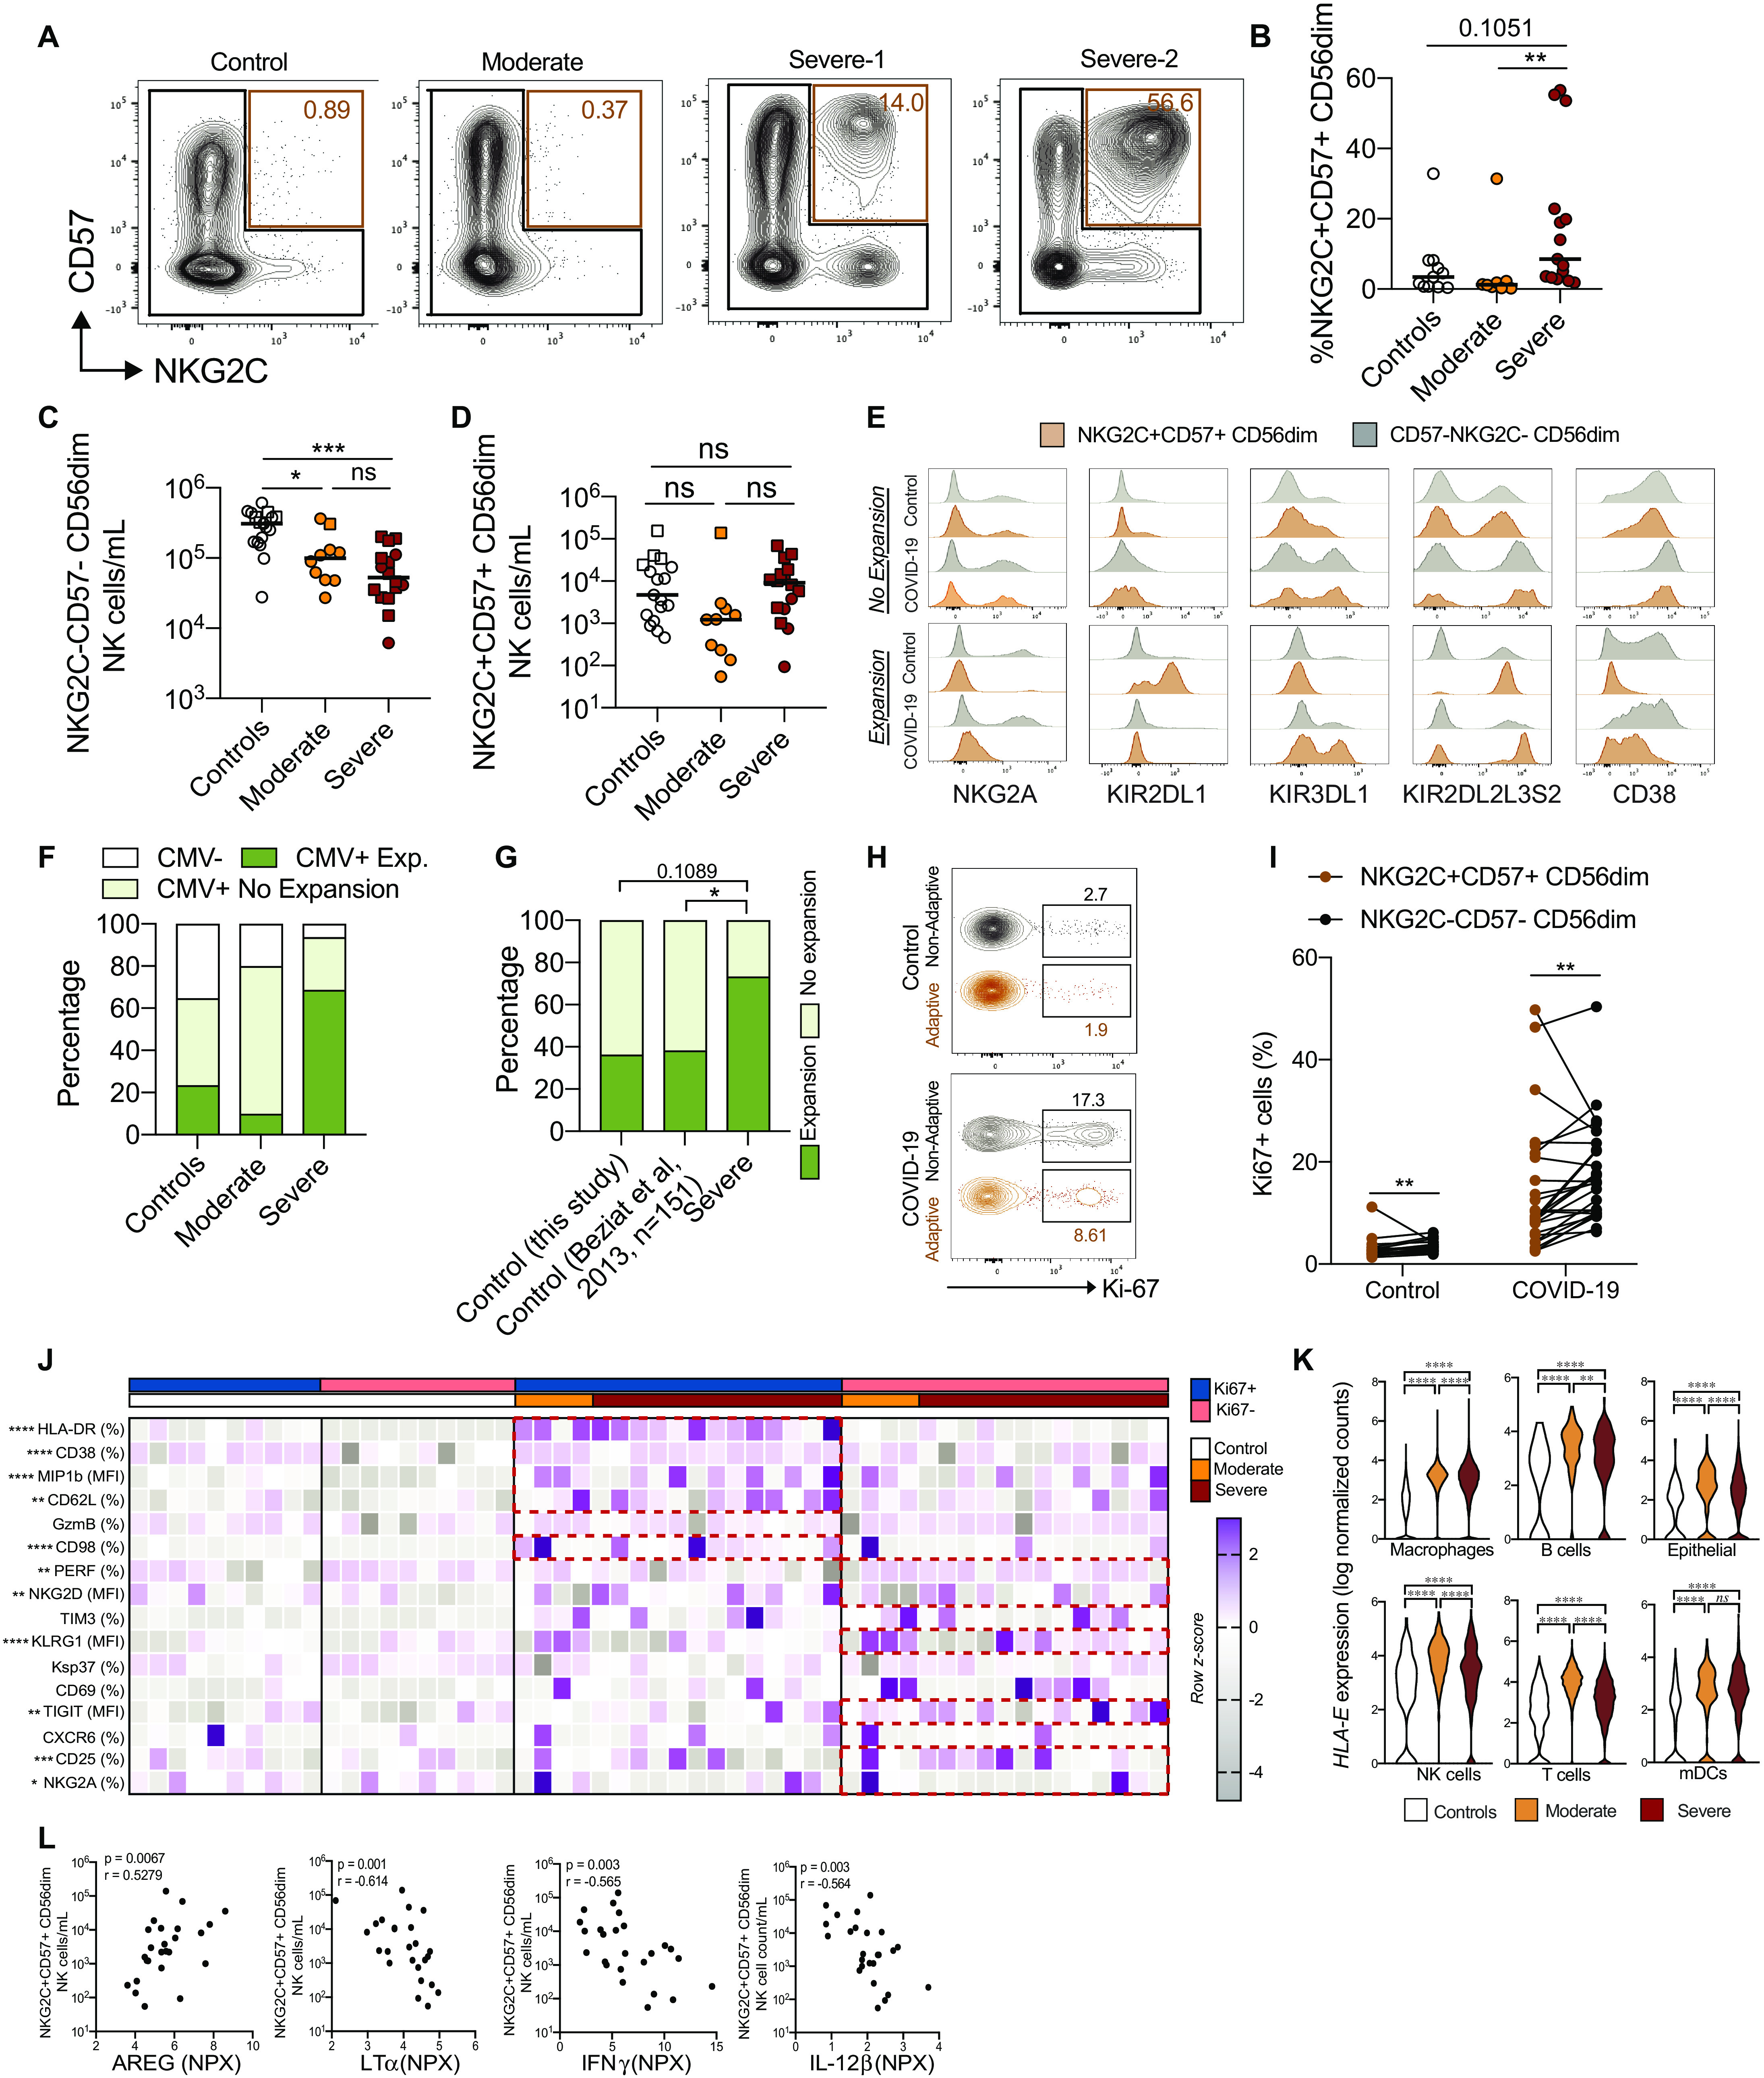
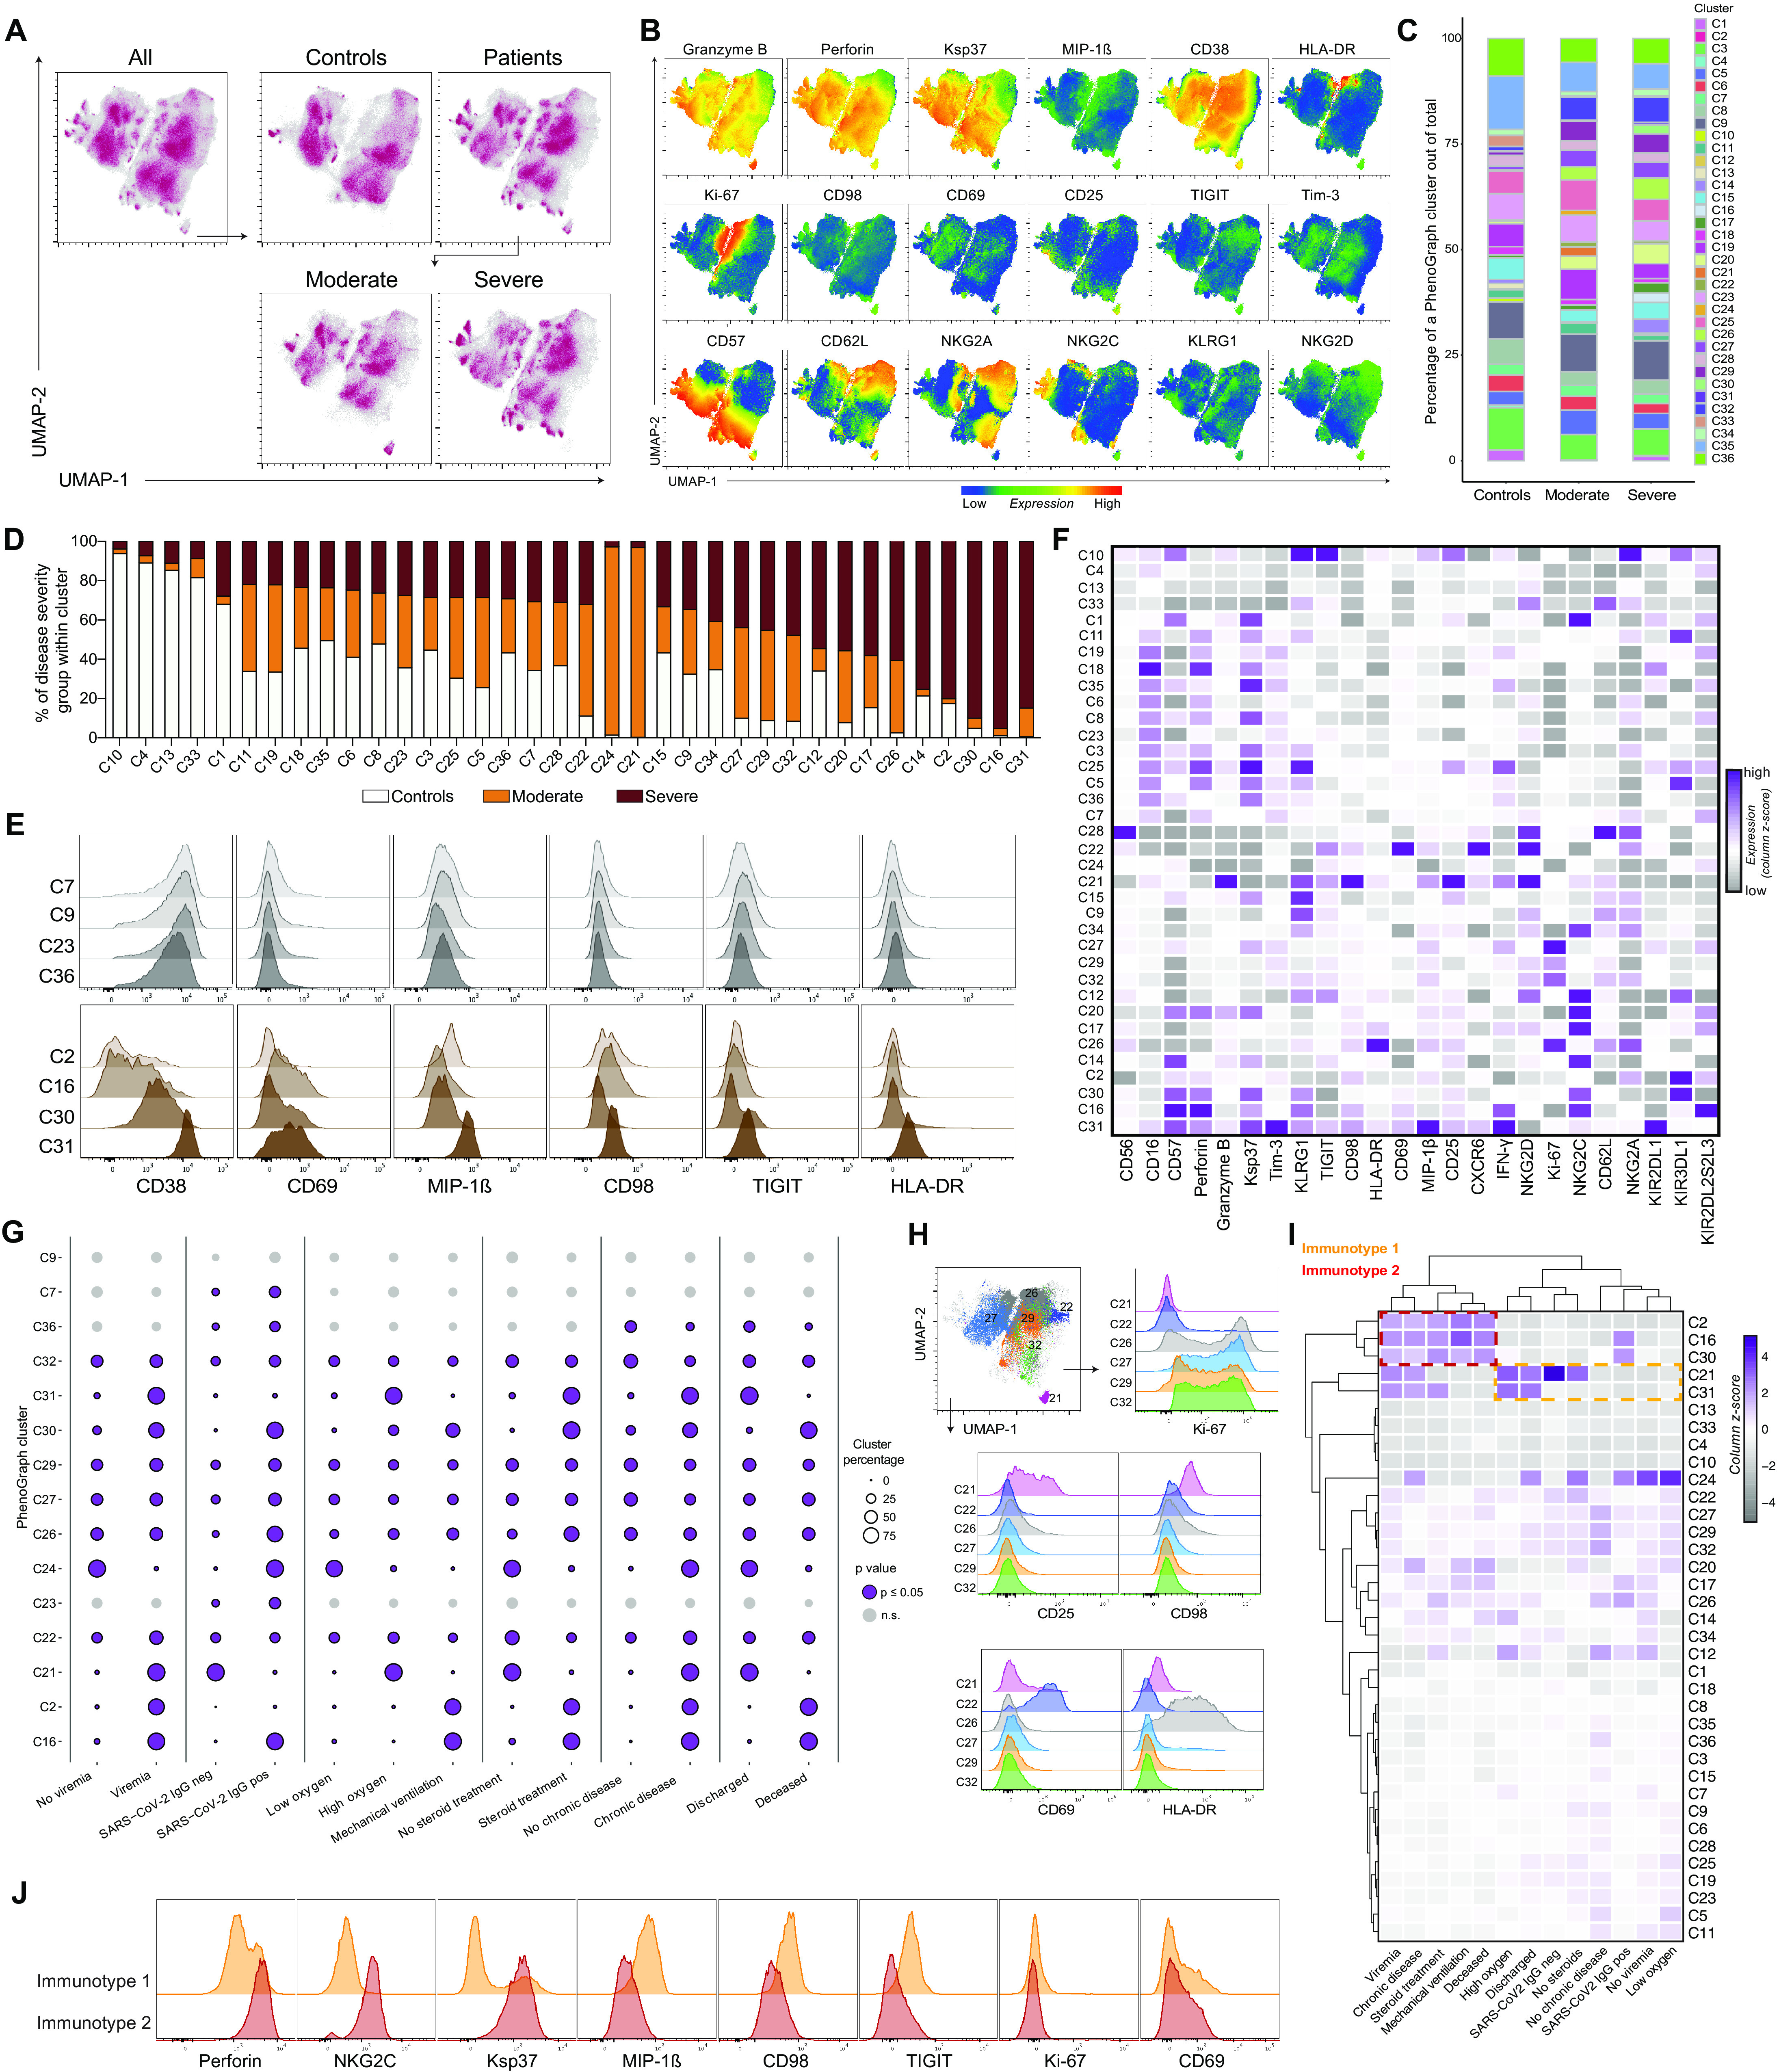
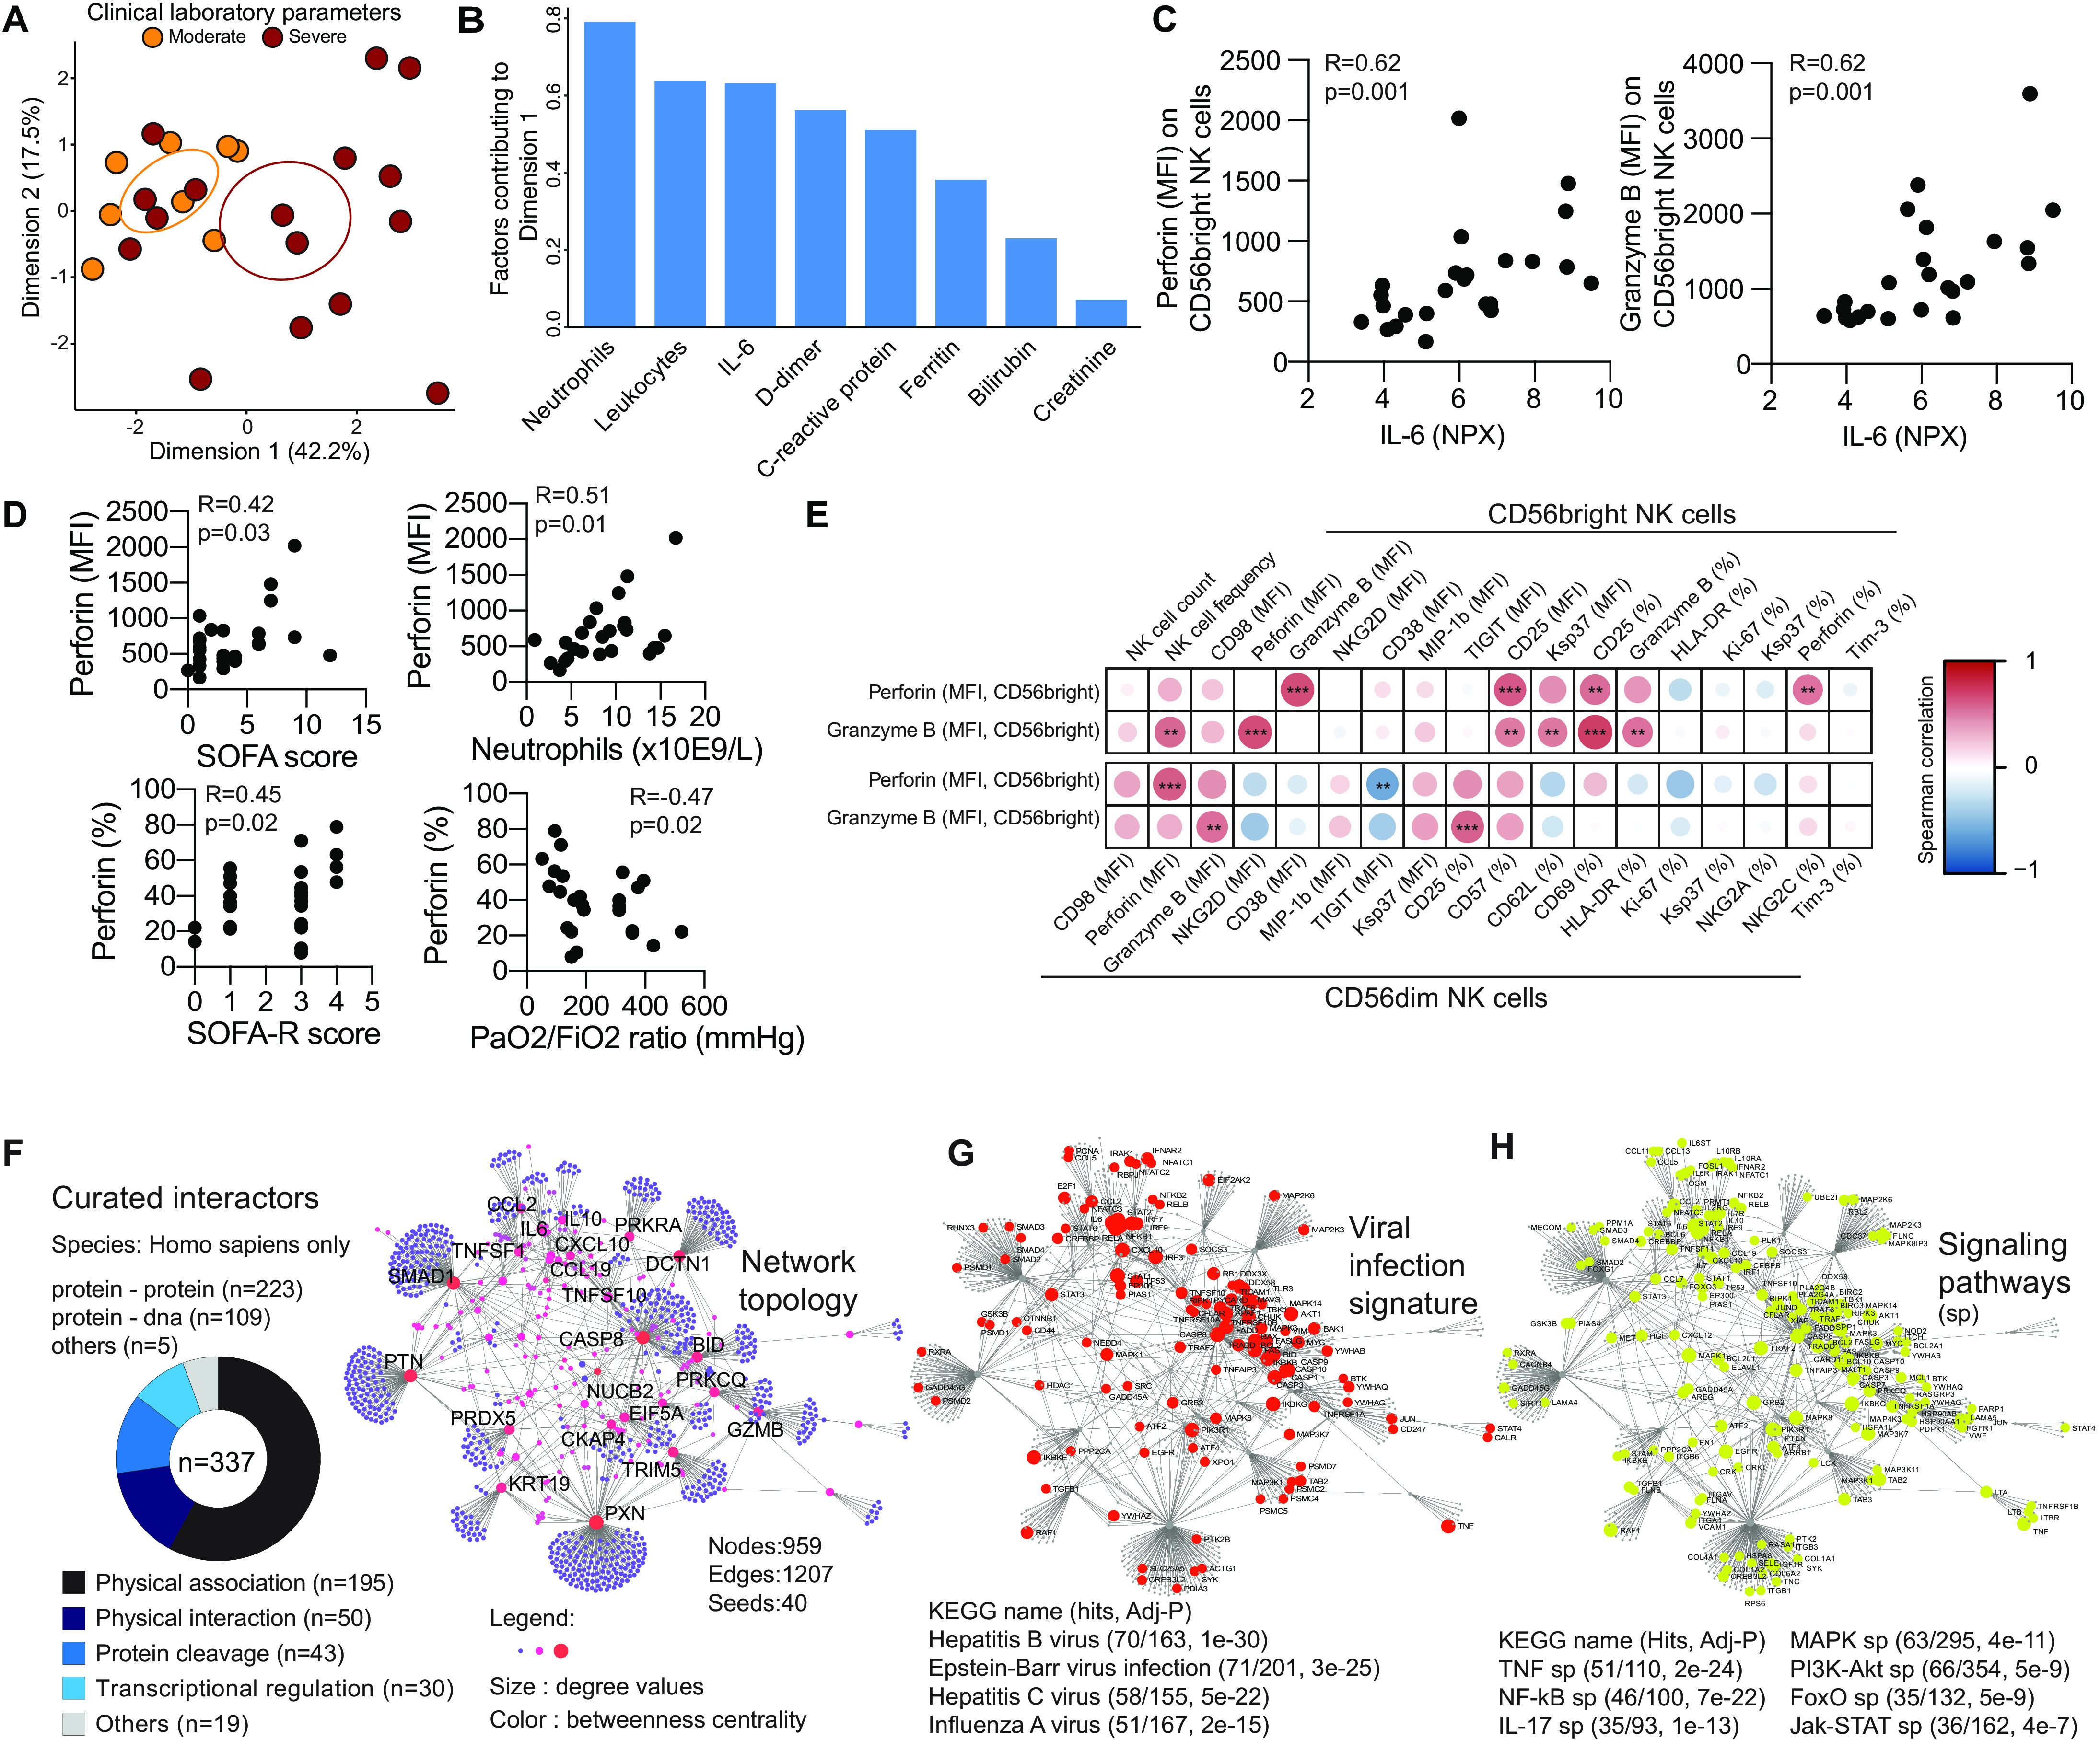
Understanding innate immune responses in COVID-19 is important to decipher mechanisms of host responses and interpret disease pathogenesis. Natural killer (NK) cells are innate effector lymphocytes that respond to acute viral infections but might also contribute to immunopathology. Using 28-color flow cytometry, we here reveal strong NK cell activation across distinct subsets in peripheral blood of COVID-19 patients. This pattern was mirrored in scRNA-seq signatures of NK cells in bronchoalveolar lavage from COVID-19 patients. Unsupervised high-dimensional analysis of peripheral blood NK cells furthermore identified distinct NK cell immunotypes that were linked to disease severity. Hallmarks of these immunotypes were high expression of perforin, NKG2C, and Ksp37, reflecting increased presence of adaptive NK cells in circulation of patients with severe disease. Finally, arming of CD56bright NK cells was observed across COVID-19 disease states, driven by a defined protein-protein interaction network of inflammatory soluble factors. This study provides a detailed map of the NK cell activation landscape in COVID-19 disease.


Figures

Fig. 1
Fig. 1. NK cells are robustly activated in moderate and severe COVID-19 disease.
(A) Schematic overview of study design, inclusion, and exclusion criteria. (B) Swimmer plot of symptom debut, hospital admission, and blood sampling in relation to other main clinical events and clinical characteristics. (C) Percentages and absolute counts of NK cells and NK cell subsets for healthy controls (n = 17), moderate COVID-19 patients (n = 10), and severe COVID-19 patients (n = 15 to 16). (D) Flow cytometry plots of Ki-67, HLA-DR, and CD69 expression on NK cells in one healthy control and one COVID-19 patient. (E and F) Summary data for expression of the indicated markers in (E) CD56bright and (F) CD56dim NK cells in healthy controls, moderate COVID-19 patients, and severe COVID-19 patients. (G) Flow cytometry plots of NKG2A, CD57, and CD62L expression on CD56dim NK cells. (H) Summary data for Ki-67, HLA-DR, and CD69 expression within NKG2A+/−, CD57+/−, or CD62L+/− CD56dim NK cells from all moderate and severe COVID-19 patients (n = 24 to 26). In (C) and (E), Kruskal-Wallis test and Dunn’s multiple comparisons test; in (H), Wilcoxon matched-pairs signed rank test. Numbers in flow cytometry plots indicate percentage, and bars represent median (*P < 0.05, **P < 0.01, and ***P < 0.001).
Fig. 2
Fig. 2. Detailed analysis of NK cell activation in COVID-19 disease.
(A) Expression of indicated proteins on CD56dim NK cells. (B) PCA of the protein expression phenotype of CD56bright and CD56dim NK cells in healthy controls, moderate COVID-19 patients, and severe COVID-19 patients. (C) Expression of indicated proteins on CD56bright NK cells in healthy controls (n = 17), moderate COVID-19 patients (n = 10), and severe COVID-19 patients (n = 15). All flow cytometry measurements, including cytokines (MIP-1β and IFN-γ), were performed directly ex vivo without further stimulation. (D) Expression of indicated proteins on CD56dim NK cells in healthy controls (n = 17), moderate COVID-19 patients (n = 10), and severe COVID-19 patients (n = 16). (E and F) Hierarchical clustering heatmaps showing expression of indicated proteins compared with median of healthy controls in (E) CD56bright and (F) CD56dim NK cells. (G) Strategy for scRNA-seq analysis of BAL NK cells from controls and COVID-19 patients. (H) UMAP of scRNA-seq data for BAL NK cells from the indicated groups. (I) Heatmap of indicated gene clusters after gene ontology (GO) enrichment analysis on DEGs. (J) Z scores of NK cell gene sets after gene set enrichment analysis (GSEA). (K) Violin plots of indicated DEGs. In (C) and (D), Kruskal-Wallis test and Dunn’s multiple comparisons test; bars represent median (*P < 0.05, **P < 0.01, and ***P < 0.001).
Fig. 3
Fig. 3. Increase in adaptive NK cells in severe COVID-19 disease.
(A) CD57 and NKG2C expression on CD56dim NK cells in indicated experimental groups. (B) Percentage of NKG2C+CD57+ cells in CMV-seropositive controls (n = 11), moderate COVID-19 patients (n = 8), and severe COVID-19 patients (n = 15). (C and D) Absolute counts of the indicated subsets in controls (n = 17), moderate COVID-19 patients (n = 10), and severe COVID-19 patients (n = 16). Squares and circles represent individuals with and without NK cell adaptive expansions, respectively. (E) Representative histograms of the indicated protein expression in NKG2C+CD57+ and NKG2CCD57 CD56dim NK cells. (F and G) Individuals from the indicated groups having or not having adaptive NK cell expansions. (H and I) Representative plots and summary data for Ki-67 expression in NKG2C+CD57+ and NKG2CCD57 CD56dim NK cells in controls (n = 17) and COVID-19 patients (n = 26). (J) Expression z score of indicated proteins in NKG2C+CD57+ NK cells from controls (n = 10) and COVID-19 patients (n = 17). Red boxes highlight the markers with significantly different expression in the Ki-67+ or Ki-67 fraction. (K) HLA-E expression from scRNA-seq data of the indicated cell types. (L) Spearman correlation between NKG2C+CD57+ CD56dim NK cell numbers and the indicated soluble factors in COVID-19 patients. In (B) to (D), Kruskal-Wallis test followed by Dunn’s multiple comparisons test; in (F) and (G), Fisher’s exact test; in (I) to (J), Wilcoxon matched-pairs signed rank test; in (K), pairwise comparisons (see Materials and Methods). Bars represent median (*P < 0.05, **P < 0.01, ***P < 0.001, and ****P < 0.0001). ns, not significant.
Fig. 4
Fig. 4. Automated analysis of NK cells in COVID-19 identifies putative NK immunotypes differentially enriched in two main groups of patients.
(A) UMAP of all events, of controls and patients, and of patients split into moderate and severe. (B) Representative expression of phenotypic markers on all cells in the UMAP. (C) Percentage of 36 PhenoGraph clusters within total cells of indicated groups. (D) Relative abundance of control, moderate, and severe groups within each PhenoGraph cluster. (E) Expression of selected markers from representative PhenoGraph clusters that did not display significant differential relative abundance between healthy, moderate, and severe groups (top) and significant clusters that were most highly abundant in severe COVID-19 patients (bottom). (F) Expression of phenotypic markers across PhenoGraph clusters (as column z score of median expression values). (G) Percentage of NK cell clusters from COVID-19 patients stratified according to the indicated clinical categorical parameters. Purple circles with a border indicate significant PhenoGraph clusters in a particular comparison (P ≤ 0.05), and light gray circles without a border indicate nonsignificant clusters (Materials and Methods and table S8). Vertical lines indicate separate comparisons. (H) Selected PhenoGraph clusters overlaid on the UMAP and representative flow cytometry histograms showing expression of the indicated markers within the clusters. (I) Hierarchical clustering of PhenoGraph clusters and clinical categorical parameters. The heatmap was calculated as column z score of cluster percentages. Putative NK immunotypes are indicated. (J) Expression of separating and nonseparating markers within the NK cell immunotype 1 and 2 clusters.
Fig. 5
Fig. 5. Arming of CD56bright NK cells associate with COVID-19 disease severity.
(A) PCA of COVID-19 patients based on clinical laboratory parameters. (B) Bar plot showing the clinical laboratory parameters contributing to dimension 1 (dim 1) in (A). (C) Spearman correlations between the indicated CD56bright NK cell phenotypic parameters in COVID-19 patients and serum IL-6 levels (n = 24). (D) Spearman correlations between the indicated CD56bright NK cell phenotypic parameters and clinical parameters (n = 25). (E) Correlation matrix showing Spearman correlations between perforin and granzyme expression (MFI) on CD56bright NK cells and the indicated other NK cell phenotypic parameters (n = 25). Color indicates R value, and asterisks indicate P values. (F) Topology and content of the protein-protein interaction network driven by soluble factors (seeds) correlated with perforin and granzyme B expression in CD56bright NK cells. Superimposition of nodes involved in (G) viral infection and (H) signaling pathways on the identified protein-protein interaction network.

References

    1. Guan W.-J., Ni Z.-Y., Hu Y., Liang W.-H., Ou C.-Q., He J.-X., Liu L., Shan H., Lei C.-L., Hui D. S. C., Du B., Li L.-J., Zeng G., Yuen K.-Y., Chen R.-C., Tang C.-L., Wang T., Chen P.-Y., Xiang J., Li S.-Y., Wang J.-L., Liang Z.-J., Peng Y.-X., Wei L., Liu Y., Hu Y.-H., Peng P., Wang J.-M., Liu J.-Y., Chen Z., Li G., Zheng Z.-J., Qiu S.-Q., Luo J., Ye C.-J., Zhu S.-Y., Zhong N.-S.; China Medical Treatment Expert Group for Covid-19 , Clinical characteristics of coronavirus disease 2019 in China. N. Engl. J. Med. 382, 1708–1720 (2020). - PMC - PubMed
    1. Huang C., Wang Y., Li X., Ren L., Zhao J., Hu Y., Zhang L., Fan G., Xu J., Gu X., Cheng Z., Yu T., Xia J., Wei Y., Wu W., Xie X., Yin W., Li H., Liu M., Xiao Y., Gao H., Guo L., Xie J., Wang G., Jiang R., Gao Z., Jin Q., Wang J., Cao B., Clinical features of patients infected with 2019 novel coronavirus in Wuhan, China. Lancet 395, 497–506 (2020). - PMC - PubMed
    1. Mehta P., McAuley D. F., Brown M., Sanchez E., Tattersall R. S., Manson J. J.; HLH Across Speciality Collaboration, UK , COVID-19: Consider cytokine storm syndromes and immunosuppression. Lancet 395, 1033–1034 (2020). - PMC - PubMed
    1. Giamarellos-Bourboulis E. J., Netea M. G., Rovina N., Akinosoglou K., Antoniadou A., Antonakos N., Damoraki G., Gkavogianni T., Adami M.-E., Katsaounou P., Ntaganou M., Kyriakopoulou M., Dimopoulos G., Koutsodimitropoulos I., Velissaris D., Koufargyris P., Karageorgos A., Katrini K., Lekakis V., Lupse M., Kotsaki A., Renieris G., Theodoulou D., Panou V., Koukaki E., Koulouris N., Gogos C., Koutsoukou A., Complex immune dysregulation in COVID-19 patients with severe respiratory failure. Cell Host Microbe 27, 992–1000.e3 (2020). - PMC - PubMed
    1. Chen G., Wu D., Guo W., Cao Y., Huang D., Wang H., Wang T., Zhang X., Chen H., Yu H., Zhang X., Zhang M., Wu S., Song J., Chen T., Han M., Li S., Luo X., Zhao J., Ning Q., Clinical and immunological features of severe and moderate coronavirus disease 2019. J. Clin. Invest. 130, 2620–2629 (2020). - PMC - PubMed

MeSH terms

LinkOut - more resources