. 2020 Aug 9;11(8):671.
doi: 10.1038/s41419-020-02836-9.

Dual effects of thyroid hormone on neurons and neurogenesis in traumatic brain injury

Affiliations

Dual effects of thyroid hormone on neurons and neurogenesis in traumatic brain injury

Chao Lin et al. Cell Death Dis. .

Abstract

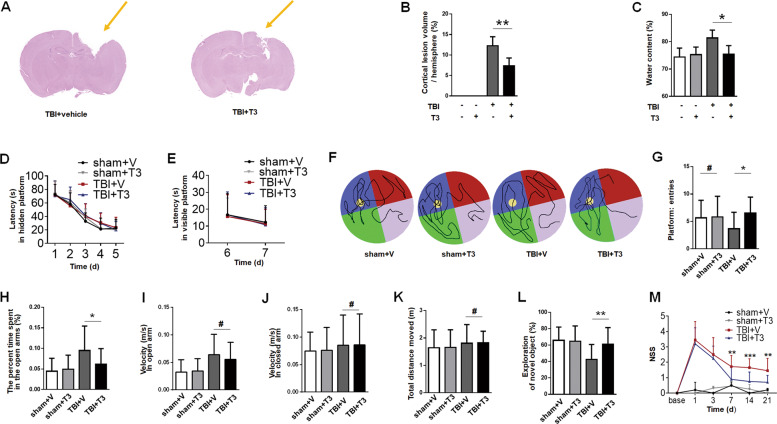
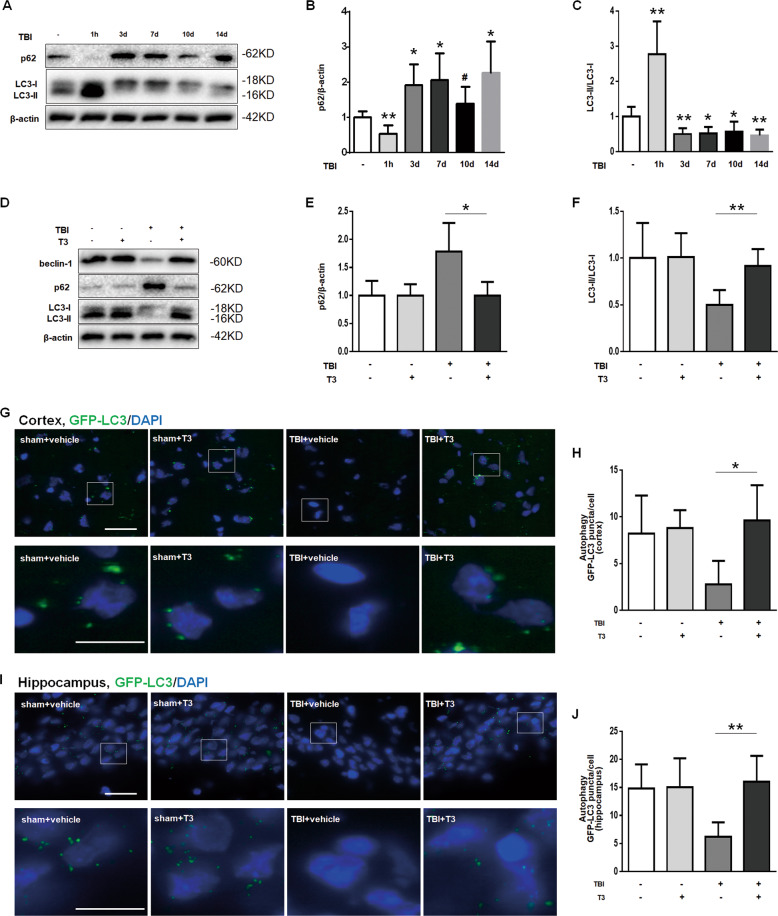
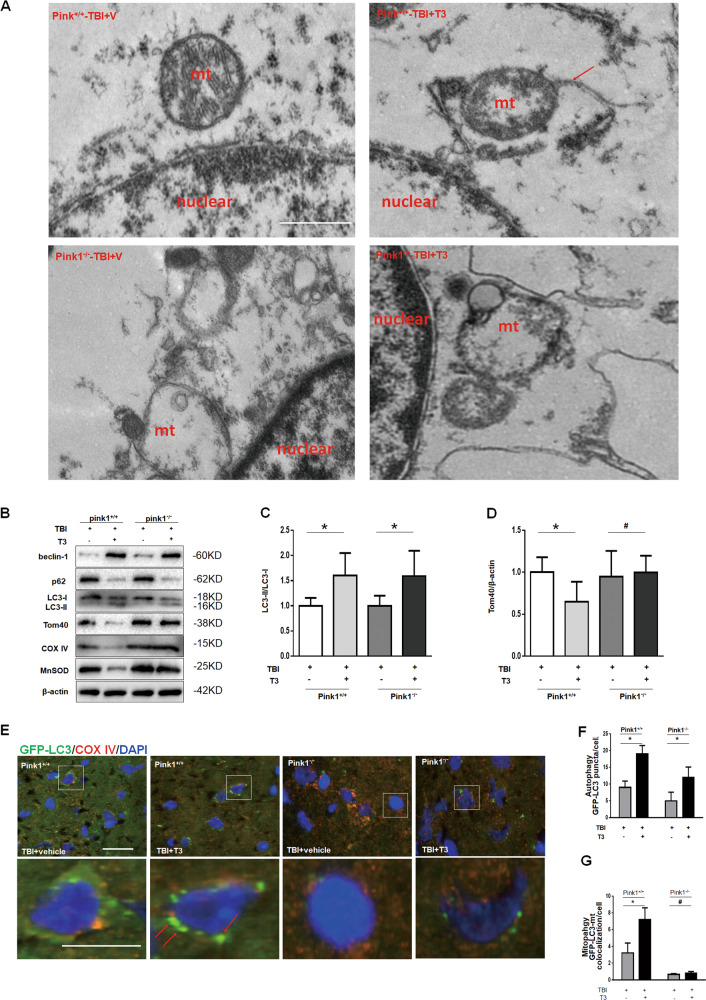
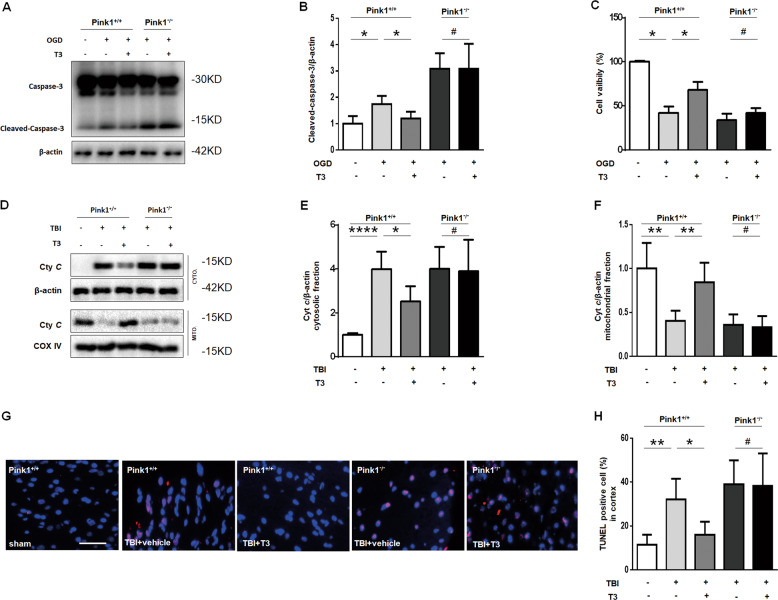
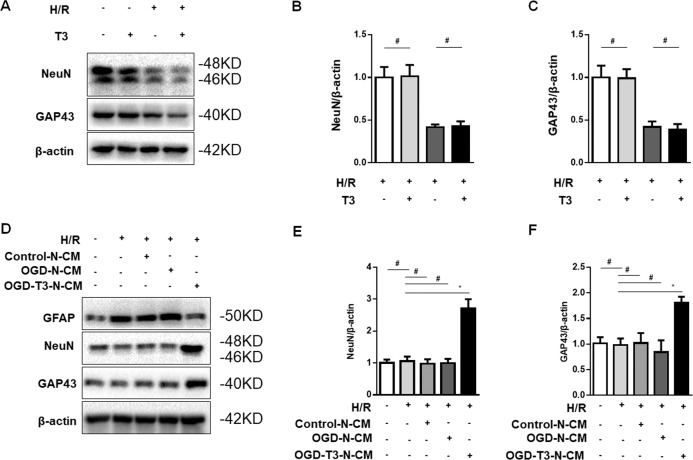
Thyroid hormone (TH) plays a crucial role in neurodevelopment, but its function and specific mechanisms remain unclear after traumatic brain injury (TBI). Here we found that treatment with triiodothyronine (T3) ameliorated the progression of neurological deficits in mice subjected to TBI. The data showed that T3 reduced neural death and promoted the elimination of damaged mitochondria via mitophagy. However, T3 did not prevent TBI-induced cell death in phosphatase and tensin homolog (PTEN)-induced putative kinase 1 (Pink1) knockout mice suggesting the involvement of mitophagy. Moreover, we also found that T3 promoted neurogenesis via crosstalk between mature neurons and neural stem cells (NSCs) after TBI. In neuron cultures undergoing oxygen and glucose deprivation (OGD), conditioned neuron culture medium collected after T3 treatment enhanced the in vitro differentiation of NSCs into mature neurons, a process in which mitophagy was required. Taken together, these data suggested that T3 treatment could provide a therapeutic approach for TBI by preventing neuronal death via mitophagy and promoting neurogenesis via neuron-NSC crosstalk.


Conflict of interest statement

The authors declare that they have no conflict of interest.

Figures

Fig. 1
Fig. 1. T3 treatment rescued histological and functional deficits after TBI.
a, b Representative images (a, arrow) and quantification (b) of cortical lesion volume (n = 5, **P < 0.01). c Analysis of water content (n = 5, *P < 0.05). dg Morris water maze (MWM). Graph showing hidden platform trial (d) and visible platform trials (e). Representative images (f) and quantification of probe tests (g, #P > 0.05, *P < 0.05). hk Elevated plus maze. In the open arm, T3-treated TBI mice had similar performance to sham in the present time (h), but vehicle-treated TBI mice spent more time (h, *P < 0.05). i Velocity in the open arm (#P > 0.05). j, k All groups had similar velocity in the closed arm (j, #P > 0.05) and traveled similar total distance (k, #P > 0.05). l Novel object recognition (NOR, **P < 0.01). m Neurological severity score (NSS, **P < 0.01, ***P < 0.001 between T3- and vehicle-treated TBI mice). Sham mice, n = 20; T3-treated sham mice, n = 20; vehicle-treated TBI mice, n = 20; T3-treated TBI mice, n = 22. All data are mean ± SD. V vehicle.
Fig. 2
Fig. 2. T3 treatment promoted mitophagy after TBI.
ac Western blot analysis of autophagy after TBI. β-Actin was used as a loading control (*P < 0.05, **P < 0.01, #P > 0.05 versus sham). df T3 restored the activity of autophagy after TBI (*P < 0.05, **P < 0.01). In af, β-actin was used as loading control and protein was obtained from cortical injured lesion. g Representative fluorescence micrographs of mouse cortex. Scale bar: up 50 µm, down 20 µm. h Quantifications of LC3 puncta in the mouse cortex, as an indicator of autophagosome (*P < 0.05). i Representative fluorescence micrographs of the mouse hippocampus. Scale bar: up 50 µm, down 20 µm. j Quantifications of LC3 puncta in the mouse hippocampus, as an indicator of autophagosome (**P < 0.01).
Fig. 3
Fig. 3. T3 treatment promoted mitophagy via Pink1 pathway.
a Representative electron micrographs of the mouse cortex. Mitochondrion was engulfed by vacuolar structures (arrow). Mt mitochondrion. Scale bar, 1 µm. bd T3 decreased of the mitochondrial markers of TOM40, MnSOD, and COXIV in Pink1+/+ mice but not in Pink1−/− mice (*P < 0.05, #P > 0.05). eg T3 increased co-localization of GFP-LC3 and mitochondria (arrows) versus control in Pink1+/+ mice after TBI but not in Pink1−/− mice (Scale bar, 20 µm. *P < 0.05, #P > 0.05).
Fig. 4
Fig. 4. T3 treatment attenuated mitochondrial dysfunction after TBI.
a Seahorse analysis of OCR for neurons subjected to hypoxia and then treated with or without 10 nM T3 for 24 h. b A graph showing basal and maximal OCR (*P < 0.05, **P < 0.01). c Representative images of DHE staining on the cortex (up) and hippocampus (down), Scale bar, 100 µm. d Quantifications of DHE fluorescence intensity on the cortex (*P < 0.05, #P > 0.05). e Quantifications of DHE fluorescence intensity on the hippocampus (*P < 0.05, #P > 0.05).
Fig. 5
Fig. 5. T3 treatment reduced cell death after TBI.
a Representative western blot analysis for the expression of caspase-3 and cleaved-caspase-3 in cortical neuronal cultures that were treated as indicated. β-Actin was used as a loading control. b Densitometry of cleaved-caspase-3 (*P < 0.05, #P > 0.05). c Pericyte viability, as determined by the Cell Counting Kit (CCK)-8, in cortical neuronal cultures that were treated as indicated (*P < 0.05, #P > 0.05). d Representative western blot analysis of cytochrome c (cyt c) in the injured cortex. e Densitometry of cyt c in cytosolic fraction (*P < 0.05, ****P < 0.0001, #P > 0.05). f Densitometry of cyt c in mitochondrial fraction (**P < 0.01, #P > 0.05). g, h Representative fluorescence micrographs of the mouse cortex after TBI. Apoptotic cell death was assessed by TUNEL staining (scale bar, 50 µm. *P < 0.05, **P < 0.01, #P > 0.05). In dh, samples were obtained from the cortical injured lesion on day 14 after brain injury.
Fig. 6
Fig. 6. T3 treatment promoted neurogenesis after TBI.
a Representative images of BrdU+NeuN+ double-positive cells in subventricular zone (scale bar, 50 µm). b Quantification of double-positive cells in subventricular zone (**P < 0.01, #P > 0.05). c Representative images of BrdU+NeuN+ double-positive cells in the hippocampus (scale bar, 50 µm). d Quantification of double-positive cells in the hippocampus (*P < 0.05, #P > 0.05).
Fig. 7
Fig. 7. T3 treatment promoted neurogenesis via crosstalk between mature neuron and NSCs.
ac Representative western blot and quantification of NeuN (b, #P > 0.05) and growth-associated protein 43 (GAP43; c, #P > 0.05) expression in NSC cultures that were treated with T3 or vehicle for 3 days in a reoxygenation state after 8 h of hypoxia (H/R). df Representative western blot and quantification of the indicated proteins in NSC cultures that were subjected to H/R and treated with mature neuron conditioned medium from the experimental treatment groups. e Quantification of NEUN (*P < 0.05, #P > 0.05). f Quantification of GAP43 (*P < 0.05, #P > 0.05).
Fig. 8
Fig. 8. Mitophagy was essential for T3-mediated neurogenesis.
ac Representative western blot and quantification of NeuN and GAP43 in NSC cultures isolated from Pink1+/+ or Pink1−/− mice. b Quantification of NeuN (**P < 0.01, #P > 0.05). c Quantification of GAP43 (*P < 0.05, #P > 0.05). df Representative western blot analysis of NeuN and GAP43 in NSC cultures treated by different conditioned mediums. e Quantification of NeuN (*P < 0.05, #P > 0.05). f Quantification of GAP43 (**P < 0.01, #P > 0.05). g Novel object recognition (NOR, #P > 0.05). h Neurological severity score (NSS, #P > 0.05 versus vehicle-treated TBI mice). Sham mice, n = 15; T3-treated sham mice, n = 15; vehicle-treated TBI mice, n = 15; T3-treated TBI mice, n = 15.

References

    1. Werner C, Engelhard K. Pathophysiology of traumatic brain injury. Br. J. Anaesth. 2007;99:4–9. doi: 10.1093/bja/aem131. - DOI - PubMed
    1. Corrigan JD, Selassie AW, Orman JA. The epidemiology of traumatic brain injury. J. Head Trauma Rehabil. 2010;25:72–80. doi: 10.1097/HTR.0b013e3181ccc8b4. - DOI - PubMed
    1. Ji J, et al. Lipidomics identifies cardiolipin oxidation as a mitochondrial target for redox therapy of brain injury. Nat. Neurosci. 2012;15:1407–1413. doi: 10.1038/nn.3195. - DOI - PMC - PubMed
    1. Lin C, Dong Y, Lv L, Yu M, Hou L. Clinical features and functional recovery of traumatic isolated oculomotor nerve palsy in mild head injury with sphenoid fracture. J. Neurosurg. 2013;118:364–369. doi: 10.3171/2012.9.JNS12702. - DOI - PubMed
    1. Lozano D, et al. Neuroinflammatory responses to traumatic brain injury: etiology, clinical consequences, and therapeutic opportunities. Neuropsychiatr. Dis. Treat. 2015;11:97–106. - PMC - PubMed

Publication types

MeSH terms