. 2020 Aug 21;11(1):4205.
doi: 10.1038/s41467-020-18020-8.

GLUT1 inhibition blocks growth of RB1-positive triple negative breast cancer

Affiliations

GLUT1 inhibition blocks growth of RB1-positive triple negative breast cancer

Qin Wu et al. Nat Commun. .

Abstract

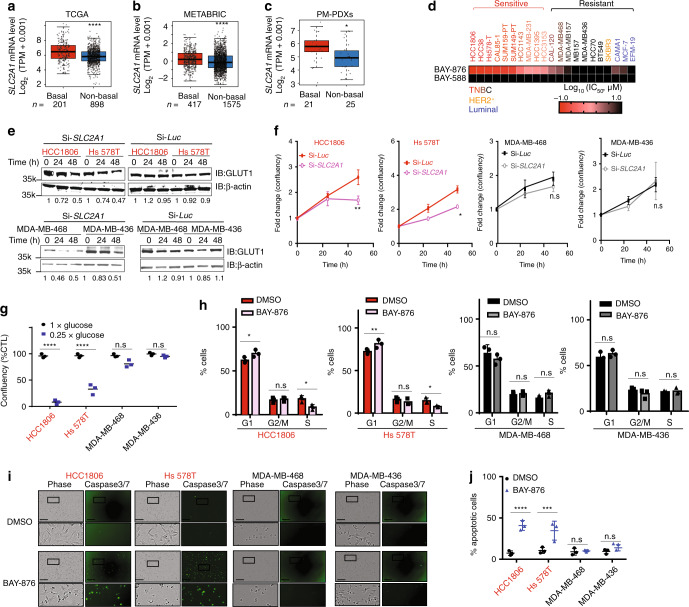
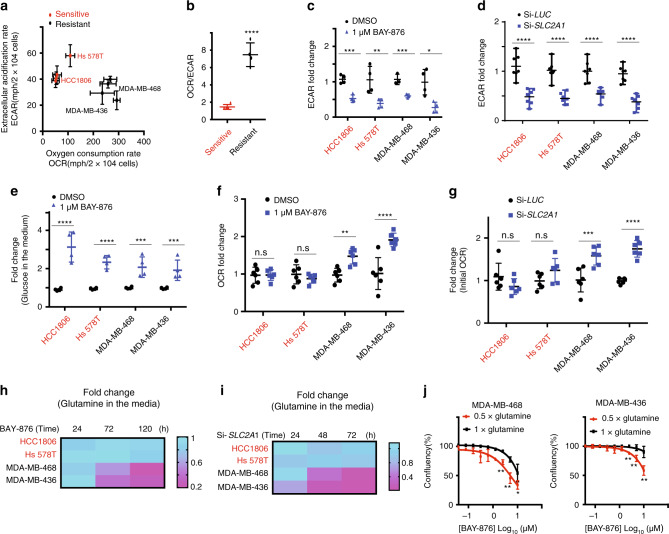
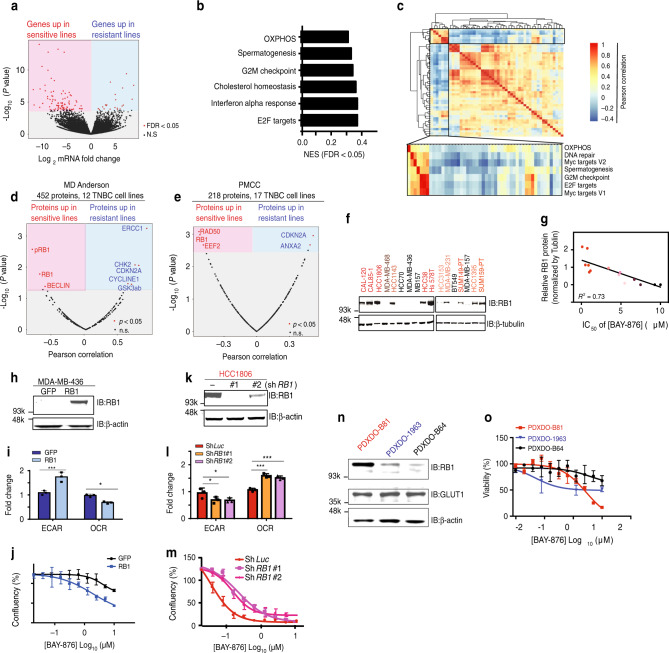
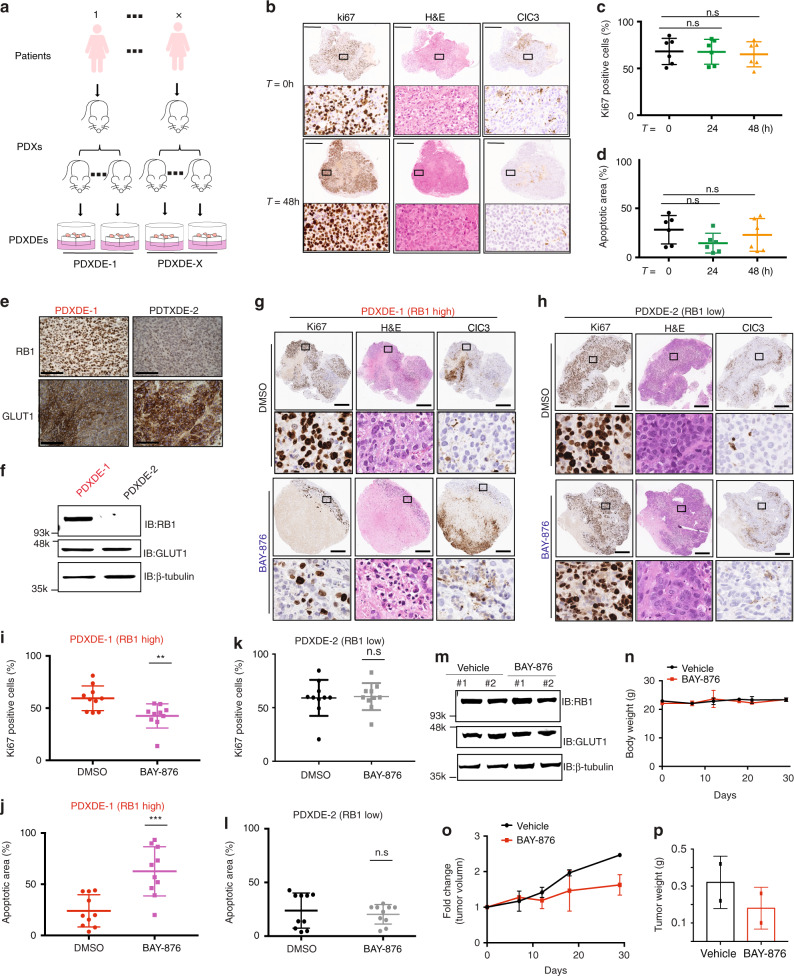
Triple negative breast cancer (TNBC) is a deadly form of breast cancer due to the development of resistance to chemotherapy affecting over 30% of patients. New therapeutics and companion biomarkers are urgently needed. Recognizing the elevated expression of glucose transporter 1 (GLUT1, encoded by SLC2A1) and associated metabolic dependencies in TNBC, we investigated the vulnerability of TNBC cell lines and patient-derived samples to GLUT1 inhibition. We report that genetic or pharmacological inhibition of GLUT1 with BAY-876 impairs the growth of a subset of TNBC cells displaying high glycolytic and lower oxidative phosphorylation (OXPHOS) rates. Pathway enrichment analysis of gene expression data suggests that the functionality of the E2F pathway may reflect to some extent OXPHOS activity. Furthermore, the protein levels of retinoblastoma tumor suppressor (RB1) strongly correlate with the degree of sensitivity to GLUT1 inhibition in TNBC, where RB1-negative cells are insensitive to GLUT1 inhibition. Collectively, our results highlight a strong and targetable RB1-GLUT1 metabolic axis in TNBC and warrant clinical evaluation of GLUT1 inhibition in TNBC patients stratified according to RB1 protein expression levels.


Conflict of interest statement

The authors declare no competing interests.

Figures

Fig. 1
Fig. 1. Growth of a subset of TNBC relies on GLUT1 activity.
SLC2A1 gene expression in the a TCGA breast cancer datasets, b METABRIC breast cancer datasets, and c Princess Margaret Hospital PDXs datasets (PM-PDXs). According to PAM50 classification, the cohorts were designated as basal and non-basal subtypes. Gene expression is reported as log2(TPM + 0.001). The number of patients (n) per group is indicated. Wilcoxon rank sum test. *p < 0.05; ****p < 0.0001. d Heatmap of mean IC50 values for the indicated 21 breast cancer cell lines. n = 4, mean ± s.d. e Representative immunoblots showing the siRNA knockdown of GLUT1 or luciferase control in the BAY-876-sensitive lines (HCC1806 and Hs 578T) and BAY-876-resistant lines (MDA-MB-436 MDA-MB-468). Relative band intensities shown below blots. f Normalized cell confluency of GLUT1 knockdown cells or siRNA luciferase control cells for the indicated time post siRNA transduction. Cell confluency is normalized to T0 time point. n = 4, mean ± s.d. Two-way ANOVA. *p < 0.05; **p < 0.01; n.s. not significant. g Cell growth of TNBC lines cultured in complete DMEM medium with or without glucose deprivation for 5 days. n = 4, mean ± s.d. Two-way ANOVA. ****p < 0.0001. h Flow cytometry cell cycle analysis for indicated cells cultured with or without BAY-876 treated for 72 h. n = 3, mean ± s.d. Two-way ANOVA. *p < 0.05; **p < 0.01; ***p < 0.001; n.s. not significant. i Representative images of caspase 3/7 staining. The scale bar represents 300 µM. j Apoptotic cell counts of BAY-876 treated for 3 days by caspase 3/7 staining. n = 3, mean ± s.d. Two-way ANOVA. ***p < 0.001; ****p < 0.0001; n.s. not significant. Source data are provided as a Source Data file.
Fig. 2
Fig. 2. OXPHOS levels correlate with the response to GLUT1 inhibition.
a OCR and ECAR were measured for each of BAY-876-sensitive lines (red) and resistant lines (black). b OCR and ECAR ratio were calculated for each cell line. Student’s t test, ****p < 0.0001. c ECAR values measurement of cells with or without BAY-876 treatment for 5 days. n = 4; mean ± s.d.; Two-way ANOVA. *p < 0.05; **p < 0.01; ***p < 0.001. d ECAR values measurement of cells with siRNA of GLUT1 knockdown or luciferase control. n = 7; mean ± s.d. Two-way ANOVA. ****p < 0.0001. e Glucose uptake analysis were performed in cells following BAY-876 treatment for the 5 days. n = 4; mean ± s.d. Two-way ANOVA. ***p < 0.001; ****p < 0.0001; f A trace of OCR values from a mitochondrial stress test of cells with or without BAY-876 treatment for 5 days. n = 4; mean ± s.d. Two-way ANOVA. ****p < 0.0001; n.s. not significant. g A trace of OCR values from a mitochondrial stress test of cells with siRNA of GLUT1 or luciferase control. n = 6; mean ± s.d. Two-way ANOVA. ***p < 0.001; ****p < 0.0001; n.s. not significant. h Glutamine uptake analysis was performed in cells following 1 μM BAY-876 treatment. n = 3. i Glutamine uptake analysis performed in cells transfected with 25 nM siSLC2A1 (bottom). n = 2. j Growth curves of MDA-MB-468 cells (left) and MDA-MB-436 cells (right) cultured in complete DMEM medium with or without glutamine deprivation treated with indicated nine doses of BAY-876 for 5 days. n = 3; mean ± s.d. Two-way ANOVA. **p < 0.01; ***p < 0.001; ****p < 0.0001. Source data are provided as a Source Data file.
Fig. 3
Fig. 3. RB1 protein level discriminates response to GLUT1 inhibition.
a Volcano plot of log2 fold change for all genes significantly upregulated (red; left) in sensitive lines or in resistant lines (blue; right). b Top enriched pathways in BAY-876-resistant lines compared to BAY-876-sensitive lines based on GSEA. c Heatmap of pathways correlated with OXPHOS revealed by GSEA of TCGA RNA-sequencing data. Clusters significantly related to OXPHOS are zoomed at the bottom. Pearson’s correlation coefficients between Log2 normalized protein expression data and response of BAY-876 showing significantly associated proteins with sensitive lines (red; left) or resistant lines (blue; right) based on the dataset from d MD-Anderson Cancer Center and e Princess Margaret Cancer Center (PMCC). f Representative western blot showing the variable RB1 expression levels in 17 TNBC lines. β-tubulin as a loading control. g Correlation of RB1 protein levels and the IC50 of BAY-876. h Representative immunoblot showing MDA-MB-436 cells expressing RB1 or GFP control proteins. β-tubulin as a loading control. i ECAR and OCR values were measured for MDA-MB-436 cells expressing RB1 or GFP control. n = 4; mean ± s.d. Two-sided Student’s t test. *p < 0.05; ***p < 0.001. j Growth curves of MDA-MB-436 cells expressing RB1 or GFP control in the presence of indicated concentrations BAY-876 treatment for 5 days. n = 4; mean ± s.d. k Representative western blot showing HCC1806 cells transfected with shRB1 and shLUC. β-actin as a loading control. l ECAR and OCR values were measured for HCC1806 cells transfected with shRB1 and shLUC. n = 4; mean ± s.d. Two-way ANOVA. *p < 0.05; ***p < 0.001. m Growth curves of HCC1806 cells with control knockdown or RB1 knockdown in the presence of indicated concentrations BAY-876 treatment for 5 days. n = 4; mean ± s.d. n Western blot showing the variable RB1 expression levels in a panel of three TNBC patient-derived organoids. β-actin as loading control. o Cell viability assays of patient-derived organoids with indicated concentrations of BAY-876. n = 3; mean ± s.d. Source data are provided as a Source Data file.
Fig. 4
Fig. 4. RB1 levels dictates BAY-876 sensitivity in patient samples.
a Schematic of pre-clinical PDXDE trial. PDXDEs established from TNBC patients were evaluated for response to BAY-876 treatment. b Representative images of explants during ex vivo culture time range assessed by ki67 staining, H&E staining, and cleaved caspase 3 (CIC3) staining. Scale bars represent 500 µm. Indicated area is zoomed in 5× at the bottom. Ex vivo culture for 48 h did not significantly change the c cell proliferation of explants assessed by Ki-67 staining; and d the apoptosis of explants. n = 6; mean ± s.d. e Representative IHC staining images of GLUT1 and RB1 for PDXDE-1, PDXDE-2. f Representative immunoblotting showing RB1 and GLUT1 expression levels in PDXDE-1 and PDXDE-2. g Representative IHC staining images including ki67 staining, H&E staining, and CIC3 staining of RB1-positive PDXDE-1. Scale bars represent 500 µm. Indicated area is zoomed in 10× at the bottom. h Representative IHC staining images for PDXDE-2. Scale bars represent 500 µm. Indicated area is zoomed in 10× at the bottom. i BAY-876 treatment resulted in regression of PDXDE-1 growth assessed by ki67 staining. n = 10; mean ± s.d. Two-sided Student’s t test. ****p < 0.0001. j BAY-876 treatment resulted in increased apoptosis of PDXDE-1 assessed by CIC3 staining. n = 10; mean ± s.d. Two-sided Student’s t test. ***p < 0.001. k BAY-876 treatment did not result in significant change of PDXDE-2 growth assessed by ki67 staining. n = 11; mean ± s.d. Two-sided Student’s t test. l BAY-876 treatment did not lead to significant changes of apoptosis of PDXDE-2 assessed by CIC3 staining. n = 10; mean ± s.d. Two-sided Student’s t test. m Representative immunoblotting showing RB1 and GLUT1 expression levels in PDX. Data shown were n body weights over the course of experiment; o growth curves of tumor volumes and p tumor weight of end point xenografts. Source data are provided as a Source Data file.

References

    1. Torre LA, et al. Global cancer statistics, 2012. CA Cancer J. Clin. 2015;65:87–108. doi: 10.3322/caac.21262. - DOI - PubMed
    1. Collignon J, Lousberg L, Schroeder H, Jerusalem G. Triple-negative breast cancer: treatment challenges and solutions. Breast Cancer. 2016;8:93–107. - PMC - PubMed
    1. Morante Z, et al. Post-recurrence survival in triple negative breast cancer. J. Clin. Orthod. 2018;36:e13120–e13120.
    1. Lee A, Djamgoz MBA. Triple negative breast cancer: emerging therapeutic modalities and novel combination therapies. Cancer Treat. Rev. 2018;62:110–122. - PubMed
    1. Bianchini G, Balko JM, Mayer IA, Sanders ME, Gianni L. Triple-negative breast cancer: challenges and opportunities of a heterogeneous disease. Nat. Rev. Clin. Oncol. 2016;13:674–690. - PMC - PubMed

Publication types

MeSH terms