. 2020 Aug 21;11(1):4183.
doi: 10.1038/s41467-020-17876-0.

A single-cell atlas of the human substantia nigra reveals cell-specific pathways associated with neurological disorders

Affiliations

A single-cell atlas of the human substantia nigra reveals cell-specific pathways associated with neurological disorders

Devika Agarwal et al. Nat Commun. .

Abstract

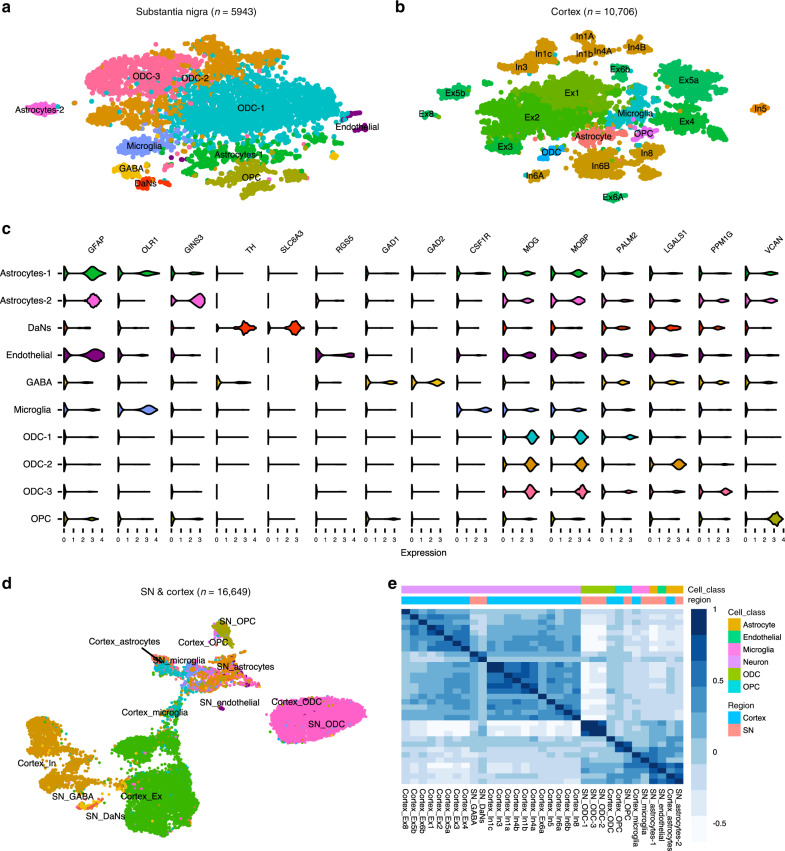
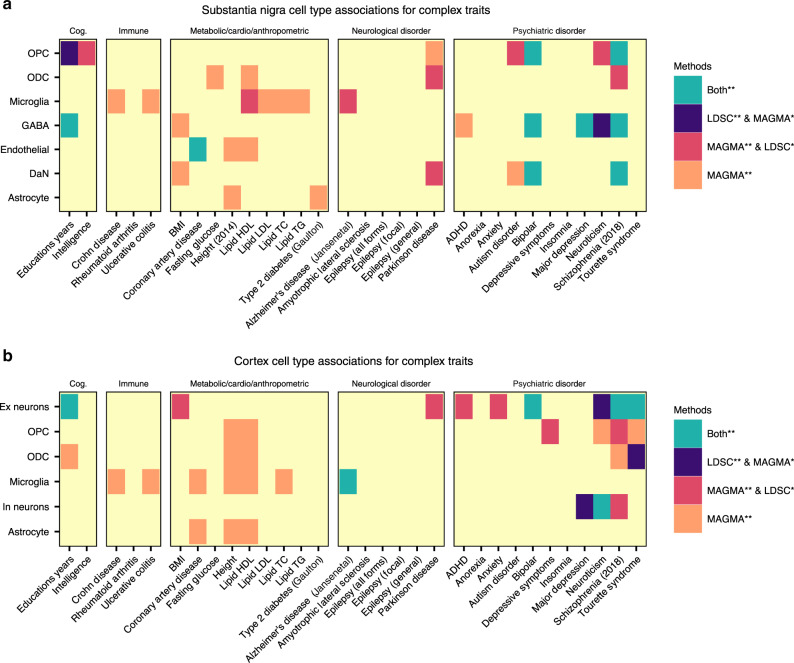
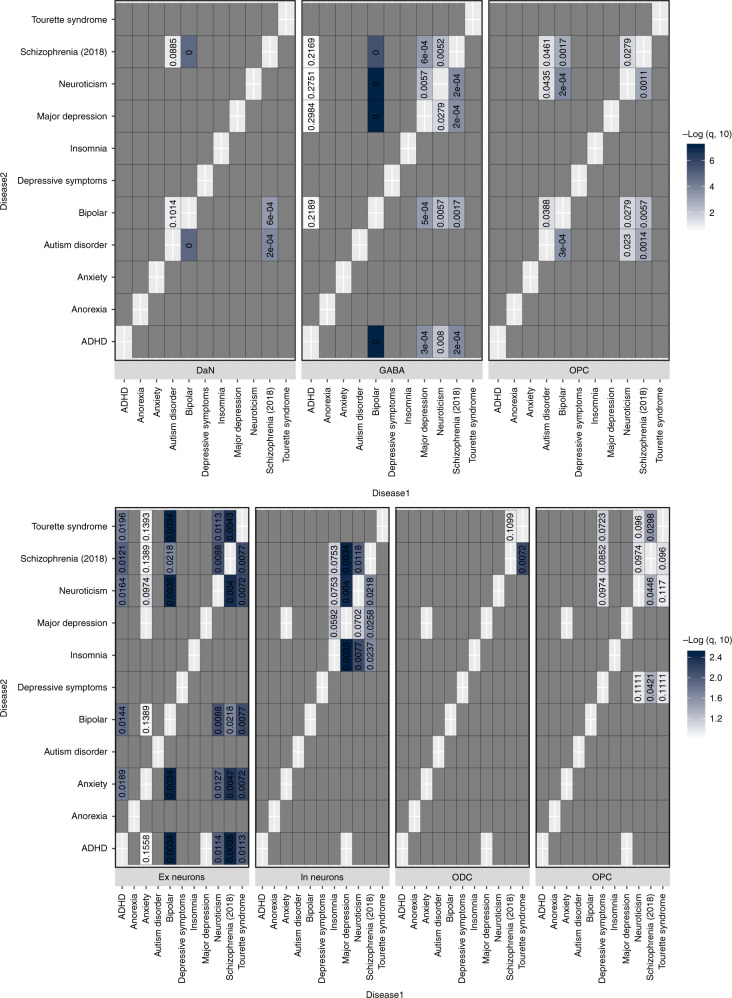
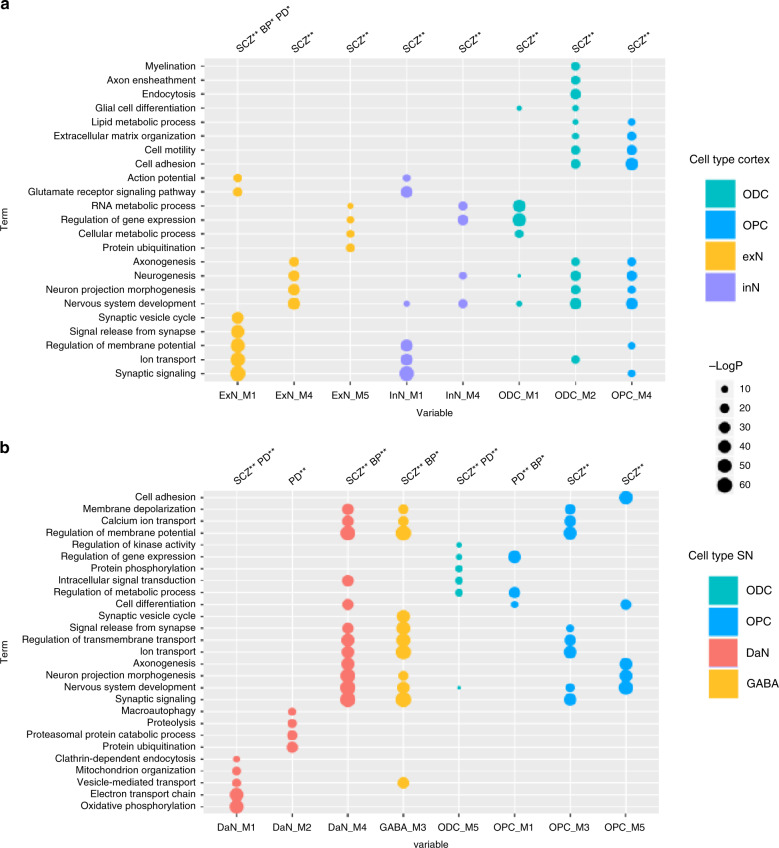
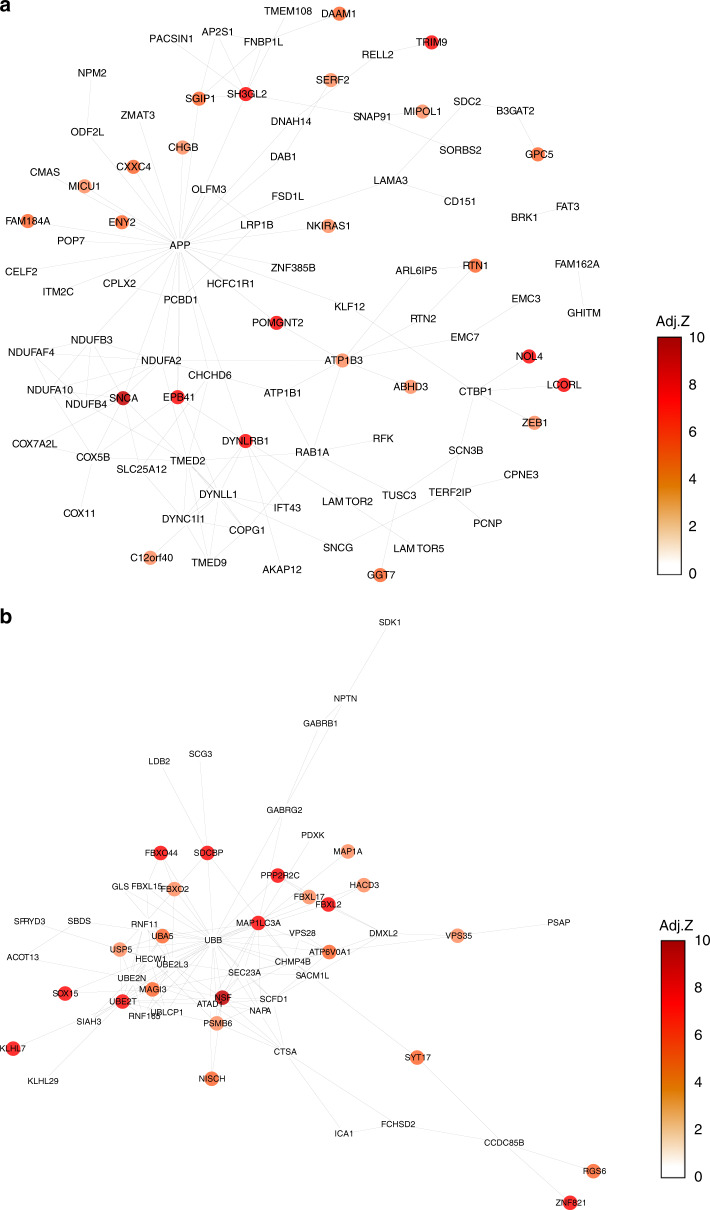
We describe a human single-nuclei transcriptomic atlas for the substantia nigra (SN), generated by sequencing approximately 17,000 nuclei from matched cortical and SN samples. We show that the common genetic risk for Parkinson's disease (PD) is associated with dopaminergic neuron (DaN)-specific gene expression, including mitochondrial functioning, protein folding and ubiquitination pathways. We identify a distinct cell type association between PD risk and oligodendrocyte-specific gene expression. Unlike Alzheimer's disease (AD), we find no association between PD risk and microglia or astrocytes, suggesting that neuroinflammation plays a less causal role in PD than AD. Beyond PD, we find associations between SN DaNs and GABAergic neuron gene expression and multiple neuropsychiatric disorders. Conditional analysis reveals that distinct neuropsychiatric disorders associate with distinct sets of neuron-specific genes but converge onto shared loci within oligodendrocytes and oligodendrocyte precursors. This atlas guides our aetiological understanding by associating SN cell type expression profiles with specific disease risk.


Conflict of interest statement

The authors declare no competing interests.

Figures

Fig. 1
Fig. 1. Single-nuclei transcriptomic cell atlas of the adult human cortex and substantia nigra (SN).
T-distributed stochastic neighbour embedding (t-SNE) plot of gene expression relationships amongst the single-nuclei cells from five individuals in the (a) substantia nigra (SN) (n = 5943) and (b) cortex (n = 10,706). c Violin plots of expression values (log10 TPM values) of enriched cell-type-specific markers for the cell types in the SN (Supplementary Data 3). d Uniform manifold approximation and projection (UMAP) plot of both the cortex and substantia nigra cell types (n = 16,649 cells) showing distinct clustering by cell type. e Correlation heatmaps showing hierarchical clustering of Pearson correlation scores calculated between averaged cell-type subclusters in both regions. The transcriptional correlation is largely explained by cell type and not by the region of origin. DaNs dopaminergic neurons, Ex excitatory neurons, GABA GABAergic neurons, In inhibitory neurons, ODC oligodendrocytes, OPC oligo-precursor cells.
Fig. 2
Fig. 2. Identification of brain cell types associated with diverse human complex traits.
We used two approaches to identify the associations between genetic risk variants of different complex trait and cell types from (a) substantia nigra and (b) cortex: stratified LD score regression (LDSC) (p value associated with an LDSC Coefficient (“Methods”)) and the MAGMA gene set analysis (one-sided positive two-sample t-test). The heatmap colours give different degrees of significance with both methods or either method, an asterisk (*) and double asterisks (**) indicate nominally significant p value (<0.05) and q value (Bonferroni correction for the number of cell types tested). The different traits were clustered by category: cognitive phenotypes (Cog.), autoimmune diseases (Immune), metabolic, cardiovascular and anthropometric traits (Metabolic/Cardio/Anthropometric), Neurological disorders, Psychiatric disorders.
Fig. 3
Fig. 3. Evaluation of the shared cell-type associations between pairs of neuropsychiatric disorders.
Evaluation of alike cell-type associations between any two neuropsychiatric disorders to identify any shared cell-type-specific component of risk, for the SN cell types (top) and the cortex (bottom). Each heatmap represents the results from LDSC of the associations (p value associated with an LDSC coefficient) of a specific cell-type expression profile with the genetic risk of a given neuropsychiatric disorder (disease1—X-axis) after conditioning on the genetic risk of another neuropsychiatric disorder (disease2—Y-axis). This analysis was only performed where two neuropsychiatric disorders showed a significant (or suggestive) association with the same cell type (Fig. 2). The blue heatmap colours are proportional to −log10 q value (FDR-adjusted p value) of the enrichment of genetic variants associated with a disorder adjusted for another disorder. The cell associations that were not evaluated (no overlap in Fig. 2) are coloured in dark grey.
Fig. 4
Fig. 4. Cell-type-specific pathways associated with the genetic risk of three genetic brain disorders.
Gene Ontology (GO) enrichment for cortex (a) and substantia nigra (SN) (b) cell-type-specific protein–protein interaction (PPI) gene modules enriched in Parkinson’s disease (PD), schizophrenia (SCZ) and bipolar (BP) disorders risk. We tested the convergence of disease genetic risk at a functional level across cell-type-specific PPI gene modules using MAGMA gene set analysis (one-sided positive two-sample t-test); an asterisk (*) and double asterisks (**) indicate nominally significant p value (<0.05) and q value (Bonferroni correction for the number of cell-type PPI modules tested), respectively. The top representative GO biological process terms are shown for cell-type modules with either PD, SCZ or BP risk enrichment that reached significance in the more general cell-type level analysis (Fig. 2). Tests across all identified gene modules are reported in Supplementary Fig. 10, and complete lists of enriched GO terms are reported in Supplementary Data 6 and 7. The size of circles represents −log(p value) for GO enrichment with Fisher test; colours correspond to cell types (DaNs dopaminergic neurons, Ex excitatory neurons, GABA GABAergic neurons, In: inhibitory neurons, ODC oligodendrocytes, OPC oligo-precursor cells).
Fig. 5
Fig. 5. Cell-type-specific protein–protein interaction networks of Parkinson’s risk-associated genes.
Protein–protein interaction (PPI) network representations of Parkinson’s risk-associated genes within substantia nigra (SN) dopaminergic neurons (DaN) specific modules DaN_M1 (a) and DaN_M2 (b). We display all the genes found within each of two DaN-specific PPI gene modules associated with Parkinson’s disease risk (Fig. 4) and colour each gene according to that gene’s Parkinson’s risk association MAGMA adjusted Z-score, with darker colours corresponding to higher adjusted Z-scores and a stronger Parkinson’s risk association. Edges between genes indicate an interaction between those genes’ protein products (see “Methods”).

Comment in

References

    1. Hickman S, Izzy S, Sen P, Morsett L, El Khoury J. Microglia in neurodegeneration. Nat. Neurosci. 2018;21:1359–1369. doi: 10.1038/s41593-018-0242-x. - DOI - PMC - PubMed
    1. Poewe W, et al. Parkinson disease. Nat. Rev. Dis. Prim. 2017;3:17013. doi: 10.1038/nrdp.2017.13. - DOI - PubMed
    1. Booth HDE, Hirst WD, Wade-Martins R. The role of astrocyte dysfunction in Parkinson’s disease pathogenesis. Trends Neurosci. 2017;40:358–370. doi: 10.1016/j.tins.2017.04.001. - DOI - PMC - PubMed
    1. Bruck D, Wenning GK, Stefanova N, Fellner L. Glia and alpha-synuclein in neurodegeneration: a complex interaction. Neurobiol. Dis. 2016;85:262–274. doi: 10.1016/j.nbd.2015.03.003. - DOI - PMC - PubMed
    1. Darmanis S, et al. A survey of human brain transcriptome diversity at the single cell level. Proc. Natl Acad. Sci. USA. 2015;112:7285–7290. doi: 10.1073/pnas.1507125112. - DOI - PMC - PubMed

Publication types