. 2020 Aug 21;11(1):4178.
doi: 10.1038/s41467-020-17954-3.

Frataxin gene editing rescues Friedreich's ataxia pathology in dorsal root ganglia organoid-derived sensory neurons

Affiliations

Frataxin gene editing rescues Friedreich's ataxia pathology in dorsal root ganglia organoid-derived sensory neurons

Pietro Giuseppe Mazzara et al. Nat Commun. .

Abstract

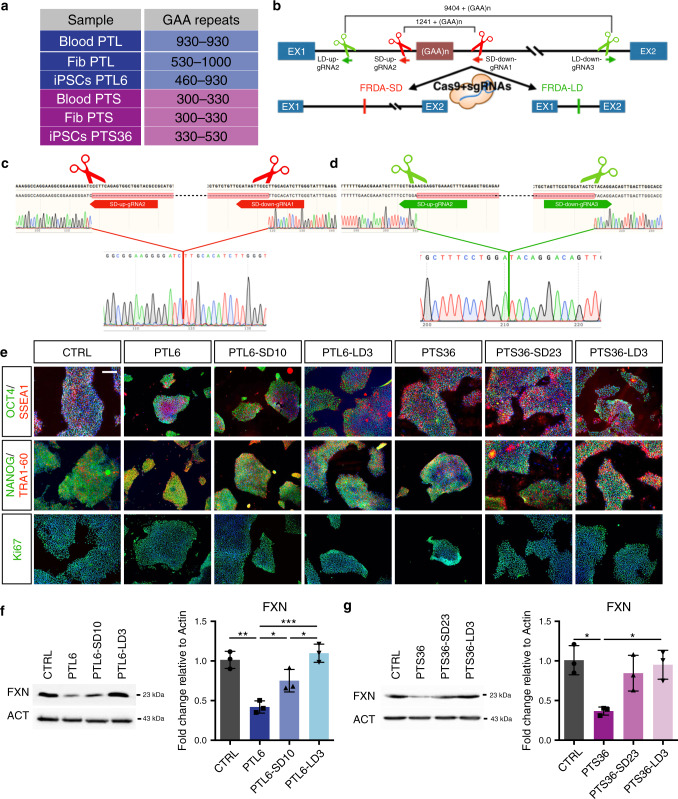
Friedreich's ataxia (FRDA) is an autosomal-recessive neurodegenerative and cardiac disorder which occurs when transcription of the FXN gene is silenced due to an excessive expansion of GAA repeats into its first intron. Herein, we generate dorsal root ganglia organoids (DRG organoids) by in vitro differentiation of human iPSCs. Bulk and single-cell RNA sequencing show that DRG organoids present a transcriptional signature similar to native DRGs and display the main peripheral sensory neuronal and glial cell subtypes. Furthermore, when co-cultured with human intrafusal muscle fibers, DRG organoid sensory neurons contact their peripheral targets and reconstitute the muscle spindle proprioceptive receptors. FRDA DRG organoids model some molecular and cellular deficits of the disease that are rescued when the entire FXN intron 1 is removed, and not with the excision of the expanded GAA tract. These results strongly suggest that removal of the repressed chromatin flanking the GAA tract might contribute to rescue FXN total expression and fully revert the pathological hallmarks of FRDA DRG neurons.


Conflict of interest statement

The authors declare no competing interests.

Figures

Fig. 1
Fig. 1. Generation of FRDA patient and isogenic CRISPR/Cas9 targeted iPSCs.
a Annotation of GAA repeats in different cell lines from FRDA patients PTS and PTL. b Illustration of CRISPR-based deletions in FXN intron 1. Pairs of sgRNAs drive Cas9-based targeted excision to proximal sites (red) flanking the GAA tract and long distal sites (green). Thus, short (SD) or long deletions (LD) of the FXN intron 1 are generated in FRDA-SD and FRDA-LD iPSC lines, respectively. c, d Representative Sanger sequencing confirming the generation of the short (c) and long deletion (d) in FRDA patient iPSCs. e Immunocytochemistry of the crucial pluripotency markers OCT4, NANOG, SSEA1 and TRA-1-60 on CTRL and untreated or targeted patient iPSCs. Scale bar, 100 μm. f, g Quantitative analysis of frataxin protein levels in PTL6 (f) and PTS36 (g) and their relative targeted iPSC lines. Protein levels are normalized to Actin. Mean ± s.d., n = 3 independent experiments, 24–36 organoids/line/experiment. *P < 0.05; **P < 0.01; ***P < 0.001; one-way ANOVA with Bonferroni correction.
Fig. 2
Fig. 2. Generation and characterization of dorsal root ganglia organoids (DRGOs).
a Illustration of the 3D culture system and sequential exposure to small molecules over time to obtain DRGOs. b Images of key steps in DRGO generation: DIV 0, cell aggregate assembling; DIV 10, neuralized cell aggregates; DIV 20, generation of a star-like web of axonal projections around the central mass; DIV 40, axonal projections positive for the peripheral marker peripherin (PRPH). Scale bars, 1 mm (DIV 40), 500 μm (DIV 0–20). c Immunocytochemistry in DRGOs and 2D-differentiated peripheral neurons (iPSC-SNs) at DIV 40 for proteins localized along neuronal projections (ßIII-Tubulin, PRPH, NF200) and the sensory neuron-specific transcription factors BRN3A and ISL1. Scale bars, 100μm (first column), 50μm (second and fourth columns), 5 μm (third column). d Correlation Heatmap showing absolute distances (Pearson R2−1) between transcriptomes of different brain regions and primary neuronal subtypes: PF cortex: prefrontal cortex; OF cortex: orbitofrontal cortex; Crb: Cerebellum; NAc; Nucleus accumbens; MSNs: motor spinal neurons; DRG; Dorsal Root Ganglia; DRGOs; in vitro differentiated iPSC-derived DRGs. The correlation between samples is also shown as an unsupervised hierarchical clustered dendrogram on the sides. e Whole-transcriptome analysis using the t-Distributed Stochastic Neighbor Embedding (t-SNE) analysis with a view of the sample distribution along the first two dimensions. f Gene expression heatmap showing the genes differentially expressed either in DRGs vs iPSC, or DRGO vs iPSC; the correlation between samples is also shown as an unsupervised hierarchical clustered dendrogram on the side.
Fig. 3
Fig. 3. Single-cell transcriptomic profiling of DRGO cellular subtypes.
a, b Immunocytochemistry on DIV 40 DRGOs (a) and relative quantification (b) of TRK A/B/C combination distinguishing the nociceptive, mechanoreceptive, proprioceptive and undefined neuronal subtypes (arrowhead). Mean ± s.d. n = 5 independent experiments, 6-9 organoids/experiment. Scale bar, 10 μm. c Uniform Manifold Approximation and Projection (UMAP) plot displaying multidimensional reduction and clustering of single-cell RNA-Seq data from DIV 80 DRGOs, and pie chart showing relative abundances of the different cell types. SNP, sensory neuron precursors; IP, immature proprioceptors; P, proprioceptors; N, nociceptors; IM, immature mechanoceptors; M, mechanoceptors; S, satellite cells; Sw, Schwann cells; UN, unknown. (di) UMAP plots highlighting normalized expression values of NEUROG2 associated to immature sensory neurons (d), NTRK1 associated to immature and mature nociceptors (e), NTRK2 associated to mechanoreceptors (f), NTRK3 associated to both proprioceptors and mechanoreceptors (g), MSX1 associated to satellite cells (h), and MPZ associated to Schwann cells (i). j Heatmap showing normalized expression values of cell lineage-specific genes within the different clusters. k Representative image of a Syn-GFP patched neuron. Scale bar, 50 μm. l Percentage of DRGO neurons with different action potential patterns following a 100 pA current injection and recorded by current-clamp electrophysiological registrations. n = 3 independent experiments, 2 DRGO/experiment. m Percentage of DRGO neurons that exhibit spontaneous excitatory postsynaptic currents in voltage-clamp electrophysiological recording. n = 3 independent experiments, 2 DRGO/experiment. n Percentage of patched DRGO neurons that exhibit specific neuronal subtypes after single-cell-RT-PCR. n = 3 independent experiments, 2 DRGO/experiment.
Fig. 4
Fig. 4. In vitro reconstitution of the muscle spindles.
a Co-cultures of DRGOs and intrafusal muscle fibers (IFFs) at DIV 7 with single axonal projections contacting IFFs visualized by immunofluorescence staining for the intrafusal muscle fiber marker S46 (red), and the neuronal protein ßIII-Tubulin (green). Scale bar, 50 µm. b Enlarged view of the boxed area in a reveals the annulospiral wrapping of the axonal terminal around the multinucleated intrafusal muscle fiber within the central domain where nuclei are concentrated (blue, nuclear staining with Hoechst). Scale bar, 10 µm. c Electron microscopy (EM) imaging showing an axonal process (blue) which is wrapping a segment of the intrafusal muscle fiber (red). Scale bar, 1 μm. dk Calretinin (CALB2) (dg) and vGLUT1 (hk) staining (arrowheads) along the NF200 + annulospiral axonal terminals of DRGOs in co-cultures with intrafusal muscle fibers (IFFs) stained with S46 at DIV 50. Scale bar, 10 μm. l Electron microscopy imaging showing an invaginating clathrin-coated vesicle (arrowhead) within the axonal terminal. Scale bar, 100 nm. m, n Immunofluorescence for the synaptic vesicle markers Synapsin and vGLUT1 (green) within axonal fascicles labeled by NF200 (red). Scale bar, 5 μm.
Fig. 5
Fig. 5. Frataxin levels and epigenetic profiling in untreated and targeted patient iPSC-derived DRGOs.
a, b Quantitative analysis of FXN gene transcriptional levels in DIV 40 PTL6 (a), PTS36 (b) and their respective isogenic targeted DRGOs. Expression levels are normalized to actin. Mean ± s.d., n = 3 independent experiments, 8–12 organoids/line/experiment. **P < 0.01; ***P < 0.001; one-way ANOVA with Bonferroni correction. c, d Quantitative analysis of frataxin protein levels in control, PTL6 (c), PTS36 (d) and their respective isogenic targeted DRGOs. Protein levels are normalized to actin. Mean ± s.d., n = 4 independent experiments 24–36 organoids/line/experiment. **P < 0.01; ***P < 0.001; one-way ANOVA with Bonferroni correction. e Illustration of the genomic sites within the FXN exon 1 and its downstream intron where H3K9me3 relative abundance was profiled by ChIP-qPCR analysis. EX1, Exon 1; UC5′, Uncutted region at 5′; UpSD, Region upstream Short deletion; DwSD, Region downstream Short deletion; UC3′, Uncutted region at 3′. f, g Relative abundance of H3K9me3 (f) and H3K9ac (g) as measured by ChIP-qPCR analysis in different regions along the exon and intron 1 in FXN gene, in control, PTS36, PTL6 and its isogenic targeted DRGOs. Data are plotted as % of enrichment on the input for each sample. Mean ± s.d., n = 3 independent experiments 24–36 organoids/line/experiment. *P < 0.05; **P < 0.01; ***P < 0.001; two-way ANOVA. h qPCR analysis of independent meDIP samples, data show the level of DNA methylation of FXN gene promoter in control, PTS36, PTL6 and its isogenic targeted DRGOs. All data are plotted as % of enrichment on the input of each sample. Mean ± s.d., n = 3 independent experiments 24–36 organoids/line/experiment. *P < 0.05; **P < 0.01; ***P < 0.001; two-way ANOVA.
Fig. 6
Fig. 6. Disease phenotype amelioration in CRISPR/Cas9 edited FRDA-LD DRGOs.
a, d Representative images of FRDA patient line derived DRGOs along with short and long deletion isogenic lines, respectively, as compared with a control (CTRL) healthy donor derived DRGO stained for NF200 (a) and in BF (b), and neuritis area quantification for PTL6 and its isogenic lines (c) and PTS36 and its isogenic lines (d). Mean ± s.d., n = 4 independent experiments 3 organoids/line/experiment. *P < 0.05; **P < 0.01; ***P < 0.001; one-way ANOVA with Bonferroni correction. Scale bar: 500 μm. ej Quantitative analysis of transcriptional levels of PVALB (propriorecetors) (e, f), NTRK1 (nociceptors) (g, h) and CACNA1H (mechanoreceptors) (i, j) in control, FRDA patients and their isogenic lines. Expression levels are normalized to actin. Mean ± s.d., n = 3 independent experiments, 8–12 organoids/line/experiment. *P < 0.05; **P < 0.01; ***P < 0.001; one-way ANOVA with Bonferroni correction.
Fig. 7
Fig. 7. Axonal mitochondrial behavior and muscle spindle generation in untreated and targeted patient DRGOs.
a Illustration of the microfluidic device with the two lateral channels connected by a set of horizontal microgrooves of length 935 µm, 5 µm width and 6 µm height. The proximal lateral channel includes two open chambers where DRGOs can be contained and cultured. b Representative image of DRGOs seeded in the lateral chambers of the microfluidic device. Scale bar, 1 mm. c Representative images of DRGO axons within the microgrooves stained for TOMM20 (red) and NF200 (green) to visualize the number and morphology of mitochondria. Scale bar, 5 μm. df Analysis of number (d), size (e) and circularity (f) of TOMM20 + mitochondria in axons of control, PTL6 and PTL6-LD3 DRGOs. Mean ± s.d., n = 5 independent experiments, 4–6 organoids/line/experiment. *P < 0.05; **P < 0.01; one-way ANOVA with Bonferroni correction. g Representative electron microscopy images showing the morphology of axonal mitochondria (red). Scale bar, 1 μm. h, i Representative immunofluorescence (h) and quantitative analysis (i) of muscle spindles in 4 weeks co-cultures between intrafusal muscle fibers and DRGOs from control (CTRL), PTL6 and isogenic PTL6-LD iPSCs. Mean ± s.d., n = 3 independent experiments, 4 organoids/line/experiment. ***P < 0.001; one-way ANOVA with Bonferroni correction. Scale bar: 100 μm. j, k Immunofluorescence for the synaptic vesicle marker Synapsin (green) within axonal NF200 (red) (j) and quantification of Synapsin puncta (k) on PTL6 and its isogenic line. Mean ± s.d., n = 3 independent experiments 3 organoids/line/experiment. *P < 0.05; **P < 0.01; one-way ANOVA with Bonferroni correction. Scale bar, 5 μm.

References

    1. Campuzano V, et al. Friedreich’s ataxia: autosomal recessive disease caused by an intronic GAA triplet repeat expansion. Science. 1996;271:1423–1427. - PubMed
    1. Dürr A, et al. Clinical and genetic abnormalities in patients with Friedreich’s ataxia. N. Engl. J. Med. 1996;335:1169–1175. - PubMed
    1. Harding AE. Friedreich’s ataxia: a clinical and genetic study of 90 families with an analysis of early diagnostic criteria and intrafamilial clustering of clinical features. Brain. 1981;104:589–620. - PubMed
    1. Koeppen AH, Mazurkiewicz JE. (2013). Friedreich ataxia: neuropathology revised. J. Neuropathol. Exp. Neurol. 2013;72:78–90. - PMC - PubMed
    1. Koeppen AH, et al. The dorsal root ganglion in Friedreich’s ataxia. Acta Neuropathologica. 2009;118:763–776. - PubMed

Publication types

MeSH terms