. 2020 Aug 21;11(1):4175.
doi: 10.1038/s41467-020-17929-4.

Single cell RNA sequencing identifies early diversity of sensory neurons forming via bi-potential intermediates

Affiliations

Single cell RNA sequencing identifies early diversity of sensory neurons forming via bi-potential intermediates

Louis Faure et al. Nat Commun. .

Abstract

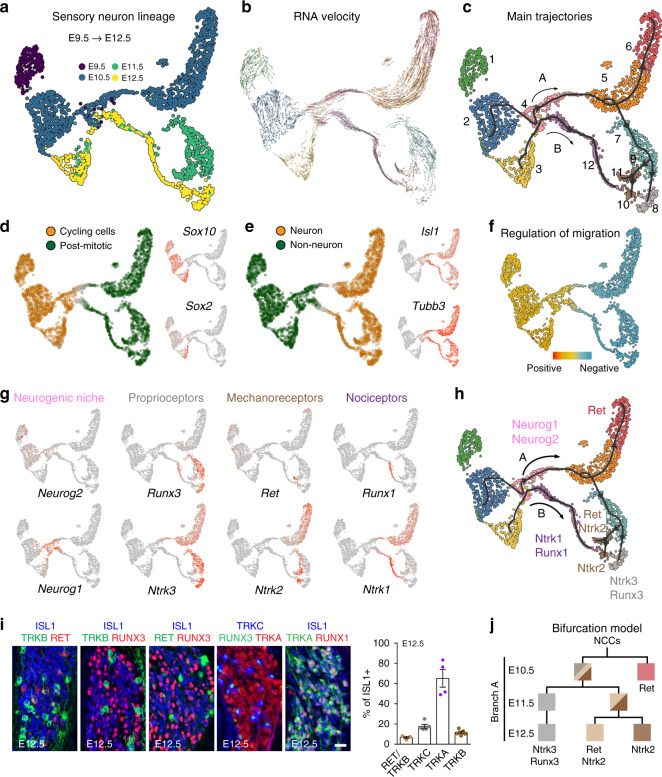
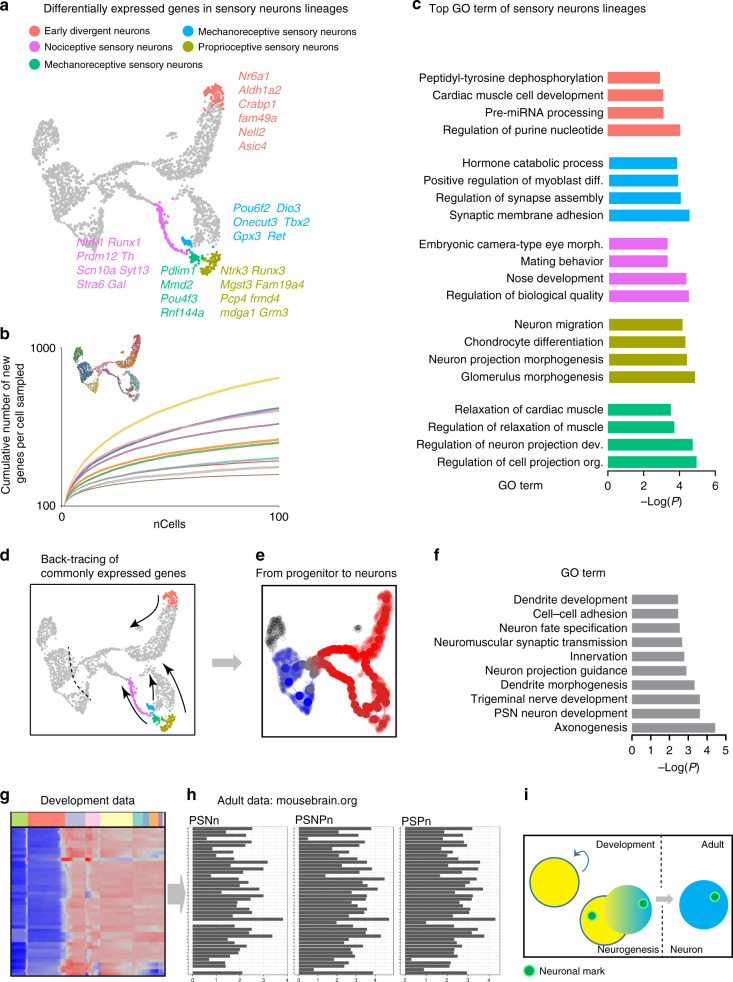
Somatic sensation is defined by the existence of a diversity of primary sensory neurons with unique biological features and response profiles to external and internal stimuli. However, there is no coherent picture about how this diversity of cell states is transcriptionally generated. Here, we use deep single cell analysis to resolve fate splits and molecular biasing processes during sensory neurogenesis in mice. Our results identify a complex series of successive and specific transcriptional changes in post-mitotic neurons that delineate hierarchical regulatory states leading to the generation of the main sensory neuron classes. In addition, our analysis identifies previously undetected early gene modules expressed long before fate determination although being clearly associated with defined sensory subtypes. Overall, the early diversity of sensory neurons is generated through successive bi-potential intermediates in which synchronization of relevant gene modules and concurrent repression of competing fate programs precede cell fate stabilization and final commitment.


Conflict of interest statement

The authors declare no competing interests.

Figures

Fig. 1
Fig. 1. scRNAseq and pseudotime analysis of the developing somatosensory system.
a UMAP embedding representation of the single-cell RNA sequencing dataset, annotated by embryonic day. b RNA Velocity vectors projected onto the UMAP embedding, indicating differentiation directionality. c Differentiation trajectories inferred in a semi-supervised way on Diffusion space using ElPiGraph, revealing 12 main clusters represented within two main trajectories (branches A and B), 10 branches and 3 bifurcations (1, 2 and 3) on branch A. List of genes is provided in the Source data file. d, e Most significant biological aspects extracted using pagoda2 indicate cell state changes from cycling (Sox10+ and Sox2+) to post-mitotic cells (d) and from non-neuronal to neuronal cells (e) (Isl1+ and Tubb3+). f PC score from gene set related to GO term “positive regulation of cell migration” (GO:0030335) subtracted by the PC score for “negative regulation of cell migration” (GO:0030336) indicates a transition from migratory neural crest progenitors to settling neuronal populations. g UMAP plots of selected genes distributed along the trajectories and among cells states represented in (ce). h Transcriptomic dynamic during neurogenesis and neuronal specification show that the different states account for the differentiation of sensory sub-classes that can be distinguished based on their specific expression of neurotrophic factors receptor and transcription factors (Ntrk1, Ntrk2, Ntrk3, Ret, Runx1 and Runx3). i E12.5 DRG sections immunostained for markers highlighted in (h) representing major sensory subpopulation at the trajectories endpoints and quantification (n = 3−5). Scale bar, 20 µm. Data are presented as mean values ± SEM. j Hierarchical bifurcation model of NCCs-derived sensory neurons differentiation within Branch A based on our scRNAseq data analysis (color code and cluster identity according to panel h). Mixed color squares reflect the potential fate choice that the lineage retains at the corresponding developmental point.
Fig. 2
Fig. 2. Neural crest stem cell populations and waves of sensory neurogenesis.
a, b NCCs heterogeneity is defined by different clusters (1−3) (a) of cycling cells (Fig. 1d) which are marked by specific expression of markers and delineate early neural crest cells (eNCCs), late NCCs (lNCCs) and boundary cap cells (lNCCs/BCCs) (b). RNA Velocity in (b) shows the directional transcriptomic flow from eNCCs to lNCCs, then to lNCCs/BCCs. Some cells from lNCCs and lNCC/BCCs converge to the neurogenic state (in pink). c, d Analysis of the neurogenic niche with RNA Velocity computation showing sequential expression of the main neurogenic transcription factors Neurog2 and Neurog1. e RNAscope staining for Neurog1 and Neurog2 on E10.5 DRG sections confirms their co-expression in the same progenitors. Scale bar, 10 µm. f Plot of single cells values for Neurog1 and Neurog2 shows the existence of three stages among progenitors following the pseudotime at E10.5, including concomitant expression of Neurog2 and Neurog1 at the single-cell level (within dashed lines, 136 cells). g Quantification of the concomitant average expression among neuronal progenitor cells reflects a dynamic range of expression from high to low Neurog2 expression and low to high expression of Neurog1. Data are presented as Min to Max whisker plots with center point as mean. h Cross-section of E18.5 DRG from Neurog2CreERT2;R26tdTOM injected at E9.5 and E10.5 with tamoxifen shows recombination in neurons originating from the two waves of neurogenesis (branches A and B), as shown by expression of TOM in large diameter neurons and in small diameter TRKA positive neurons (asterisks) (arrows point to TRKA+/RFP cells). Scale bar, 20 µm. ik 533 TOM+ cells were analyzed per animal (ik, n = 4). Among the RFP+ neurons, more than half were TRKA positive (j), with a diameter inferior or equal to 15 µm (k). Scale bar, 50 µm. Data are presented as mean values ± SEM. l Similar to (h), using Neurog1Cre;R26tdTom (n = 3). m Identification of common transcriptomic program expressed between branch A and branch B leading to all sensory neurons (n). o Specific gene modules for the generation of branch A neurons (myelinated, large diameter) or branch B neurons (unmyelinated, small diameter). p Transcription factor activity inference shows predictive branch-specific activity.
Fig. 3
Fig. 3. Expression of gene modules defining fate choice and commitment along the differentiation trajectories.
a Overview of the analyzed bifurcations on UMAP embedding. b Analysis of the bifurcation representing fate choice between proprioceptor and mechanoreceptor lineages (branches 8 and 9 of Fig. 1c). c UMAP plots showing expression of markers for mechanoreceptor and proprioceptor lineages and validated in vivo (see Supplementary Fig. 3). d, e Scatter plots show average expression of mechanoreceptor and proprioceptor modules in each cell along the mechanoreceptor and proprioceptor lineages. Early competing modules (d) show gradual co-activation, followed by selective upregulation of one fate-specific module and downregulation of the alternative fate-specific module. Late modules (e) show almost mutually exclusive expression within the proprioceptors and mechanoreceptors after bifurcation reflecting commitment to either fates. Color codes as in (a). Top ten highest differentially expressed genes are shown, as well as transcription factors (TF). f Analysis of the bifurcation representing mechanoreceptor fate choice between Ntrk2 and Ret/Ntrk2 lineages (branches 10 and 11 of Fig. 1c). g, h In vivo validation of the branches, with expression of Anxa2 for Ntrk2 fate and Grik1 for Ret/Ntrk2 fate (n = 3 animals). Scale bars, 10 µm. i, j Scatter plots show average expression of Ntrk2 and Ret/Ntrk2 modules in each cell among the two mechanoreceptor sub-lineages. Early competing modules (i) show gradual co-activation, followed by selective upregulation of one fate-specific module and downregulation of the alternative fate-specific module. Late modules (j) show almost mutually exclusive expression within the two mechanoreceptors lineage after bifurcation. Color codes as in (a). Top ten highest differentially expressed genes are shown, as well as transcription factors (TF).
Fig. 4
Fig. 4. Early fate-determining genes or modules show gradual intra-module coordination and inter-module repulsion during cell fate selection.
a, b For bifurcations 1 and 2, plots in a pseudotime analysis show average local correlations of genes within and between branch-specific modules, with gradual increase in coordination within each module and increasing antagonistic expression between the branch-specific modules. c, d The plots show average local correlations of module genes with branch-specific early gene modules for both bifurcations, in a set of cells with similar developmental time (marked by black dots). The difference between intra- and inter-module correlations, which characterize the extent of the antagonistic expression between the alternate modules, is shown in the upper right corner of the correlation plots, and represented in a graph in (d) as absolute value in Y axis which would reflect the repulsion between modules. e Schematic of binary fate decision in sensory neurons. f Repulsion of gene modules for the two bifurcations peaks at different pseudotime t.
Fig. 5
Fig. 5. Early branch-specific gene RUNX3 as a key player for fate biasing before split decision.
a Bifurcation analyzed. b Pseudotime of Runx3 along the trajectories show that Runx3 is upregulated in cells before the bifurcation point. Colors encode branches, as in Fig. 4a. c DRG sections from Runx3+/+;Bax−/− and Runx3−/−;Bax−/− E12.5 embryos (n = 4) stained for TRKB and ISL1 reveal a threefold increase in the number of TRKB+ neurons in the absence of Runx3. Scale bar, 50 µm. ***P < 0.0001. Data are presented as mean values ± SEM. d Volcano plots of differentially expressed genes between Runx3+/GFP and Runx3GFP/GFP DRG neurons (E11.5) showing downregulation of genes that belong to early genes modules of the proprioceptor trajectory and upregulation of genes that belong to the early genes modules of the mechanoreceptors trajectory. e Scheme recapitulating the findings.
Fig. 6
Fig. 6. Transcriptional identity of the major subtypes at neuronal endpoints.
a Analysis of endpoints trajectories identifies differentially expressed genes in the distinct sensory lineages. b Bootstrapping analysis detects a decrease in the number of unique genes as the cells progress towards differentiated states along the diversification tree, with the endpoints clusters having the lowest heterogeneity among all clusters. c GO terms of the sensory lineages show redundancy of the categories between the subtypes of neurons. df Gene transmission from progenitor cell to daughter neurons was studied by first identification of the common genes at the trajectories’ endpoints and second by back-tracking those modules of genes in time up to the cycling neuronal progenitors (d). We identified 43 genes being already expressed by the progenitor population; those genes belong to GO term categories in (f) and are all related to neuronal processes. g, h Pseudotime of the 43 identified genes during development (g, clusters color code is similar to Fig. 1c) and still expressed in the adult DRG neurons (h) composed of the three sub-taxons: peripheral sensory neurofilament neurons (PSNn), peripheral sensory non-peptidergic neurons (PSNPn) and peripheral sensory peptidergic neurons (PSPn) (data from mousebrain.org). Note one line in (g) and (h) represent one same gene. The genes list is provided in the Source Data file. i Scheme showing the ID neuronal mark pass on by mitotic mother cell to daughter neurons and kept into adulthood.
Fig. 7
Fig. 7. Schematic representation of the findings.
Schematic representation of the neurogenesis from different stages of NCCs via distinct trajectories for the neurons of the unmyelinated (nociceptive) versus myelinated (tactile mechanoreceptive and proprioceptive) lineages of our dataset. The genes predicted to be involved in the unfolding of the trajectories are represented at the starting point of the trajectories, while genes that define the latter stage of maturation in our dataset are represented on the endpoints of the trajectories. Note the distribution of some members of the PRDM family (putative histone methyltransferases) throughout the tree. From the trajectory leading to tactile mechanoreceptor and proprioceptive neurons, bursting of genes of competing genetic programs prior to binary fate decision during sensory neuron diversification is reported at the pre-bifurcation level. Those genetic programs direct towards either specific neuronal fate.

References

    1. Telley L, et al. Temporal patterning of apical progenitors and their daughter neurons in the developing neocortex. Science. 2019;364:eaav2522. - PubMed
    1. Mi D, et al. Early emergence of cortical interneuron diversity in the mouse embryo. Science. 2018;360:81–85. - PMC - PubMed
    1. Wamsley B, Fishell G. Genetic and activity-dependent mechanisms underlying interneuron diversity. Nat. Rev. Neurosci. 2017;18:299–309. - PubMed
    1. Greig LC, Woodworth MB, Galazo MJ, Padmanabhan H, Macklis JD. Molecular logic of neocortical projection neuron specification, development and diversity. Nat. Rev. Neurosci. 2013;14:755–769. - PMC - PubMed
    1. Lallemend F, Ernfors P. Molecular interactions underlying the specification of sensory neurons. Trends Neurosci. 2012;35:373–381. - PubMed

Publication types

Substances