

End of Green Sahara amplified mid- to late Holocene megadroughts in mainland Southeast Asia
- PMID: 32826905
- PMCID: PMC7442841
- DOI: 10.1038/s41467-020-17927-6
End of Green Sahara amplified mid- to late Holocene megadroughts in mainland Southeast Asia
Abstract
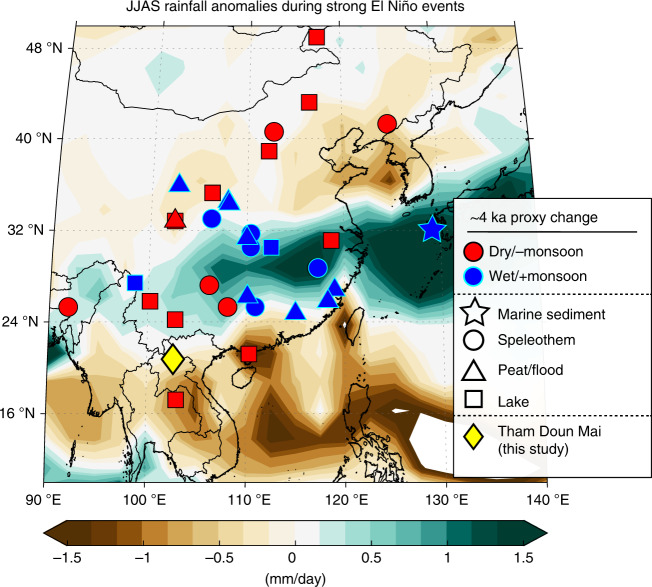
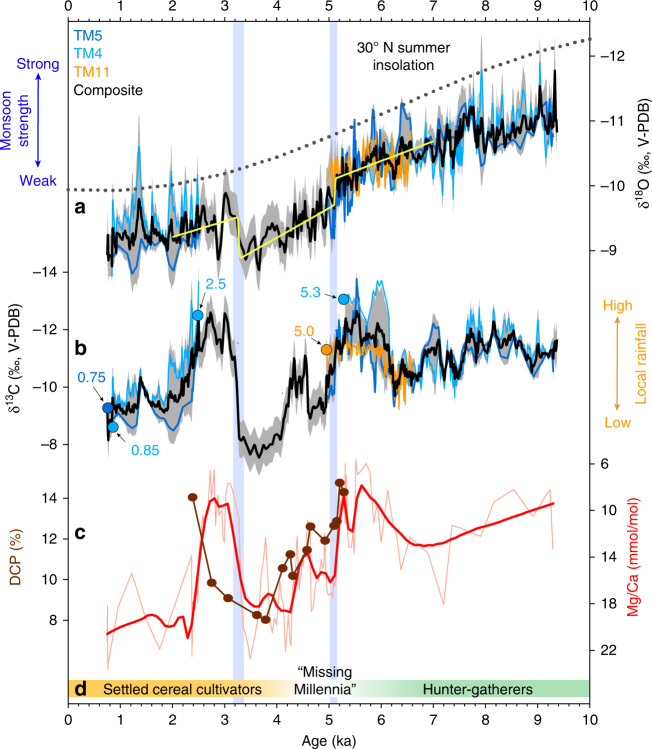
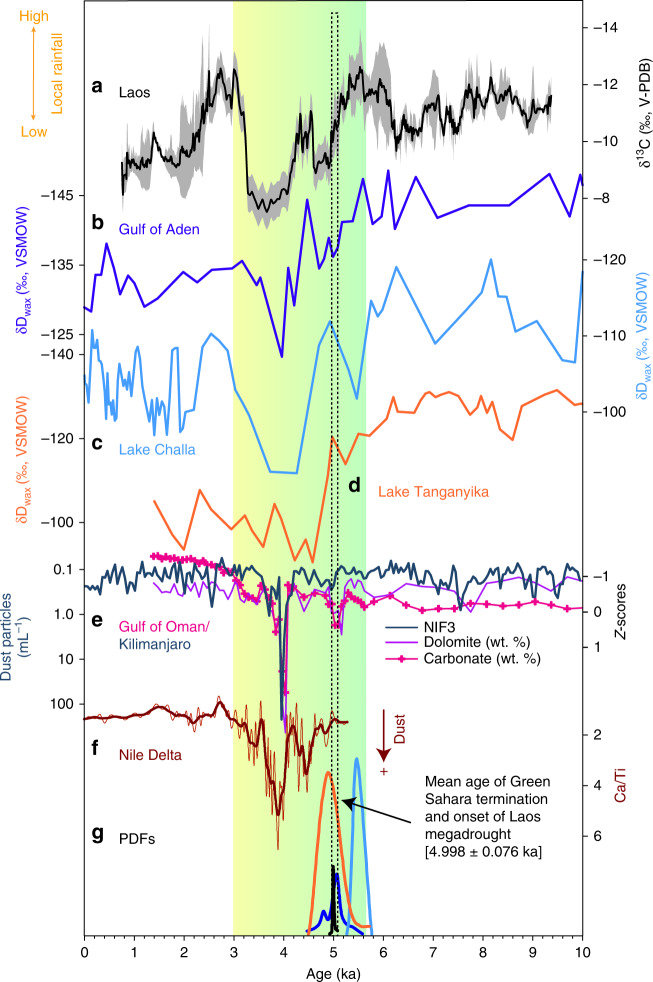
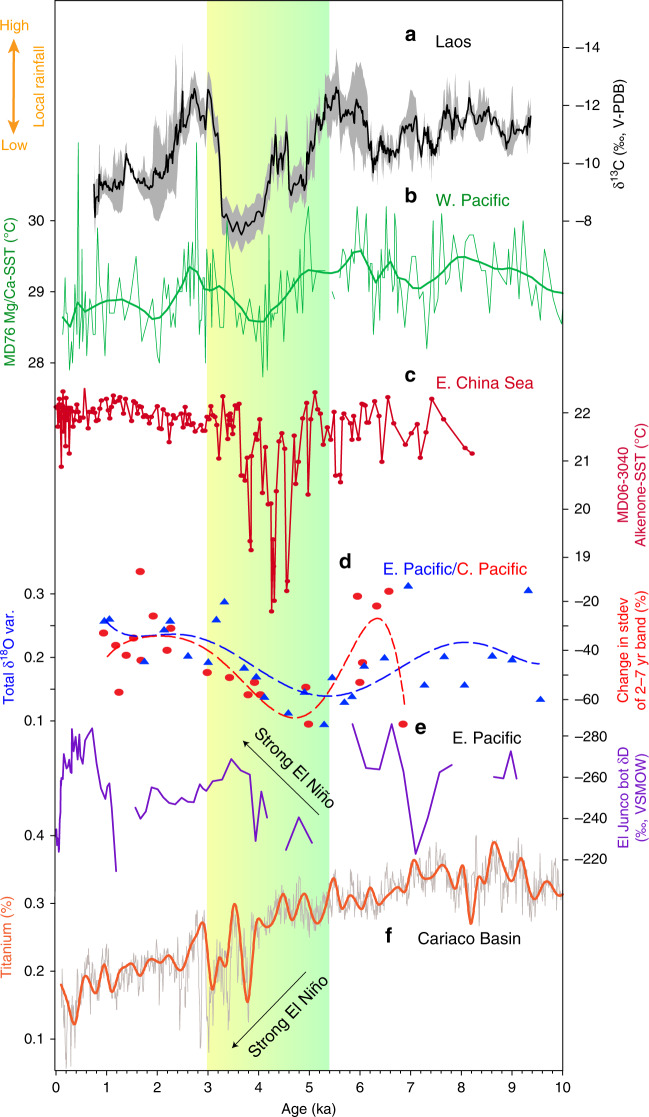
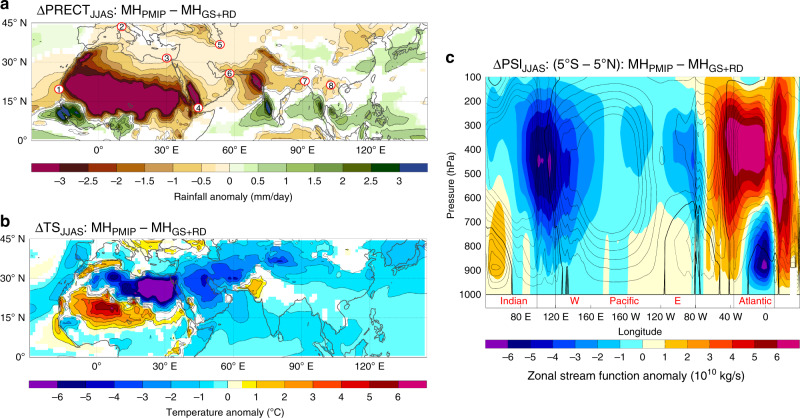
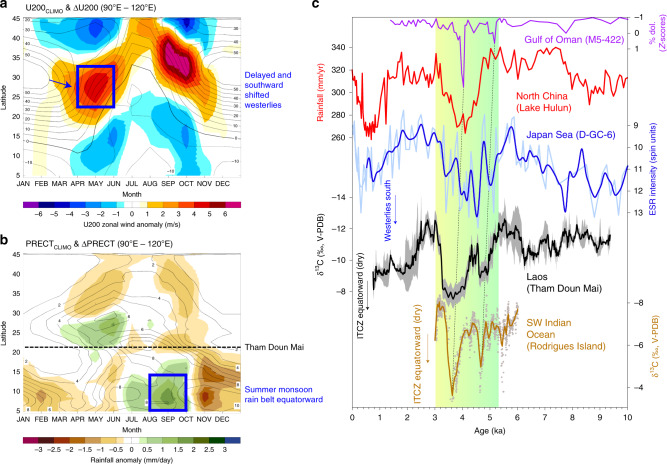
Between 5 and 4 thousand years ago, crippling megadroughts led to the disruption of ancient civilizations across parts of Africa and Asia, yet the extent of these climate extremes in mainland Southeast Asia (MSEA) has never been defined. This is despite archeological evidence showing a shift in human settlement patterns across the region during this period. We report evidence from stalagmite climate records indicating a major decrease of monsoon rainfall in MSEA during the mid- to late Holocene, coincident with African monsoon failure during the end of the Green Sahara. Through a set of modeling experiments, we show that reduced vegetation and increased dust loads during the Green Sahara termination shifted the Walker circulation eastward and cooled the Indian Ocean, causing a reduction in monsoon rainfall in MSEA. Our results indicate that vegetation-dust climate feedbacks from Sahara drying may have been the catalyst for societal shifts in MSEA via ocean-atmospheric teleconnections.
Conflict of interest statement
The authors declare no competing interests.
Figures
Similar articles
-
Early Holocene greening of the Sahara requires Mediterranean winter rainfall.Proc Natl Acad Sci U S A. 2021 Jun 8;118(23):e2024898118. doi: 10.1073/pnas.2024898118. Proc Natl Acad Sci U S A. 2021. PMID: 34074769 Free PMC article.
-
Rainfall regimes of the Green Sahara.Sci Adv. 2017 Jan 18;3(1):e1601503. doi: 10.1126/sciadv.1601503. eCollection 2017 Jan. Sci Adv. 2017. PMID: 28116352 Free PMC article.
-
Tropical cyclone activity enhanced by Sahara greening and reduced dust emissions during the African Humid Period.Proc Natl Acad Sci U S A. 2017 Jun 13;114(24):6221-6226. doi: 10.1073/pnas.1619111114. Epub 2017 May 30. Proc Natl Acad Sci U S A. 2017. PMID: 28559352 Free PMC article.
-
Warming-induced northwestward migration of the East Asian monsoon rain belt from the Last Glacial Maximum to the mid-Holocene.Proc Natl Acad Sci U S A. 2015 Oct 27;112(43):13178-83. doi: 10.1073/pnas.1504688112. Epub 2015 Oct 12. Proc Natl Acad Sci U S A. 2015. PMID: 26460029 Free PMC article.
-
Late Holocene slowdown of the Indian Ocean Walker circulation.Nat Commun. 2017 Oct 18;8(1):1015. doi: 10.1038/s41467-017-00855-3. Nat Commun. 2017. PMID: 29044105 Free PMC article.
Cited by
-
Tipping point-induced abrupt shifts in East Asian hydroclimate since the Last Glacial Maximum.Nat Commun. 2025 Jan 8;16(1):477. doi: 10.1038/s41467-025-55888-w. Nat Commun. 2025. PMID: 39774637 Free PMC article.
-
Earth beyond six of nine planetary boundaries.Sci Adv. 2023 Sep 15;9(37):eadh2458. doi: 10.1126/sciadv.adh2458. Epub 2023 Sep 13. Sci Adv. 2023. PMID: 37703365 Free PMC article.
-
Collapse of fragile Chinese Swamp Cypress forest.Sci Adv. 2025 Apr 25;11(17):eadt1736. doi: 10.1126/sciadv.adt1736. Epub 2025 Apr 23. Sci Adv. 2025. PMID: 40267211 Free PMC article.
-
Dynamic and thermodynamic influences on precipitation in Northeast Mexico on orbital to millennial timescales.Nat Commun. 2023 Apr 20;14(1):2279. doi: 10.1038/s41467-023-37700-9. Nat Commun. 2023. PMID: 37080955 Free PMC article.
-
Sahara's surface transformation forced an abrupt hydroclimate decline and Neolithic culture transition in northern China.Innovation (Camb). 2023 Nov 30;5(1):100550. doi: 10.1016/j.xinn.2023.100550. eCollection 2024 Jan 8. Innovation (Camb). 2023. PMID: 38204586 Free PMC article.
References
-
- Cheng H, et al. The Asian monsoon over the past 640,000 years and ice age terminations. Nature. 2016;534:640. - PubMed
-
- Tierney JE. Abrupt shifts in Horn of Africa hydroclimate since the Last Glacial Maximum. Science. 2013;342:843–846. - PubMed
-
- Shanahan TM, et al. The time-transgressive termination of the African Humid Period. Nat. Geosci. 2015;8:140.
-
- Pausata FSR, Gaetani M, Messori G, Berg A, Maia de Souza D, Sage R, deMenocal PB. The Greening of the Sahara: Past Changes and Future Implications. One Earth. 2020;2:235–250.
