. 2020 Aug 21;10(1):14084.
doi: 10.1038/s41598-020-71100-z.

TGF-β is insufficient to induce adipocyte state loss without concurrent PPARγ downregulation

Affiliations

TGF-β is insufficient to induce adipocyte state loss without concurrent PPARγ downregulation

Brooks Taylor et al. Sci Rep. .

Abstract

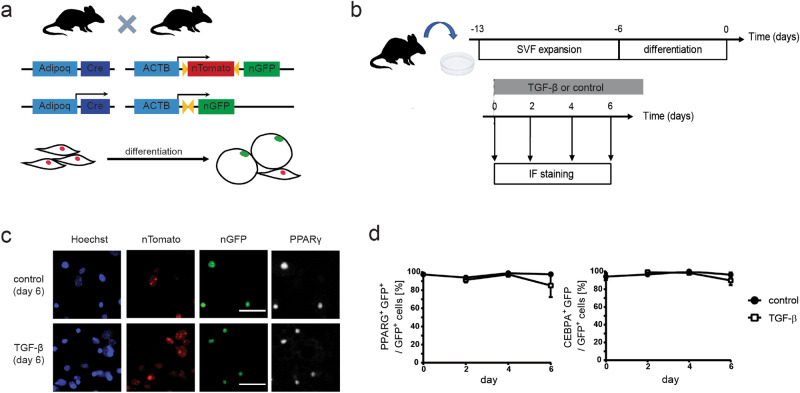
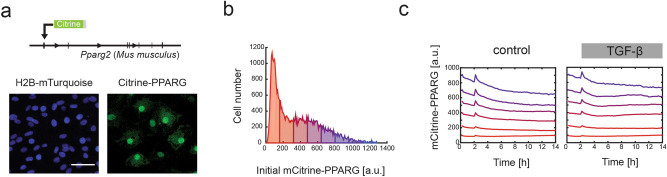
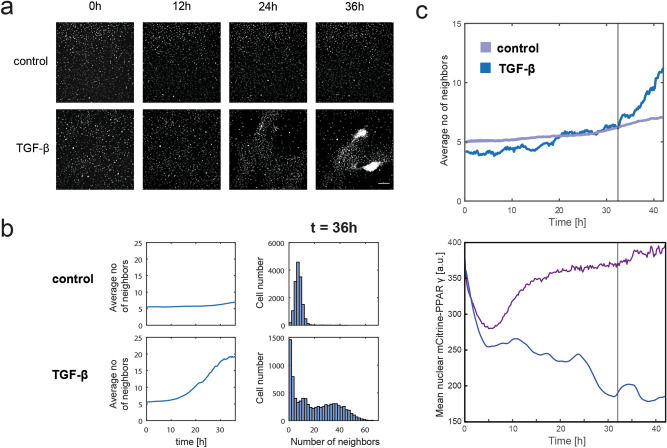
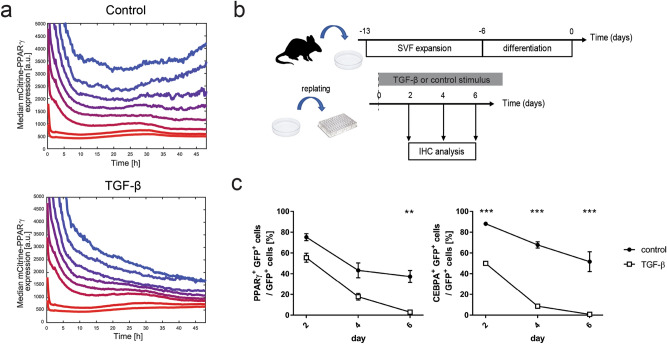
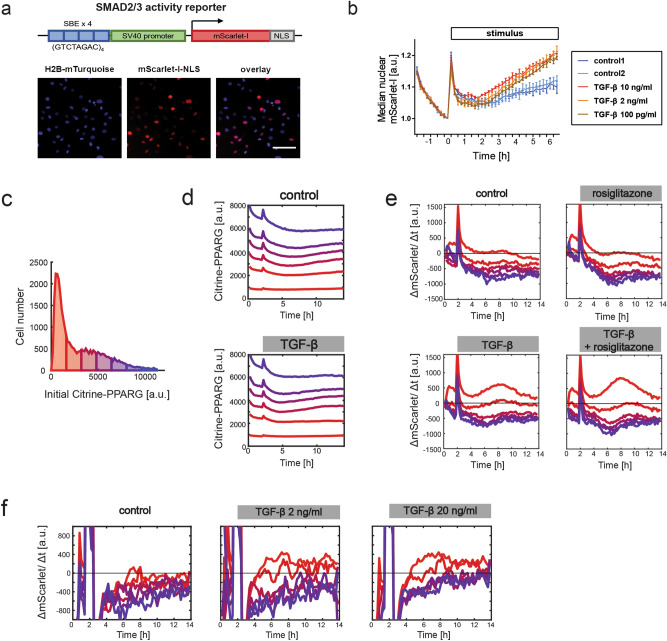
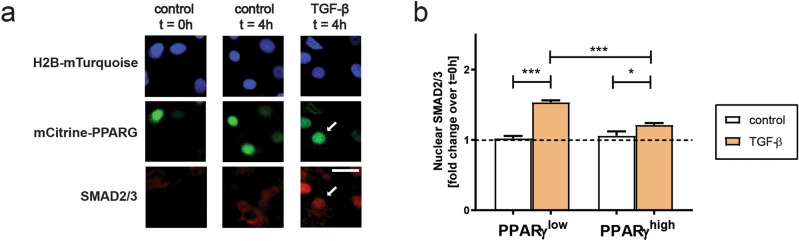
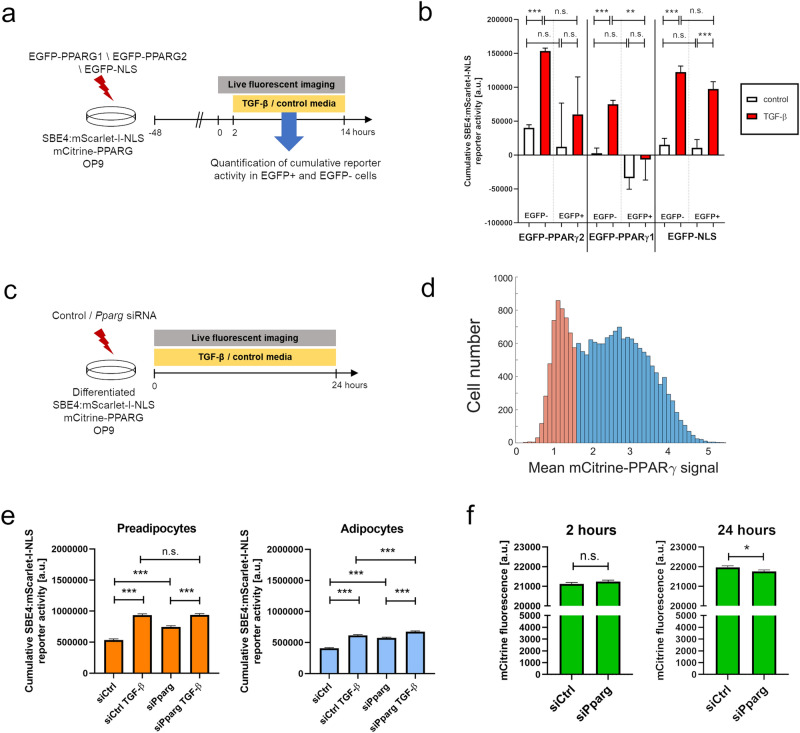
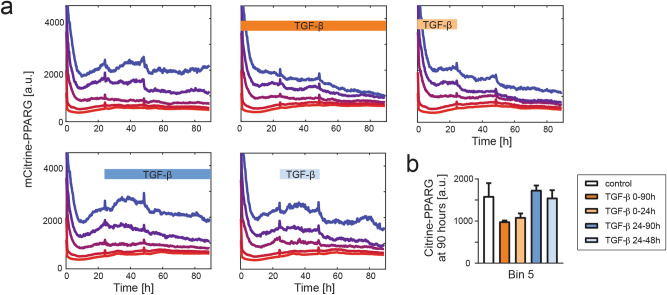
Cell plasticity, the ability of differentiated cells to convert into other cell types, underlies the pathogenesis of many diseases including the transdifferentiation of adipocytes (fat cells) into myofibroblasts in the pathogenesis of dermal fibrosis. Loss of adipocyte identity is an early step in different types of adipocyte plasticity. In this study, we determine the dynamics of adipocyte state loss in response to the profibrotic cytokine TGF-β. We use two complementary approaches, lineage tracing and live fluorescent microscopy, which both allow for robust quantitative tracking of adipocyte identity loss at the single-cell level. We find that the intracellular TGF-β signaling in adipocytes is inhibited by the transcriptional factor PPARγ, specifically by its ubiquitously expressed isoform PPARγ1. However, TGF-β can lead to adipocyte state loss when it is present simultaneously with another stimulus. Our findings establish that an integration of stimuli occurring in a specific order is pivotal for adipocyte state loss which underlies adipocyte plasticity. Our results also suggest the possibility of a more general switch-like mechanism between adipogenic and profibrotic molecular states.


Conflict of interest statement

The authors declare no competing interests.

Figures

Figure 1
Figure 1
TGF-β stimulation does not induce the loss of adipocyte marker expression under standard culture conditions in primary mouse adipocytes differentiated ex vivo. (a) Schematic of the transgenic mouse model used. (b) Experiment outline to test the effect of TGF-β on primary adipocytes using immunofluorescent detection of GFP and adipocyte markers PPARγ and C/EBPα. Primary SVF cells from Adipoq:Cre nT/nG mice were expanded and differentiated into adipocytes in vitro. TGF-β was added to the culture media at the end of differentiation (day 0) and cells were analyzed at days 0, 2, 4 and 6 using immunofluorescent staining. (c) Representative fluorescent images of staining against PPARγ at day 6 after adding stimulus. GFP expression is colocalized with PPARγ expression in the nuclei of both control and TGF-β-treated cells. Scale bar: 50 µm. (d) Percentage of GFP-positive cells expressing adipocyte markers PPARγ and C/EBPα. Two-tailed Student t tests with Benjamini–Hochberg correction; FDR = 0.01; n = 3–8 technical replicates, all time points p > 0.05.
Figure 2
Figure 2
The mCitrine-PPARG cell line can be used to track the endogenous expression of the adipogenic marker PPARγ2 at the single-cell level. (a) Schematic and representative fluorescent images of the mCitrine-PPARG OP9 cell line which also includes a fluorescent nuclear marker H2B-mTurquoise (CFP). Scale bar: 100 um. (b) Distribution of single-cell mCitrine-PPARγ expression at the end of differentiation protocol (day 4). Cells were binned based on the nuclear mCitrine signal and the bins were color-coded. (c) Time course analysis of median mCitrine expression in six bins depending on initial mCitrine expression in differentiated non-replated cells. Data for untreated control and cells treated with 2 ng/ml TGF-β added at 2 h are shown.
Figure 3
Figure 3
Downregulation of adipocyte marker expression in mCitrine-PPARG cells undergoing TGF-β-induced cell cluster formation. (a) Representative fluorescent images of mCitrine-PPARG OP9 cells in the CFP channel to visualize the nuclei of cells forming clumps in a TGF-β-dependent manner in individual control and TGF-β-treated sites. TGF-β at 2 ng/ml was applied at 0 h. Scale bar: 200 µm. (b) Quantification of the clumping phenomenon using the analysis of average number of neighbor nuclei, quantified as other nuclei present within 38 µm radius of each cell’s nucleus. Average number of neighbors plotted for the whole 36 h of analysis and single-cell distribution of neighbor number at 36 h are shown. (c) Representative single-cell mCitrine-PPARG expression level in a PPARγ-high adipocyte. Upper plot: Average number of neighbors in control (purple, average ± S.E.M., n = 6 technical replicates) and in a single TGF-β-treated well (blue) during 42 h-long live experiment. Lower plot: representative time course of mCitrine-PPARG expression in an individual cell from the same TGF-β-treated well (blue) and from adipocyte bin with a comparable initial mCitrine-PPARG level in control conditions (purple). Vertical lines denotes the time point when average number of neighbors after TGF-β application exceeds average number of neighbors in control, indicating the beginning of clumping.
Figure 4
Figure 4
Replating sensitizes adipocytes to TGF-β-induced loss of adipocyte marker expression. (a) Time course analysis of median mCitrine expression in differentiated mCitrine-PPARG OP9 cells subjected to replating at 0 h. All cells were grouped into eight bins depending on the initial mCitrine expression. Cells were either treated with 2 ng/ml TGF-β added at the time of replating or not. Median mCitrine expression for each bin is shown. (b) Outline of the experiment to test the effect of cell replating on TGF-β-induced loss of adipocyte marker expression in primary mouse adipocytes differentiated ex vivo. (c) The dynamics of TGF-β-induced loss of adipocyte marker expression in SVF-derived primary adipocytes. Percentage of GFP-positive cells which expressed adipocyte markers PPARγ and C/EBPα at different time points following replating. n = 4 technical replicates, GFP-positive cells/replicate/time point > 32. Average and S.E.M. shown, two-tailed Student t tests with Benjamini–Hochberg correction; FDR = 0.01; **p < 0.01; ***p < 0.001.
Figure 5
Figure 5
TGF-β signaling activation is restricted to PPARγ-low cells in a population of differentiated and undifferentiated mCitrine-PPARG OP9 cells. (a) Schematic of the live fluorescent reporter of SMAD2/3 transcriptional response, SBE4:mScarlet-I-NLS. Representative fluorescent images of undifferentiated cells are shown. Scale bar: 100 µm. (b) The reporter allows detection of TGF-β signaling pathway activity. Undifferentiated SBE4:mScarlet-I-NLS OP9 cells were treated with various concentrations of TGF-β after initial 2 h of pre-incubation with basal media. For each single cell trace, nuclear signal was normalized by t = 0 h. Mean from n = 3 technical replicates and S.E.M. are shown. (ce) TGF-β applied at 2 h. Results of one experiment representative for three independent experiments. (c) The distribution of single-cell mCitrine expression in the last frame before stimulus addition (2 h), used to assign cells to bins in panels (d,e), shown for the control group. (d) Time course analysis of median mCitrine expression in six bins depending on initial mCitrine expression in differentiated non-replated mCitrine-PPARG SBE4:mScarlet-I-NLS OP9 cells. (e) Strong reporter upregulation, indicated by positive values of the change in integrated nuclear mScarlet-I signal over time (ΔmScarlet/Δt), in the cell bin with the lowest initial mCitrine expression. Median trace for each bin is shown. 12 h of treatment with TGF-β (2 ng/ml), rosiglitazone (1 µM), TGF-β and rosiglitazone, or with basal media in control, beginning after 2 h of pre-incubation with basal media. Median mCitrine expression traces for each bin are shown. (f) Increasing TGF-β dose tenfold does not lead to the upregulation of SBE4:mScarlet-I-NLS reporter in mCitrine-low cell populations. Consistent changes in fluorescence during the first 2 h of experiment are attributable to illumination settings.
Figure 6
Figure 6
The block in TGF-β signaling transduction in adipocytes is at least partially due to a block in SMAD2/3 translocation to the nucleus. (a) TGF-β treatment leads to SMAD2/3 translocation into the nucleus within 4 h both in PPARγ-low and PPARγ-high cells. Differentiated non-replated mCitrine-PPARG OP9 cells were treated with TGF-β and subjected to immunoflurescent staining of SMAD2/3 and PPARγ. Arrows denote a PPARγ-high cell with SMAD2/3 localizing to the nucleus after 4 h of TGF-β treatment. Scale bar: 100 µm. (b) Quantification of nuclear SMAD2/3 intensity in PPARγ-high and PPARγ-low cells treated for 4 h with TGF-β or control media, normalized to values at 0 h. Ordinary one-way ANOVA with Sidak’s multiple comparison test; *p < 0.05; ***p < 0.001.
Figure 7
Figure 7
PPARγ inhibits TGF-β signaling in mCitrine-PPARG SBE4:mScarlet-I-NLS OP9 cells. (a) Outline of the method used to quantify TGF-β signaling activation depending on the overexpression of custom constructs. To prevent basal differentiation, cells were kept below 50% of confluence throughout the experiment. (b) Quantification of cumulative SBE4:mScarlet-I-NLS activity at the single-cell level during 12 h after TGF-β stimulation in transfected (EGFP +) and control untransfected (EGFP-) cells in the same wells. Results of one experiment representative for three independent experiments. (c) Outline of the method used to quantify TGF-β signaling activity depending on Pparg knock-down. SBE4:mScarlet-I-NLS mCitrine-PPARG cells were differentiated, followed by transfection with either Pparg siRNA or control non-targeting siRNA. (d) mCitrine-PPARG expression at the beginning of imaging was used to classify cells as either preadipocytes (orange) or adipocytes (blue). (e) Quantification of cumulative SBE4:mScarlet-I-NLS activity at the single-cell level during 24 h after siRNA transfection in preadipocytes and adipocytes. Ordinary one-way ANOVA with Sidak’s multiple comparisons test. (f) Determination of siRNA efficiency by the quantification of mCitrine-PPARG expression at 2 h and 24 h in all cells treated with Pparg siRNA or control non-targeting siRNA. Two-tailed Student t-tests. **p < 0.01; ***p < 0.001, n.s.—not significant. Average + S.E.M. shown.
Figure 8
Figure 8
PPARγ downregulation requires temporal coexistence of TGF-β stimulation and another stimulus. (a) Single-cell analysis of mCitrine expression in replated mCitrine-PPARG OP9 cells at the end of differentiation protocol. Cells were grouped into 5 bins depending on the mCitrine expression level immediately after replating. Long-term mCitrine expression downregulation in mCitrine-high cells is observed only if TGF-β stimulation occurs during the first 24 h when cells are adhering after replating. Windows of treatment with 2 ng/ml TGF-β are shown. Plots show median traces for each bin. Culture media was replaced at 24 h and 48 h for all conditions. (b) Quantification of median endpoint (90 h) mCitrine expression in Bin 5 (the bin with the highest initial mCitrine). n = 4 technical replicates, all with p > 0.05.

References

    1. Talchai C, Xuan S, Lin HV, Sussel L, Accili D. Pancreatic β cell dedifferentiation as a mechanism of diabetic β cell failure. Cell. 2012;150:1223–1234. doi: 10.1016/j.cell.2012.07.029. - DOI - PMC - PubMed
    1. Buttar NS, Wang KK. Mechanisms of disease: Carcinogenesis in Barrett's esophagus. Nat. Clin. Pract. Gastroenterol. Hepatol. 2004;1:106–112. doi: 10.1038/ncpgasthep0057. - DOI - PubMed
    1. Wang QA, et al. Reversible de-differentiation of mature white adipocytes into preadipocyte-like precursors during lactation. Cell Metab. 2018;28:282–288.e283. doi: 10.1016/j.cmet.2018.05.022. - DOI - PMC - PubMed
    1. Zhang Z, et al. Dermal adipose tissue has high plasticity and undergoes reversible dedifferentiation in mice. J. Clin. Invest. 2019;129:5327–5342. doi: 10.1172/JCI130239. - DOI - PMC - PubMed
    1. Shook BA, et al. Dermal adipocyte lipolysis and myofibroblast conversion are required for efficient skin repair. Cell Stem Cell. 2020;26:880–895. doi: 10.1016/j.stem.2020.03.013. - DOI - PMC - PubMed

Publication types

MeSH terms