. 2021 Feb;49(1):75-82.
doi: 10.1007/s15010-020-01503-7. Epub 2020 Aug 21.

A highly specific and sensitive serological assay detects SARS-CoV-2 antibody levels in COVID-19 patients that correlate with neutralization

Affiliations

A highly specific and sensitive serological assay detects SARS-CoV-2 antibody levels in COVID-19 patients that correlate with neutralization

David Peterhoff et al. Infection. 2021 Feb.

Abstract

Objective: The severe acute respiratory syndrome coronavirus 2 (SARS-CoV-2) pandemic challenges national health systems and the global economy. Monitoring of infection rates and seroprevalence can guide public health measures to combat the pandemic. This depends on reliable tests on active and former infections. Here, we set out to develop and validate a specific and sensitive enzyme linked immunosorbent assay (ELISA) for detection of anti-SARS-CoV-2 antibody levels.

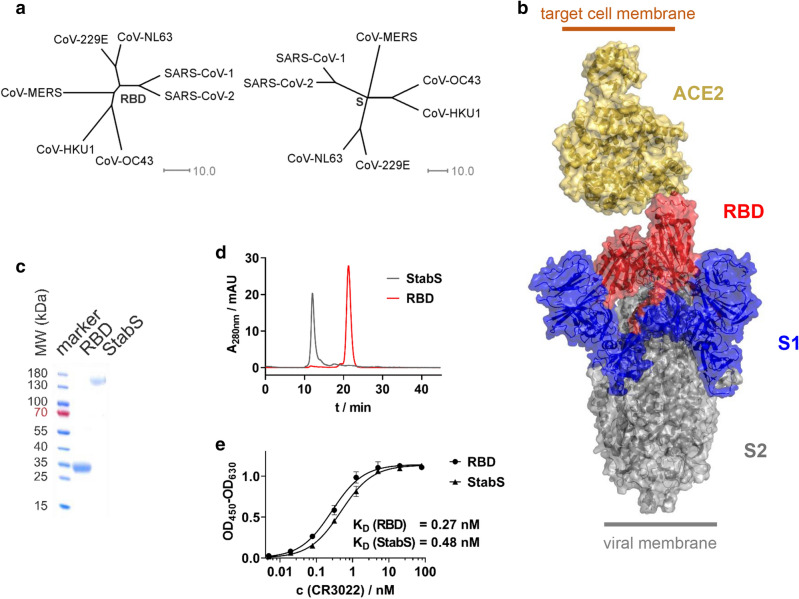
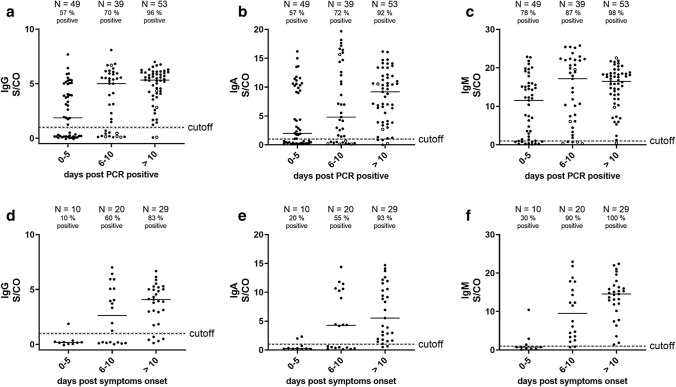
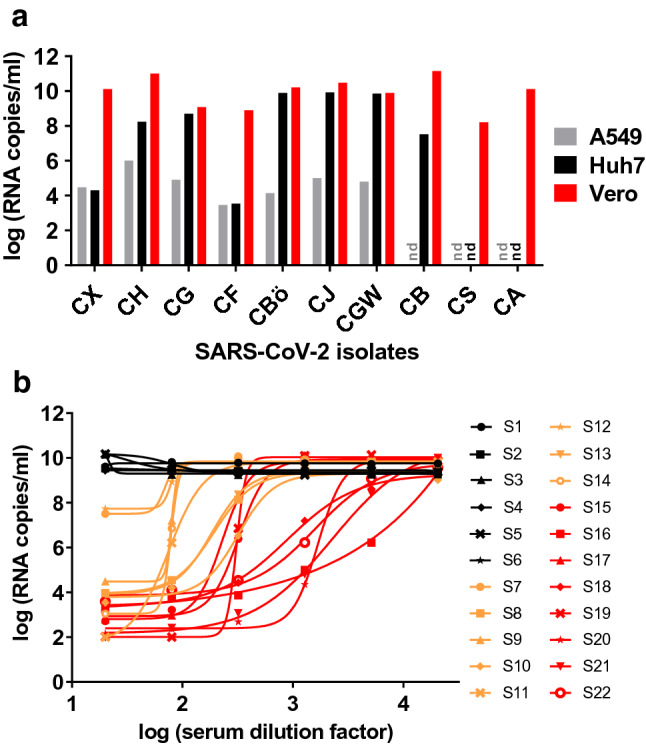
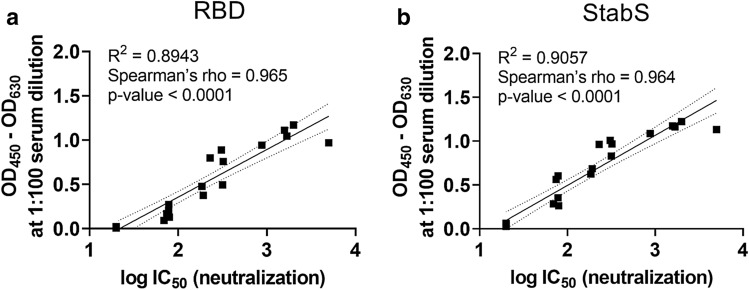
Methods: In our ELISA, we used SARS-CoV-2 receptor-binding domain (RBD) and a stabilized version of the spike (S) ectodomain as antigens. We assessed sera from patients infected with seasonal coronaviruses, SARS-CoV-2 and controls. We determined and monitored IgM-, IgA- and IgG-antibody responses towards these antigens. In addition, for a panel of 22 sera, virus neutralization and ELISA parameters were measured and correlated.

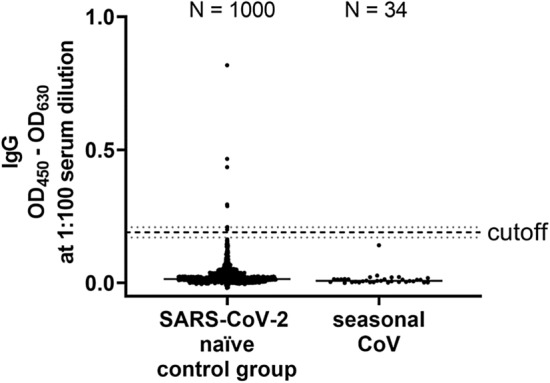
Results: The RBD-based ELISA detected SARS-CoV-2-directed antibodies, did not cross-react with seasonal coronavirus antibodies and correlated with virus neutralization (R2 = 0.89). Seroconversion started at 5 days after symptom onset and led to robust antibody levels at 10 days after symptom onset. We demonstrate high specificity (99.3%; N = 1000) and sensitivity (92% for IgA, 96% for IgG and 98% for IgM; > 10 days after PCR-proven infection; N = 53) in serum.

Conclusions: With the described RBD-based ELISA protocol, we provide a reliable test for seroepidemiological surveys. Due to high specificity and strong correlation with virus neutralization, the RBD ELISA holds great potential to become a preferred tool to assess thresholds of protective immunity after infection and vaccination.

Keywords: Antibody test; Assay validation; COVID-19; ELISA; Receptor binding domain; S protein; SARS-CoV-2; Serology; Spike protein; Virus neutralization.


Conflict of interest statement

All authors declare no conflicts of interest.

Figures

Fig. 1
Fig. 1
Antigens used in SARS-CoV-2 ELISA. a Phylogenetic trees calculated for the RBD and complete S-protein of clinically relevant members of the coronavirus family. Trees are calculated on the basis of percent identity between each pair of sequences in the respective alignment. b Structure of the S-protein ectodomain in complex with its receptor, angiotensin-converting enzyme 2 (ACE2). c Reducing SDS-PAGE (linear gradient of 8–16% polyacrylamide) of the purified RBD and StabS protein. d Size exclusion chromatography of the purified RBD and StabS protein. e ELISA titrations of SARS-CoV-1 and SARS-CoV-2-binding antibody CR3022 against immobilized StabS and RBD [OD450–630: optical density (OD) at 450 nm after background subtraction at 630 nm]. Resulting dissociation constants (KD) are given in the diagram
Fig. 2
Fig. 2
Assay specificity of RBD ELISA. To define the specificity of the assay, 1000 sera isolated in the summers of 2016 and 2018 (SARS-CoV-2 naïve control group) and 34 sera of patients with seasonal corona virus infection (seasonal CoV) were measured (median is shown). The cutoff is set at six standard deviations above the mean of the reference panel (borderline ± 10% cutoff)
Fig. 3
Fig. 3
Serological testing of COVID-19 patients using RBD ELISA. ac Serum reactivities of different immunoglobulin isotypes at 1:100 dilution of 144 sera of different time points after positive SARS-CoV-2 RT-qPCR, 1 per patient and time point (S/CO = signal/cutoff). Sampling of sera > 10 days post-PCR positive ranges from 11 to 29 days. Sera from patients with < 300 RNA copies/ml in respiratory specimen are shown as open circles, all others as closed circles. df Serum reactivities at 1:100 dilution (S/CO values) of 59 sera of different time points after onset of symptoms (subset of values from ac with known case history), one per patient and time point
Fig. 4
Fig. 4
Virus isolation and neutralization assay. a Isolation of ten SARS-CoV-2 strains from respiratory specimen using three different cell lines (A549, derived from lung carcinoma; Huh7, hepatocyte-derived carcinoma; Vero, kidney epithelial cells from African green monkey; nd = not done). Viral loads in cell culture supernatants were determined using RT-qPCR. b After titration of the cytopathic SARS-CoV-2 strain CA, Vero cells were infected at a multiplicity of infection (MOI) of 0.05. Prior to infection, the virus was incubated with dilutions of 22 serum samples (fourfold serial dilutions starting at 1:20). Of these, six (S1–S6, black), eight (S7–S14, orange), and eight (S15–S22, red) samples displayed negative, medium, and high SARS-CoV-2 IgG reactivities, respectively, in the RBD-based ELISA. Two days post-infection, viral loads were determined in cell culture supernatants using RT-qPCR
Fig. 5
Fig. 5
Correlation of antibody levels with SARS-CoV-2 neutralization. Correlation of OD from IgG ELISA measurements at 1:100 serum dilution with log IC50 values obtained from the neutralization experiments for a panel of 22 reference sera using RBD (a) and StabS (b) as an antigen. Coefficients of determination (R2), Spearmen’s ρ, p value, linear regression line (solid line) and 95% confidence intervals (dashed line) are given in the diagrams

References

    1. van der Hoek L. Human coronaviruses: what do they cause? Antivir Ther. 2007;12:651–658. - PubMed
    1. Fung TS, Liu DX. Human coronavirus: host–pathogen interaction. Annu Rev Microbiol. 2019;73:529–557. doi: 10.1146/annurev-micro-020518-115759. - DOI - PubMed
    1. Kellam P, Barclay W. The dynamics of humoral immune responses following SARS-CoV-2 infection and the potential for reinfection. J Gen Virol. 2020 doi: 10.1099/jgv.0.001439. - DOI - PMC - PubMed
    1. Dijkman R, Jebbink MF, El Idrissi NB, Pyrc K, Muller MA, Kuijpers TW, et al. Human coronavirus NL63 and 229E seroconversion in children. J Clin Microbiol. 2008;46:2368–2373. doi: 10.1128/JCM.00533-08. - DOI - PMC - PubMed
    1. Dong E, Du H, Gardner L. An interactive web-based dashboard to track COVID-19 in real time. Lancet Infect Dis. 2020;20:533–534. doi: 10.1016/S1473-3099(20)30120-1. - DOI - PMC - PubMed

MeSH terms