

Mapping geographical inequalities in access to drinking water and sanitation facilities in low-income and middle-income countries, 2000-17
- PMID: 32827479
- PMCID: PMC7443708
- DOI: 10.1016/S2214-109X(20)30278-3
Mapping geographical inequalities in access to drinking water and sanitation facilities in low-income and middle-income countries, 2000-17
Abstract
Background: Universal access to safe drinking water and sanitation facilities is an essential human right, recognised in the Sustainable Development Goals as crucial for preventing disease and improving human wellbeing. Comprehensive, high-resolution estimates are important to inform progress towards achieving this goal. We aimed to produce high-resolution geospatial estimates of access to drinking water and sanitation facilities.
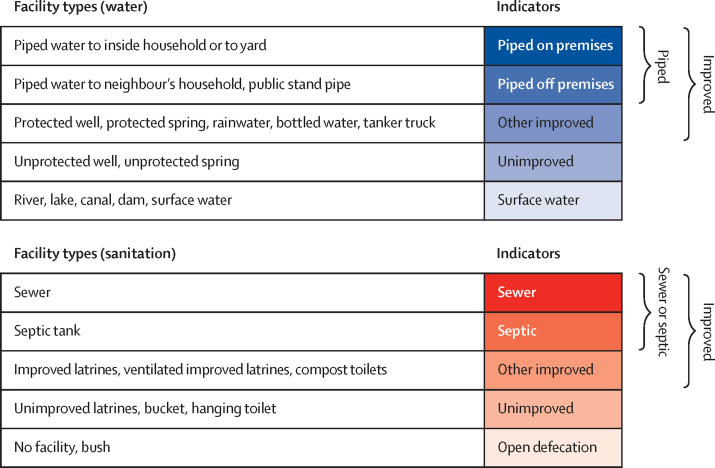
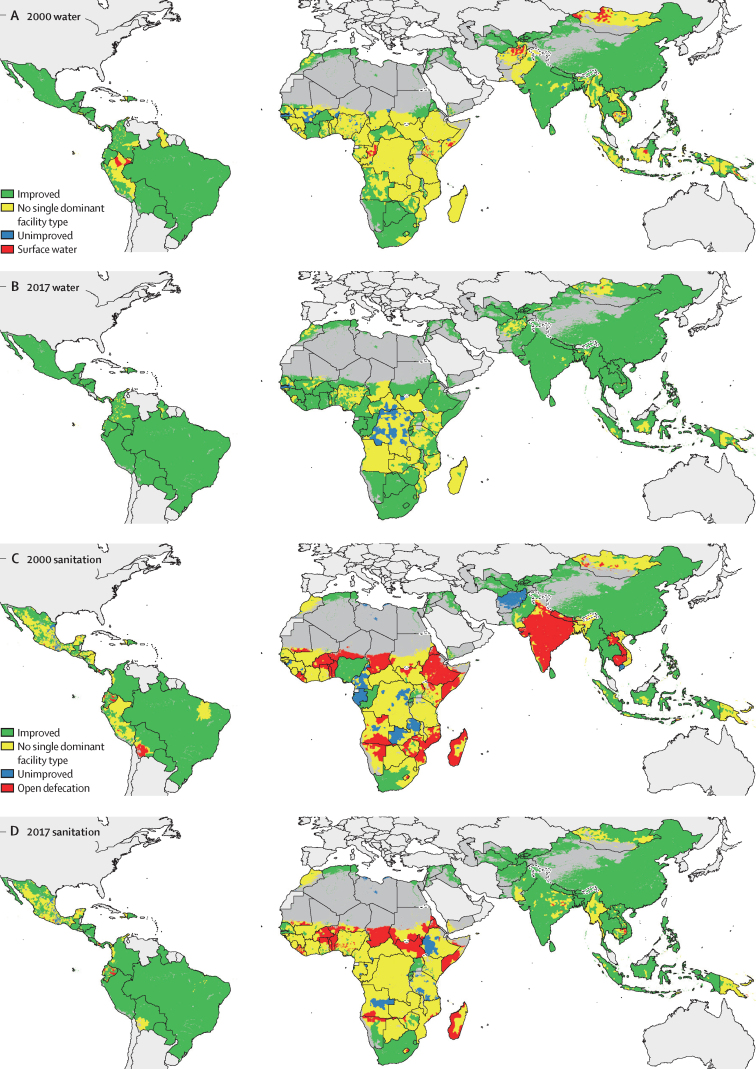
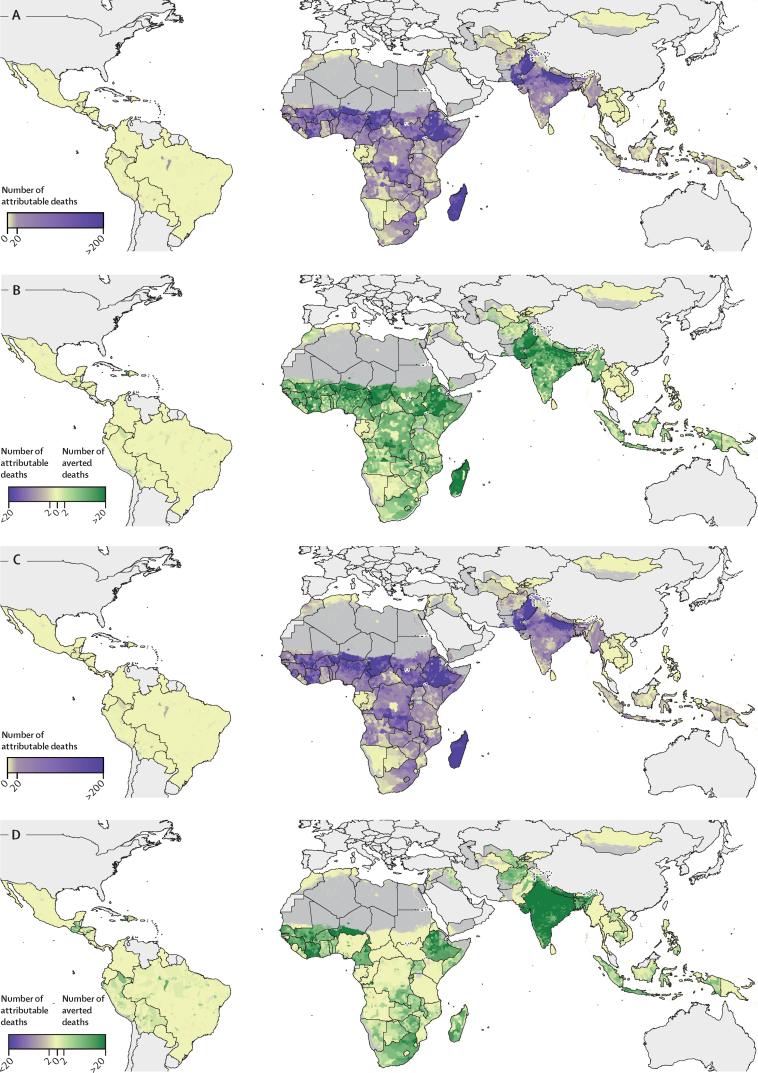
Methods: We used a Bayesian geostatistical model and data from 600 sources across more than 88 low-income and middle-income countries (LMICs) to estimate access to drinking water and sanitation facilities on continuous continent-wide surfaces from 2000 to 2017, and aggregated results to policy-relevant administrative units. We estimated mutually exclusive and collectively exhaustive subcategories of facilities for drinking water (piped water on or off premises, other improved facilities, unimproved, and surface water) and sanitation facilities (septic or sewer sanitation, other improved, unimproved, and open defecation) with use of ordinal regression. We also estimated the number of diarrhoeal deaths in children younger than 5 years attributed to unsafe facilities and estimated deaths that were averted by increased access to safe facilities in 2017, and analysed geographical inequality in access within LMICs.
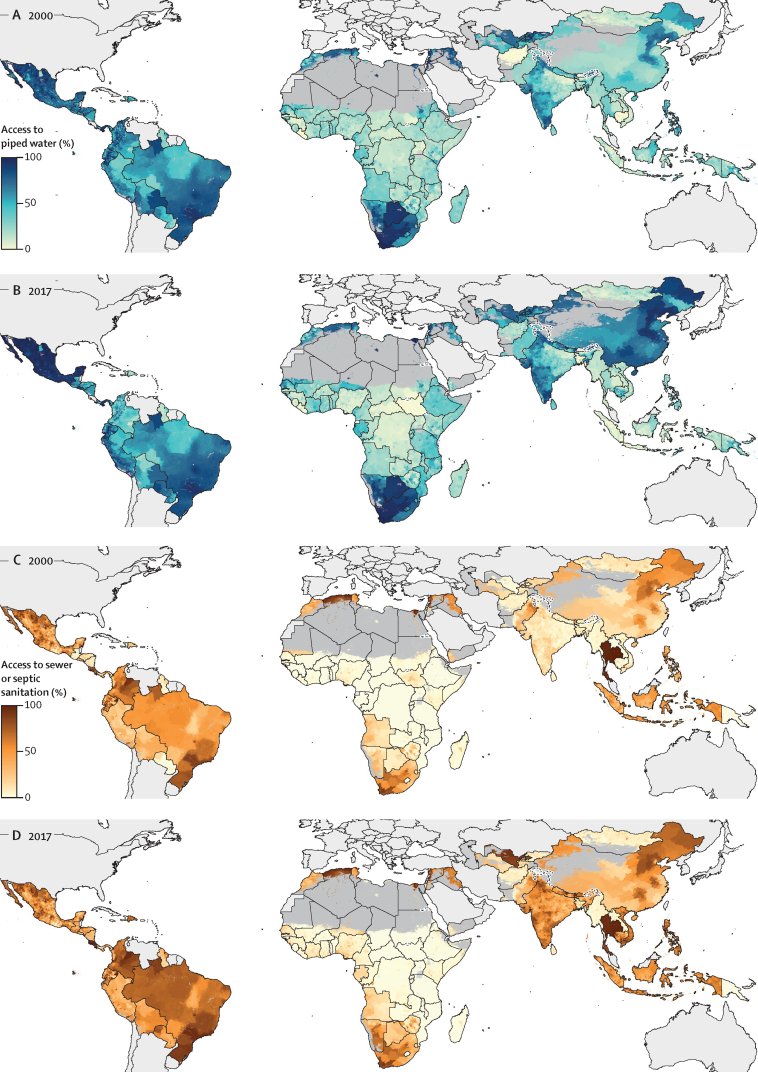
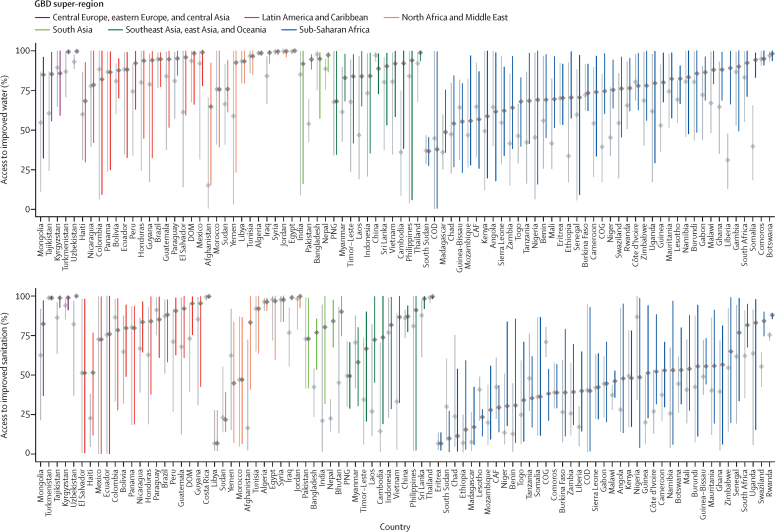
Findings: Across LMICs, access to both piped water and improved water overall increased between 2000 and 2017, with progress varying spatially. For piped water, the safest water facility type, access increased from 40·0% (95% uncertainty interval [UI] 39·4-40·7) to 50·3% (50·0-50·5), but was lowest in sub-Saharan Africa, where access to piped water was mostly concentrated in urban centres. Access to both sewer or septic sanitation and improved sanitation overall also increased across all LMICs during the study period. For sewer or septic sanitation, access was 46·3% (95% UI 46·1-46·5) in 2017, compared with 28·7% (28·5-29·0) in 2000. Although some units improved access to the safest drinking water or sanitation facilities since 2000, a large absolute number of people continued to not have access in several units with high access to such facilities (>80%) in 2017. More than 253 000 people did not have access to sewer or septic sanitation facilities in the city of Harare, Zimbabwe, despite 88·6% (95% UI 87·2-89·7) access overall. Many units were able to transition from the least safe facilities in 2000 to safe facilities by 2017; for units in which populations primarily practised open defecation in 2000, 686 (95% UI 664-711) of the 1830 (1797-1863) units transitioned to the use of improved sanitation. Geographical disparities in access to improved water across units decreased in 76·1% (95% UI 71·6-80·7) of countries from 2000 to 2017, and in 53·9% (50·6-59·6) of countries for access to improved sanitation, but remained evident subnationally in most countries in 2017.
Interpretation: Our estimates, combined with geospatial trends in diarrhoeal burden, identify where efforts to increase access to safe drinking water and sanitation facilities are most needed. By highlighting areas with successful approaches or in need of targeted interventions, our estimates can enable precision public health to effectively progress towards universal access to safe water and sanitation.
Funding: Bill & Melinda Gates Foundation.
Copyright © 2020 The Author(s). Published by Elsevier Ltd. This is an Open Access article under the CC BY 4.0 license. Published by Elsevier Ltd.. All rights reserved.
Figures
References
-
- WHO . World Health Organization; Geneva: 2013. UNICEF. Ending preventable child deaths from pneumonia and diarrhoea by 2025: the integrated Global Action Plan for Pneumonia and Diarrhoea (GAPPD)http://www.who.int/maternal_child_adolescent/documents/global_action_pla... - PubMed
-
- Stanaway JD, Afshin A, Gakidou E. Global, regional, and national comparative risk assessment of 84 behavioural, environmental and occupational, and metabolic risks or clusters of risks for 195 countries and territories, 1990–2017: a systematic analysis for the Global Burden of Disease Study 2017. Lancet. 2018;392:1923–1994. - PMC - PubMed
-
- Fewtrell L, Kaufmann RB, Kay D, Enanoria W, Haller L, Colford JM., Jr Water, sanitation, and hygiene interventions to reduce diarrhoea in less developed countries: a systematic review and meta-analysis. Lancet Infect Dis. 2005;5:42–52. - PubMed
-
- Moreira NA, Bondelind M. Safe drinking water and waterborne outbreaks. J Water Health. 2017;15:83–96. - PubMed
