. 2020 Nov-Dec;8(10):3378-3387.e11.
doi: 10.1016/j.jaip.2020.07.057. Epub 2020 Aug 20.

Pediatric Asthma Health Care Utilization, Viral Testing, and Air Pollution Changes During the COVID-19 Pandemic

Affiliations

Pediatric Asthma Health Care Utilization, Viral Testing, and Air Pollution Changes During the COVID-19 Pandemic

Kiara Taquechel et al. J Allergy Clin Immunol Pract. 2020 Nov-Dec.

Abstract

Background: The coronavirus disease 2019 (COVID-19) pandemic caused dramatic changes in daily routines and health care utilization and delivery patterns in the United States. Understanding the influence of these changes and associated public health interventions on asthma care is important to determine effects on patient outcomes and identify measures that will ensure optimal future health care delivery.

Objective: We sought to identify changes in pediatric asthma-related health care utilization, respiratory viral testing, and air pollution during the COVID-19 pandemic.

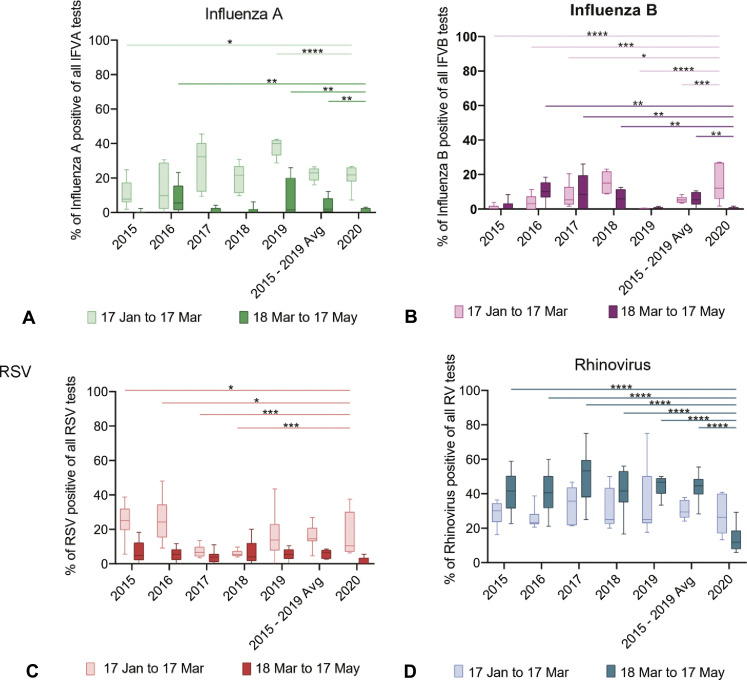
Methods: For the time period January 17 to May 17, 2015 to 2020, asthma-related encounters and weekly summaries of respiratory viral testing data were extracted from Children's Hospital of Philadelphia electronic health records, and pollution data for 4 criteria air pollutants were extracted from AirNow. Changes in encounter characteristics, viral testing patterns, and air pollution before and after Mar 17, 2020, the date public health interventions to limit viral transmission were enacted in Philadelphia, were assessed and compared with data from 2015 to 2019 as a historical reference.

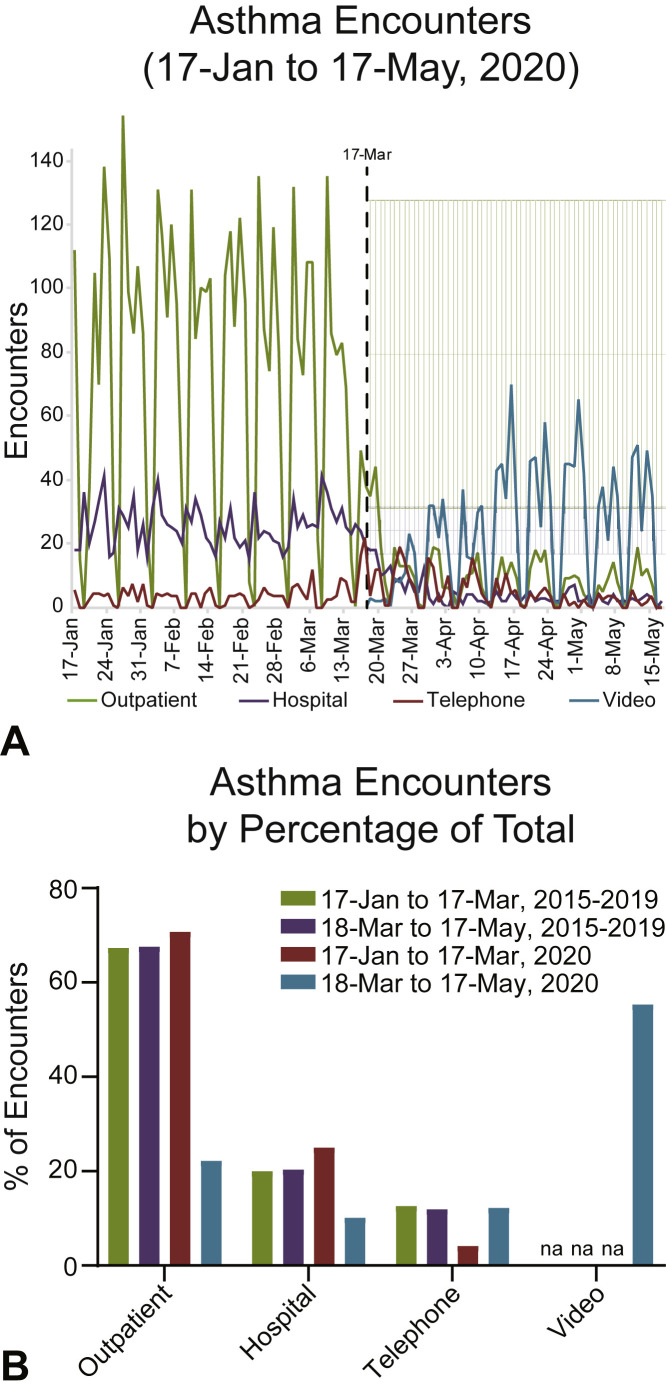
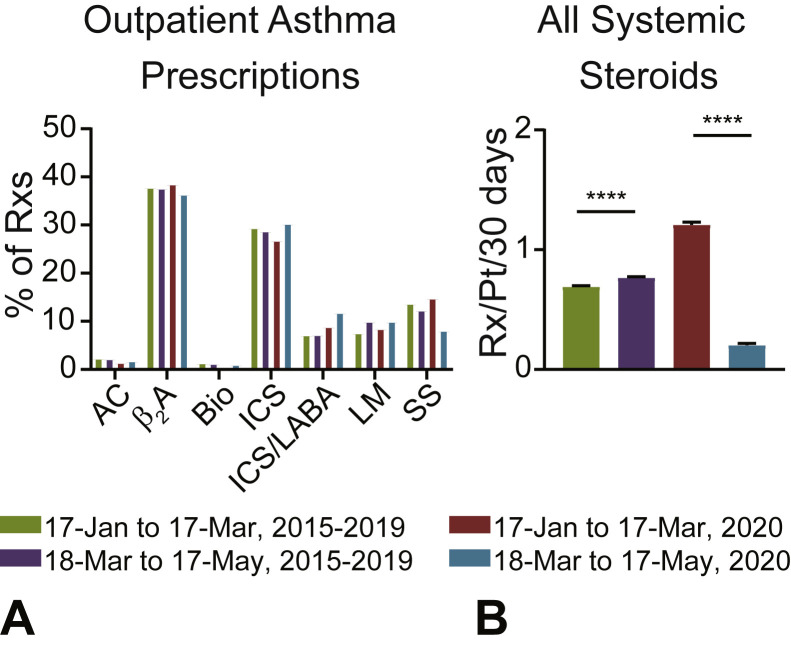
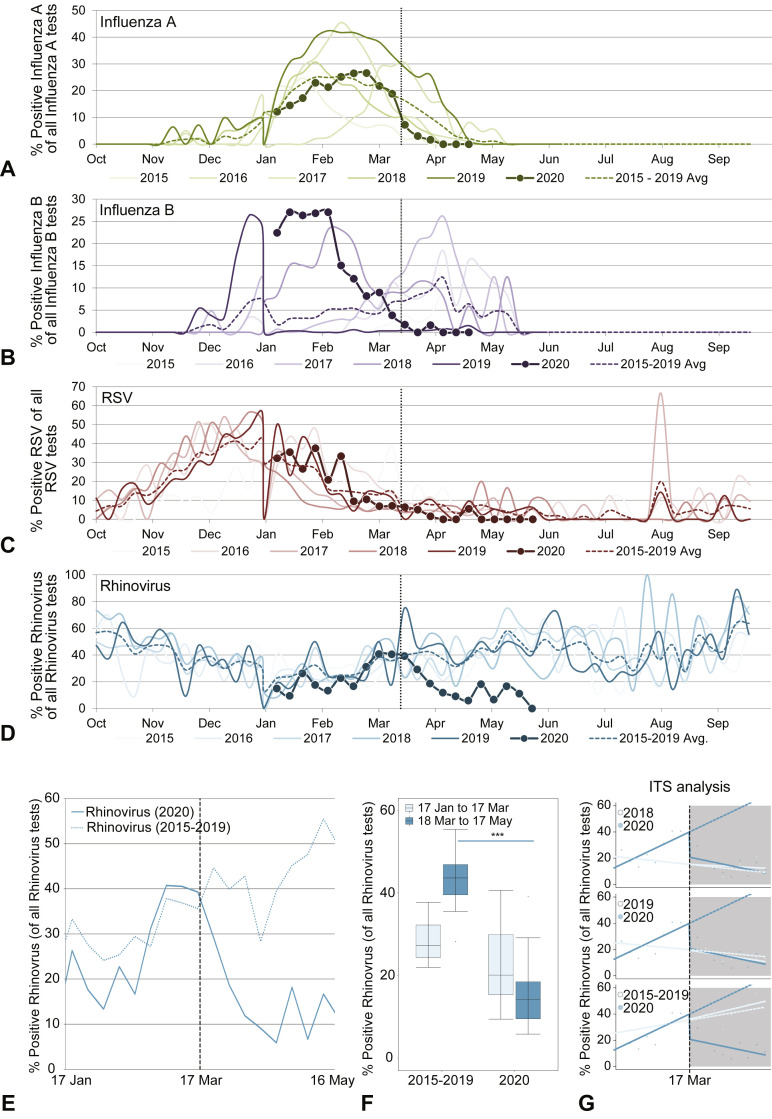
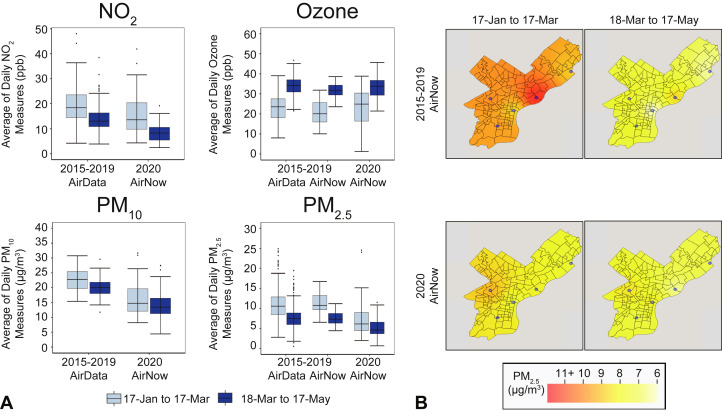
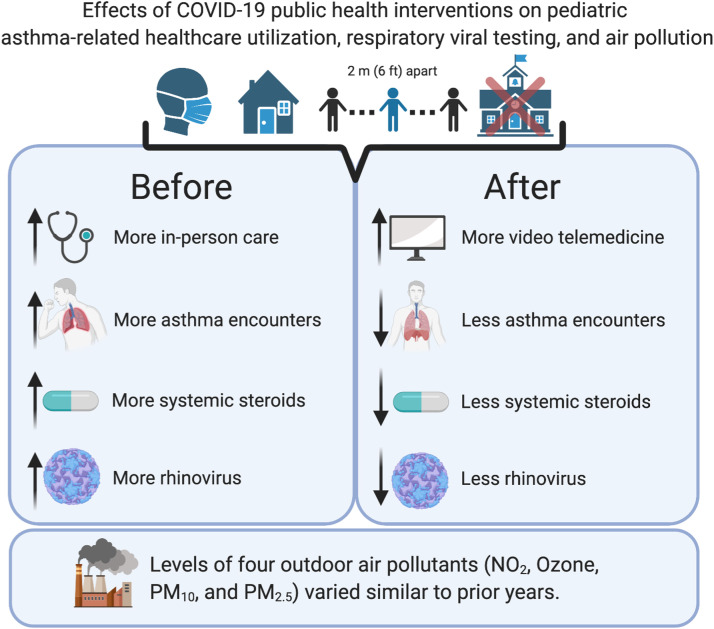
Results: After March 17, 2020, in-person asthma encounters decreased by 87% (outpatient) and 84% (emergency + inpatient). Video telemedicine, which was not previously available, became the most highly used asthma encounter modality (61% of all visits), and telephone encounters increased by 19%. Concurrently, asthma-related systemic steroid prescriptions and frequency of rhinovirus test positivity decreased, although air pollution levels did not substantially change, compared with historical trends.

Conclusions: The COVID-19 pandemic in Philadelphia was accompanied by changes in pediatric asthma health care delivery patterns, including reduced admissions and systemic steroid prescriptions. Reduced rhinovirus infections may have contributed to these patterns.

Keywords: Asthma; COVID-19; Pollution; Respiratory virus; Telemedicine.


Figures

Figure 1
Figure 1
Asthma encounters before and after public health interventions were enacted. (A) Daily asthma encounters from January 17 to May 17, 2020. Outpatient (primary + specialty care), telephone calls (telephone), hospital (ED + inpatient), and video (primary + specialty care) encounters are shown. Five-year historical averages (March 18 to May 17, 2015-2019) with 1 SD from the mean for outpatient (light green) or hospital (light purple) encounters shown. March 17 (black-dotted line) is the date Philadelphia prohibited the operation of nonessential businesses (effective 5 PM), and the date the first COVID-19 case was diagnosed at CHOP. (B) Historical and 2020 asthma encounters as a percentage of total. NA, Not applicable/available.
Figure 2
Figure 2
Asthma prescriptions before and after public health interventions were enacted. (A) Outpatient asthma-related prescriptions by medication class as a percentage of total (AC, anticholinergic; β2A, β2 agonists; Bio, biologic; ICS, inhaled corticosteroid; ICS + LABA, ICS with long-acting beta-agonist; LM, leukotriene modifier; Rxs, prescriptions; SS, systemic steroid). (B) Average number of systemic steroid prescriptions per patient per 30 days from any primary asthma encounter (outpatient, emergency, inpatient). Mean + SEM shown. Statistical comparison by paired Student t test. ∗∗∗∗P < .0001.
Figure 3
Figure 3
Changes in viral respiratory testing during the COVID-19 pandemic. Deidentified institutional ED virology testing results for the period 2015 to 2020 were accessed. (A-D) Time series plots comparing historical data (2015-2019) to the current year (2020) for rates of positive IFV-A (A), IFV-B (B), RV (C), and RSV (D) testing vs total tests for each virus. (E) For 2020, RV testing data from January 17 to March 17 and March 18 to May 17 were compared to averaged historical data from the same dates from 2015 to 2019. (F) Bar plots comparing the 2 time periods (January 17 to March 17 and March 18 to May 17) from the averaged historical time period (2015-2019) vs the current year (2020). (G) ITS plots comparing time series in 2018, 2019, and 2015 to 2019 averaged vs 2020. For each, the historical data are plotted in a lighter color. The dashed line after week 9 (March 17) is the predicted data based on the previous results, and the uninterrupted line is the actual data from 2020 (exact data also plotted as circles). Significance testing via ANOVA (F) and details in Table II for Figure 3, G. ITS, Interrupted time series.
Figure 4
Figure 4
Levels of 4 criteria air pollutants in Philadelphia before and after COVID-19 public health interventions were enacted. (A) Boxplots of averages of daily NO2, ozone, PM10, and PM2.5 measures corresponding to years 2020 and 2015 to 2019 sourced from AirData and AirNow for the 60-day time period before and after March 17, the day in 2020 when COVID-19 public health interventions were enacted in Philadelphia. None of the changes across March 17 were significantly different in the year 2020 compared with historical years. (B) Philadelphia raster layer maps showing daily average PM2.5 levels before and after the COVID-19 public health interventions were enacted for the year 2020 and the average of years 2015 to 2019 using AirNow data. The blue circles denote available air monitoring sites. ppb, Parts per billion.
Figure 5
Figure 5
Effects of public health interventions designed to limit viral transmission on asthma features. Public health interventions designed to limit viral transmission (masking, social distancing, school closures, etc) were associated with a restructuring of asthma care delivery including a reduction in in-person encounters and an increase in VTM-based care. Overall asthma encounters were reduced, as were systemic steroid prescriptions. Changes in RV infections, but not pollution levels, may have contributed to these trends.
Figure E1
Figure E1
Effects of public health interventions designed to limit viral transmission on viral testing. Deidentified institutional ED virology testing results for the period 2015 to 2020 were accessed. (A-D) Bar plots of rates of positive viral testing (IFV-A, IFV-B, RSV, and RV, respectively) from January 17 to March 17 vs March 18 to May 17 in the period 2015 to 2019 (and the average of that range) vs 2020.

References

    1. Dong E., Du H., Gardner L. An interactive web-based dashboard to track COVID-19 in real time. Lancet Infect Dis. 2020;20:533–534. - PMC - PubMed
    1. Chen N., Zhou M., Dong X., Qu J., Gong F., Han Y. Epidemiological and clinical characteristics of 99 cases of 2019 novel coronavirus pneumonia in Wuhan, China: a descriptive study. Lancet. 2020;395:507–513. - PMC - PubMed
    1. Department of Public Health Emergency Order Temporarily Prohibiting Operation of Non-Essential Businesses and Congregation of Persons to Prevent the Spread of 2019 Novel Coronavirus (Covid-19) https://www.phila.gov/media/20200322134942/HEALTH-ORDER-2-NON-ESSENTIAL-... Available from: Accessed May 1, 2020.
    1. Santoli J.M., Lindley M.C., DeSilva M.B., Kharbanda E.O., Daley M.F., Galloway L. Effects of the COVID-19 pandemic on routine pediatric vaccine ordering and administration—United States, 2020. MMWR Morb Mortal Wkly Rep. 2020;69:591–593. - PubMed
    1. Bramer C.A., Kimmins L.M., Swanson R., Kuo J., Vranesich P., Jacques-Carroll L.A. Decline in child vaccination coverage during the COVID-19 pandemic—Michigan Care Improvement Registry, May 2016–May 2020. MMWR Morb Mortal Wkly Rep. 2020;69:630–631. - PubMed

Publication types

MeSH terms