

Protoblock - A biological standard for formalin fixed samples
- PMID: 32828122
- PMCID: PMC7443293
- DOI: 10.1186/s40168-020-00901-1
Protoblock - A biological standard for formalin fixed samples
Abstract
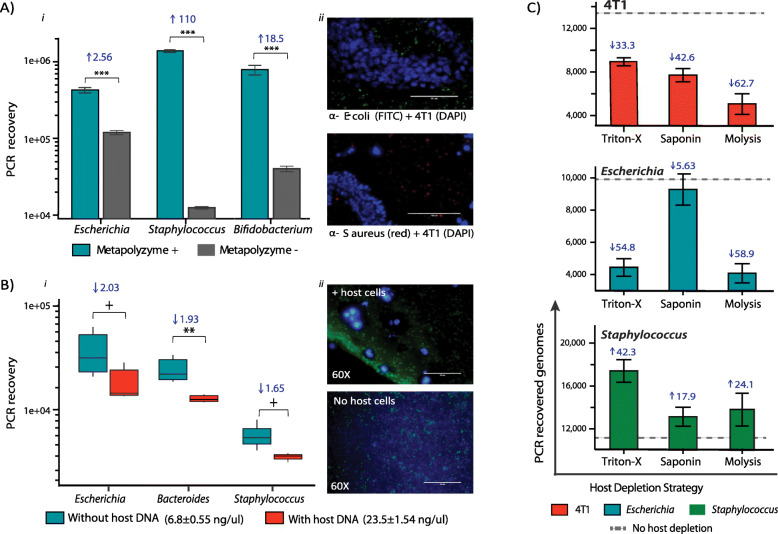
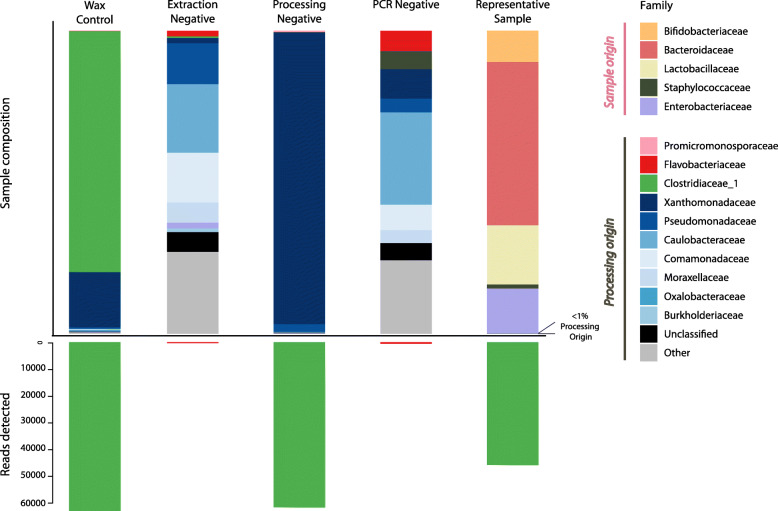
Background: Formalin-fixed, paraffin-embedded (FFPE) tissue is the gold standard in pathology tissue storage, representing the largest collections of patient material. Their reliable use for DNA analyses could open a trove of potential samples for research and are currently being recognised as a viable source material for bacterial analysis. There are several key features which limit bacterial-related data generation from this material: (i) DNA damage inherent to the fixing process, (ii) low bacterial biomass that increases the vulnerability to contamination and exacerbates the host DNA effects and (iii) lack of suitable DNA extraction methods, leading to data bias. The development and systematic use of reliable standards is a key priority for microbiome research. More than perhaps any other sample type, FFPE material urgently requires the development of standards to ensure the validity of results and to promote reproducibility.
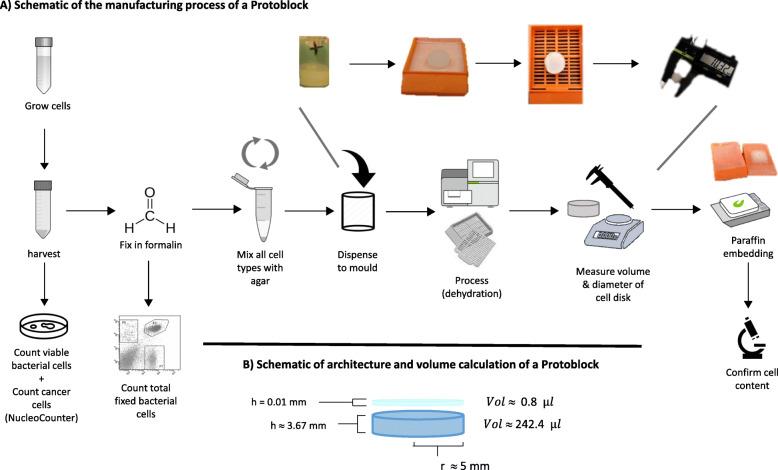
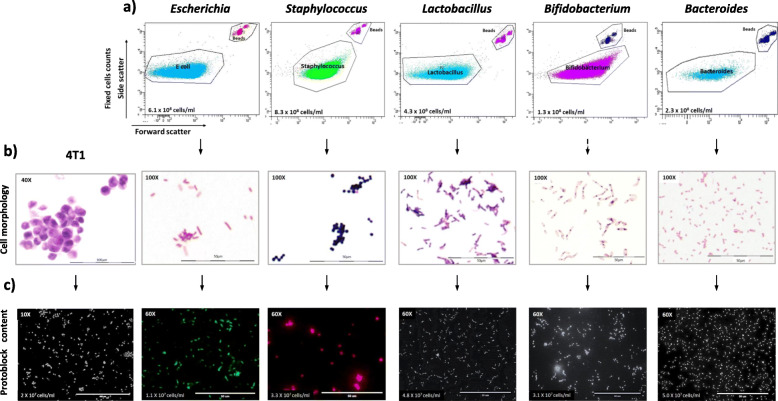
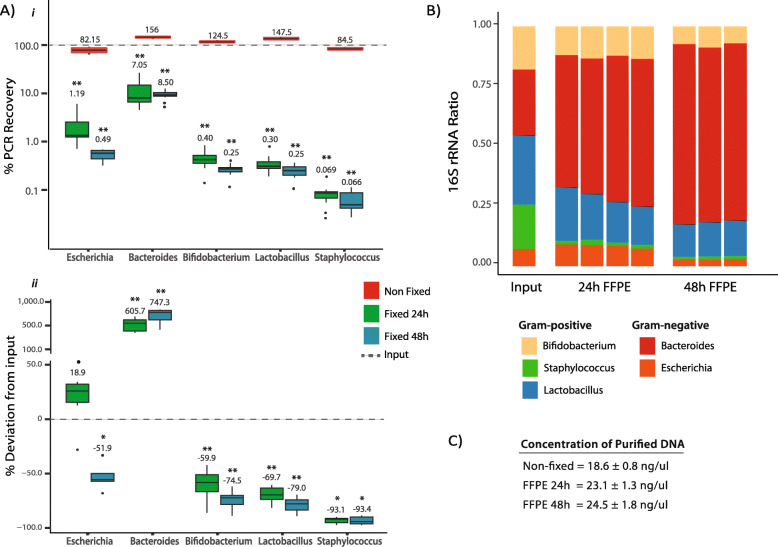
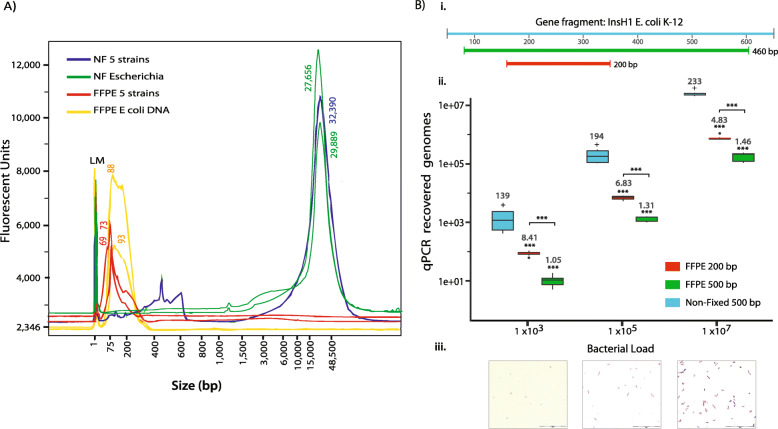
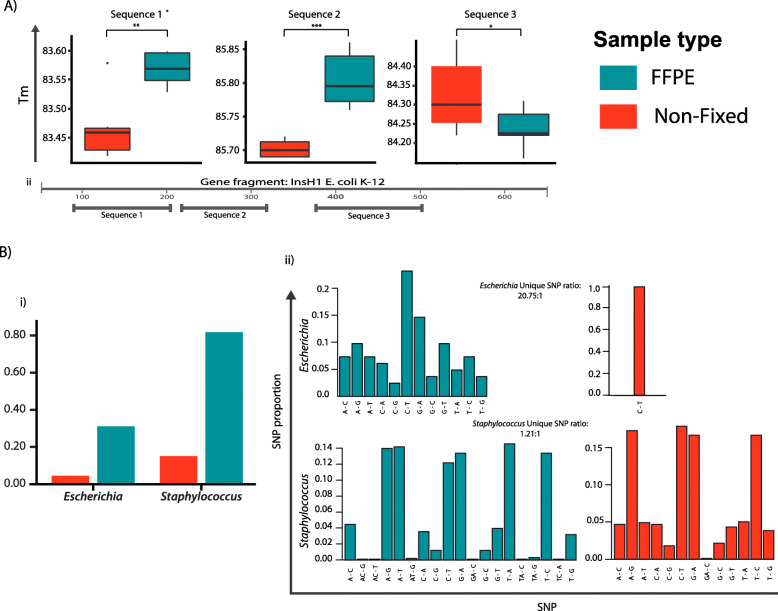
Results: To address these limitations and concerns, we have developed the Protoblock as a biological standard for FFPE tissue-based research and method optimisation. This is a novel system designed to generate bespoke mock FFPE 'blocks' with a cell content that is user-defined and which undergoes the same treatment conditions as clinical FFPE tissues. The 'Protoblock' features a mix of formalin-fixed cells, of known number, embedded in an agar matrix which is solidified to form a defined shape that is paraffin embedded. The contents of various Protoblocks populated with mammalian and bacterial cells were verified by microscopy. The quantity and condition of DNA purified from blocks was evaluated by qPCR, 16S rRNA gene amplicon sequencing and whole genome sequencing. These analyses validated the capability of the Protoblock system to determine the extent to which each of the three stated confounding features impacts on eventual analysis of cellular DNA present in FFPE samples.
Conclusion: The Protoblock provides a representation of biological material after FFPE treatment. Use of this standard will greatly assist the stratification of biological variations detected into those legitimately resulting from experimental conditions, and those that are artefacts of the processed nature of the samples, thus enabling users to relate the outputs of laboratory analyses to reality. Video Abstract.
Keywords: Bacteria; DNA; FFPE; Microbiome; Microscopy; PCR.
Conflict of interest statement
The authors declare that they have no competing interests.
Figures
Similar articles
-
Formalin-Fixed Paraffin-Embedded (FFPE) samples are not a beneficial replacement for frozen tissues in fetal membrane microbiota research.PLoS One. 2022 Mar 17;17(3):e0265441. doi: 10.1371/journal.pone.0265441. eCollection 2022. PLoS One. 2022. PMID: 35298530 Free PMC article.
-
Microbiome analysis from formalin-fixed paraffin-embedded tissues: Current challenges and future perspectives.J Microbiol Methods. 2022 May;196:106476. doi: 10.1016/j.mimet.2022.106476. Epub 2022 Apr 28. J Microbiol Methods. 2022. PMID: 35490989 Review.
-
Using postmortem formalin fixed paraffin-embedded tissues for molecular testing of sudden cardiac death: A cautionary tale of utility and limitations.Forensic Sci Int. 2020 Mar;308:110177. doi: 10.1016/j.forsciint.2020.110177. Epub 2020 Jan 30. Forensic Sci Int. 2020. PMID: 32155531
-
Technical challenges regarding the use of formalin-fixed paraffin embedded (FFPE) tissue specimens for the detection of bacterial alterations in colorectal cancer.BMC Microbiol. 2021 Oct 29;21(1):297. doi: 10.1186/s12866-021-02359-z. BMC Microbiol. 2021. PMID: 34715774 Free PMC article.
-
Making Formalin-Fixed, Paraffin Embedded Blocks.Methods Mol Biol. 2019;1897:253-268. doi: 10.1007/978-1-4939-8935-5_22. Methods Mol Biol. 2019. PMID: 30539450 Review.
Cited by
-
Understanding and harnessing triple-negative breast cancer-related microbiota in oncology.Front Oncol. 2022 Nov 24;12:1020121. doi: 10.3389/fonc.2022.1020121. eCollection 2022. Front Oncol. 2022. PMID: 36505861 Free PMC article. Review.
-
Biopsy bacterial signature can predict patient tissue malignancy.Sci Rep. 2021 Sep 17;11(1):18535. doi: 10.1038/s41598-021-98089-3. Sci Rep. 2021. PMID: 34535726 Free PMC article.
-
Identification of Potential Genomic Alterations and the circRNA-miRNA-mRNA Regulatory Network in Primary and Recurrent Synovial Sarcomas.Front Mol Biosci. 2021 Aug 13;8:707151. doi: 10.3389/fmolb.2021.707151. eCollection 2021. Front Mol Biosci. 2021. PMID: 34485383 Free PMC article.
-
Formalin-Fixed Paraffin-Embedded (FFPE) samples are not a beneficial replacement for frozen tissues in fetal membrane microbiota research.PLoS One. 2022 Mar 17;17(3):e0265441. doi: 10.1371/journal.pone.0265441. eCollection 2022. PLoS One. 2022. PMID: 35298530 Free PMC article.
-
Challenges for pathologists in implementing clinical microbiome diagnostic testing.J Pathol Clin Res. 2024 Sep;10(5):e70002. doi: 10.1002/2056-4538.70002. J Pathol Clin Res. 2024. PMID: 39289163 Free PMC article. Review.
References
Publication types
MeSH terms
Substances
LinkOut - more resources
Full Text Sources
Molecular Biology Databases
