. 2020 Nov 15:222:117299.
doi: 10.1016/j.neuroimage.2020.117299. Epub 2020 Aug 21.

Dispersion of functional gradients across the adult lifespan

Affiliations

Dispersion of functional gradients across the adult lifespan

Richard A I Bethlehem et al. Neuroimage. .

Abstract

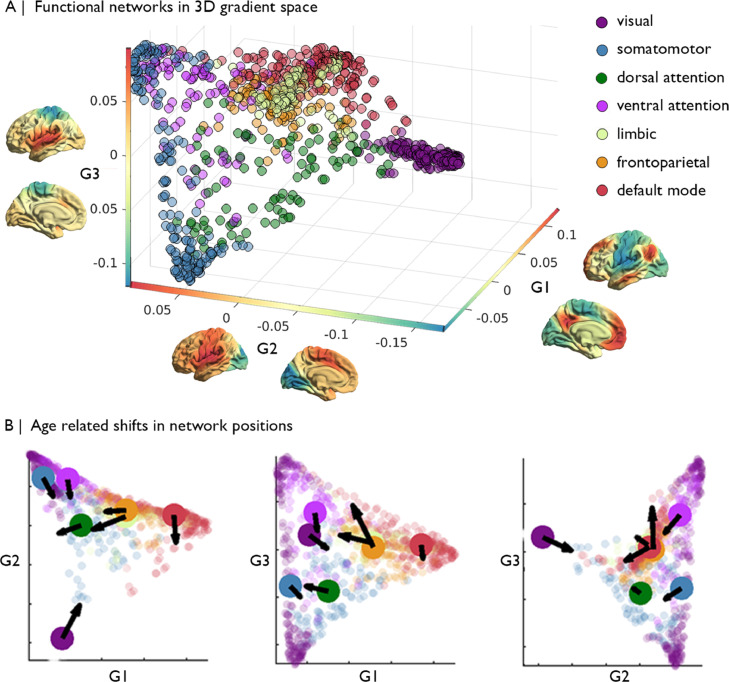
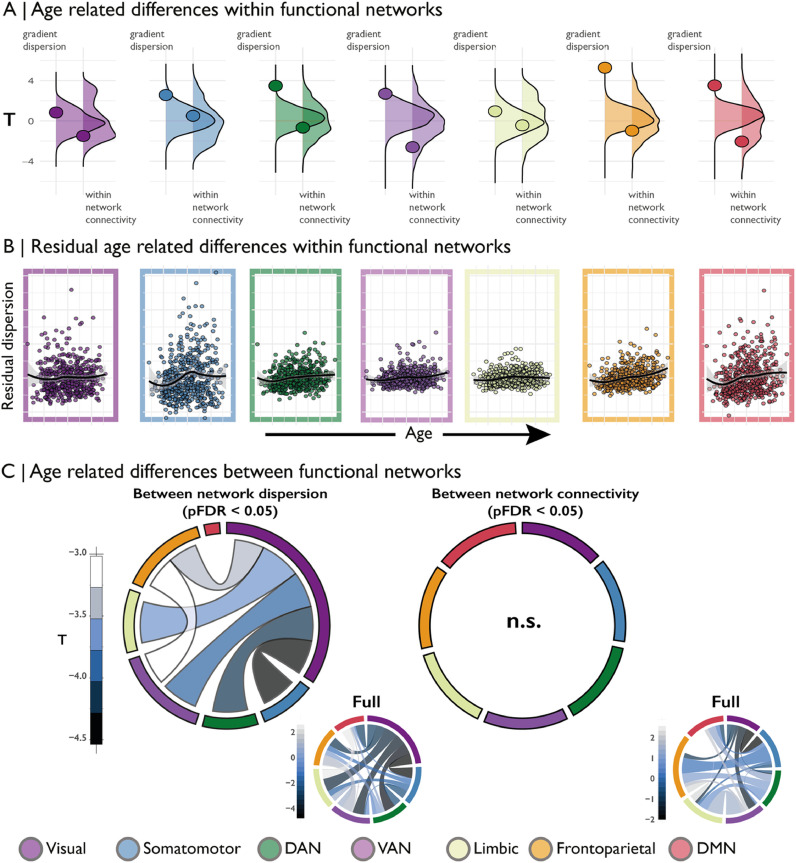
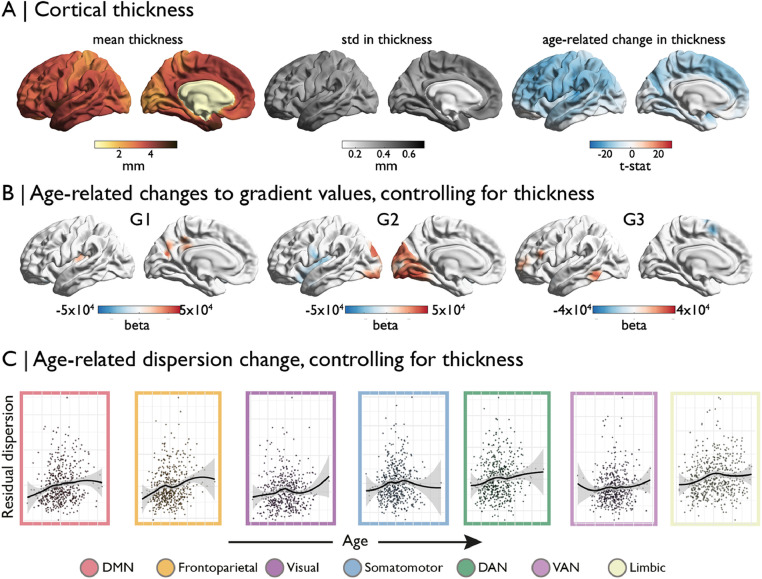
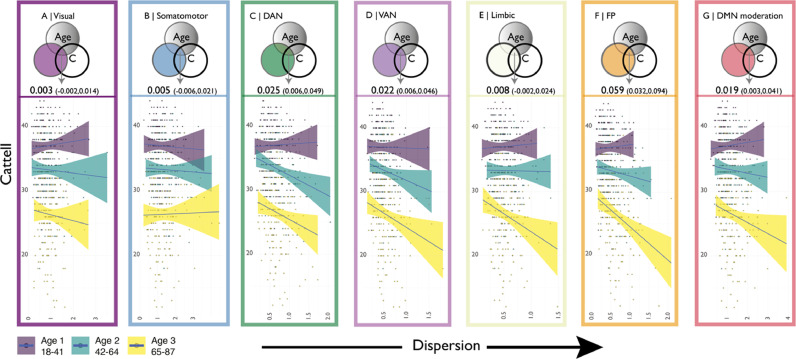
Ageing is commonly associated with changes to segregation and integration of functional brain networks, but, in isolation, current network-based approaches struggle to elucidate changes across the many axes of functional organisation. However, the advent of gradient mapping techniques in neuroimaging provides a new means of studying functional organisation in a multi-dimensional connectivity space. Here, we studied ageing and behaviourally-relevant differences in a three-dimensional connectivity space using the Cambridge Centre for Ageing Neuroscience cohort (n = 643). Building on gradient mapping techniques, we developed a set of measures to quantify the dispersion within and between functional communities. We detected a strong shift of the visual network across the adult lifespan from an extreme to a more central position in the 3D gradient space. In contrast, the dispersion distance between transmodal communities (dorsal attention, ventral attention, frontoparietal and default mode) did not change. However, these communities themselves were increasingly dispersed with increasing age, reflecting more dissimilar functional connectivity profiles within each community. Increasing dispersion of frontoparietal, attention and default mode networks, in particular, were associated negatively with cognition, measured by fluid intelligence. By using a technique that explicitly captures the ordering of functional systems in a multi-dimensional hierarchical framework, we identified behaviorally-relevant age-related differences of within and between network organisation. We propose that the study of functional gradients across the adult lifespan could provide insights that may facilitate the development of new strategies to maintain cognitive ability across the lifespan in health and disease.


Figures

Fig 1
Fig. 1
Functional gradients across healthy adulthood. (A) The first three gradients projected into a 3-dimensional gradient space and coloured by its Yeo network classification, with each functional gradient projected onto the cortical surface next to the corresponding axis. (B) Age-related shift in the centroid of each Yeo network in gradient space. Arrows reflect the direction of the centroid shift with higher age and are scaled by effect size.
Fig 2
Fig. 2
(A) Age-related difference (t-statistic) in within network dispersion and within network connectivity for each Yeo network. Underlying density plots show the null distributions of t-statistics derived from spin permutations. Positive t-values signify increased network dispersion with age. (B) Residuals of the dispersion model (including controls for sex, motion and within network connectivity) against age residuals for the same model for each Yeo network. (C) Between network dispersion and between network connectivity. Network borders are scaled according to the size of the total effect from that community (e.g. the visual network is largest in the left panel as most significant between network dispersion involves the visual network). Insert panels on the right show the full between network pattern for all connections including non-significant ones.
Fig 3
Fig. 3
(A) Morphological changes in cortical thickness are widespread and uniformly negative. (B) Age-related changes to the gradients are not influenced by this cortical atrophy, (C) nor are the multi-dimensional changes in gradient dispersion.
Fig 4
Fig. 4
Relationship between network dispersion and age-related cognitive decline. Top panels A-G show the schematic percentage overlap between age, dispersion and Cattell of each network from commonality analysis. Lower panels show visualize effects in moderation analysis, i.e. how this the association between dispersion and Cattell varied in three bins of the total age-range.

References

    1. Alexander-Bloch A.F., Shou H., Liu S., Satterthwaite T.D., Glahn D.C., Shinohara R.T., Vandekar S.N., Raznahan A. On testing for spatial correspondence between maps of human brain structure and function. Neuroimage. 2018;178:540–551. - PMC - PubMed
    1. Andrews-Hanna J.R., Snyder A.Z., Vincent J.L., Lustig C., Head D., Raichle M.E., Buckner R.L. Disruption of large-scale brain systems in advanced aging. Neuron. 2007;56:924–935. - PMC - PubMed
    1. Bahrami M., Lyday R.G., Casanova R., Burdette J.H., Simpson S.L., Laurienti P.J. Using low-dimensional manifolds to map relationships between dynamic brain networks. Front. Hum. Neurosci. 2019;13 - PMC - PubMed
    1. Beard J.R., Officer A.M., Cassels A.K. The world report on ageing and health. The Gerontol. 2016;56:S163–S166. - PubMed
    1. Betzel R.F., Byrge L., He Y., Goñi J., Zuo X.N., Sporns O. Changes in structural and functional connectivity among resting-state networks across the human lifespan. Neuroimage. 2014;102(Pt 2):345–357. - PubMed

Publication types