. 2020 Sep:36:101671.
doi: 10.1016/j.redox.2020.101671. Epub 2020 Aug 7.

HIF-1α-BNIP3-mediated mitophagy in tubular cells protects against renal ischemia/reperfusion injury

Affiliations

HIF-1α-BNIP3-mediated mitophagy in tubular cells protects against renal ischemia/reperfusion injury

Zong-Jie Fu et al. Redox Biol. 2020 Sep.

Abstract

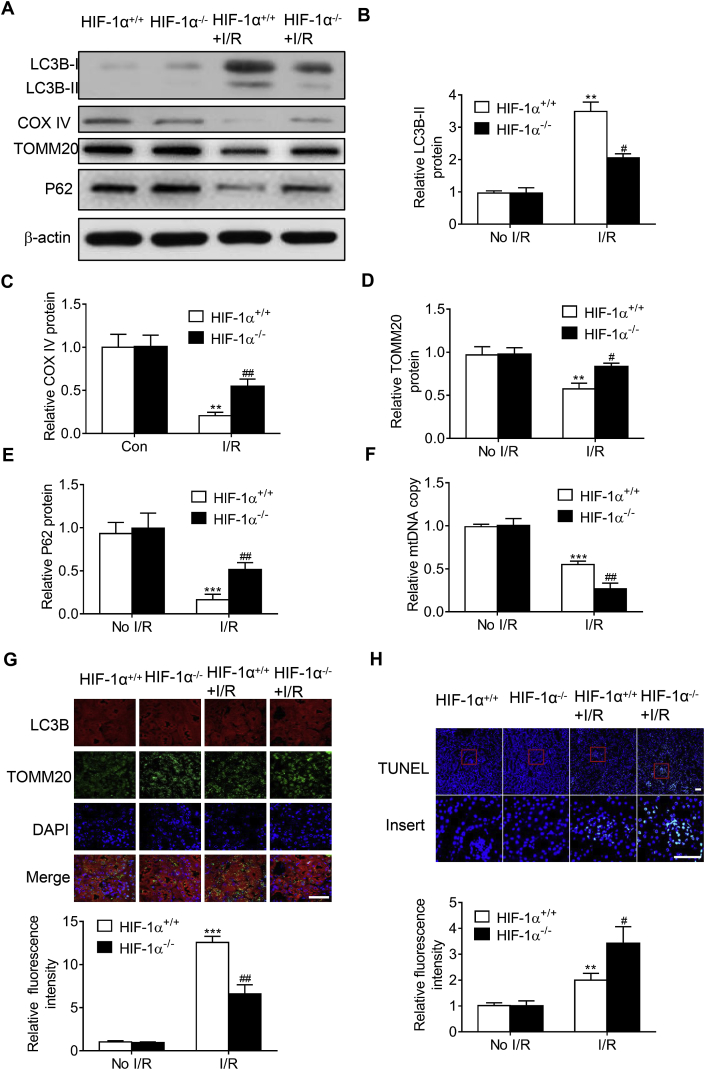
In the present study, we hypothesized that hypoxia-inducible factor 1α (HIF-1α)-mediated mitophagy plays a protective role in ischemia/reperfusion (I/R)-induced acute kidney injury (AKI). Mitophagy was evaluated by measuring the changes of mitophagy flux, mitochondria DNA copy number, and the changes of mitophagy-related proteins including translocase of outer mitochondrial membrane 20 (TOMM20), cytochrome c oxidase IV (COX IV), microtubule-associated protein 1 light chain 3B (LC3B), and mitochondria adaptor nucleoporin p62 in HK2 cells, a human tubular cell line. Results show that HIF-1α knockout significantly attenuated hypoxia/reoxygenation (H/R)-induced mitophagy, aggravated H/R-induced apoptosis, and increased the production of reactive oxygen species (ROS). Similarly, H/R induced significantly increase in Bcl-2 19-kDa interacting protein 3 (BNIP3), a downstream regulator of HIF-1α. Notably, BNIP3 overexpression reversed the inhibitory effect of HIF-1α knockout on H/R-induced mitophagy, and prevented the enhancing effect of HIF-1α knockout on H/R-induced apoptosis and ROS production. For in vivo study, we established HIF-1αflox/flox; cadherin-16-cre mice in which tubular HIF-1α was specifically knockout. It was found that tubular HIF-1α knockout significantly inhibited I/R-induced mitophagy, and aggravated I/R-induced tubular apoptosis and kidney damage. In contrast, adenovirus-mediated BNIP3 overexpression significantly reversed the decreased mitophagy, and prevented enhanced kidney damage in tubular HIF-1α knockout mice with I/R injury. In summary, our study demonstrated that HIF-1α-BNIP3-mediated mitophagy in tubular cells plays a protective role through inhibition of apoptosis and ROS production in acute kidney damage.

Keywords: Acute kidney injury; Bcl-2 19-kDa interacting protein 3; Hypoxia-inducible factor 1α; Mitophagy; Tubular cells.


Conflict of interest statement

None.

Figures

Fig. 1
Fig. 1
H/R induced mitophagy in HK2 cells. A, A timeline scheme showing the procedures of H/R. After HK2 cells were cultured in serum-free culture medium for 24h, they were cultured in hypoxic (24h) followed by culture in reoxygenation condition for the time indicated. Cells cultured in culture medium with 10% FBS without H/R were used as control. Representative Western blot images (B) and summarized data (C, D, E, F, G, H) showing the changes of protein level of HIF-1α, BNIP3, autophagy-related protein LC3B and mitophagy-related proteins including COX IV, TOMM20, and p62 in HK2 cells with hypoxia (24h)/reoxygenation (0.5, 1.5, 3, 6, 12, 24, 48h). n = 9. *P < 0.05, ***P < 0.001 vs control for HIF-1α, BNIP3, LC3B-II, COX IV, TOMM20, and p62 respectively.
Fig. 2
Fig. 2
HIF-1α knockout reduced H/R-induced mitophagy in HK2 cells. Representative Western blot images (A) and summarized data (B, C, D, E) showing the changes of LC3B-II, COX IV, TOMM20, and p62 in H/R-treated cells with or without HIF-1α siRNA. F, Summarized data showing the changes of mtDNA copy numberin H/R-treated cells with or without HIF-1α siRNA. n = 9. **P < 0.01, ***P < 0.001 vs scramble group without H/R; #P < 0.05, ###P < 0.001 vs scramble group with H/R.
Fig. 3
Fig. 3
BNIP3 overexpression reversed the decreased H/R-induced mitophagy. Representative Western blot images (A) and summarized data (B) showing the inhibitory effect of HIF-1α siRNA on H/R-induced BNIP3 expression. C, Representative Western blot images (C) and summarized data (D, E, F, G) showing that BNIP3 overexpression reversed the changes of LC3B, COX IV, TOMM20 and p62 in H/R-treated cells. H, Summarized data showing that BNIP3 overexpression reversed the changes of mtDNA copy number in H/R-treated cells. n = 9. **P < 0.01, ***P < 0.001 vs scram group without H/R; ###P < 0.001 vs scramble group with H/R in A&B. **P < 0.01 vs vector group without H/R; #P < 0.05, ##P < 0.01, ###P < 0.001 vs vector group with H/R in C&E.
Fig. 4
Fig. 4
HIF-1α-BNIP3 signaling pathway contributes to mitophagosome formation in renal tubular cells in confocal assay. Representative immunofluorescence images (A) and summarized data (C) showing the inhibitory effect of HIF-1α siRNA on H/R-induced mitophagosome formation as indicated by the colocalization of LC3B with Mitotracker-Green. Representative immunofluorescence images (B) and summarized data (D) showing that BNIP3 overexpression reversed the inhibitory effect HIF-1α siRNA on H/R-induced mitophagosome formation as indicated by the colocalization of LC3B with Mitotracker-Green. Bar = 10 μm n = 9. *P < 0.05, **P < 0.01 vs scramble group without H/R; #P < 0.05, ###P < 0.001 vs scramble group with H/R. **P < 0.01, ***P < 0.001 vs scram group without H/R; ###P < 0.001 vs scramble group with H/R. (For interpretation of the references to colour in this figure legend, the reader is referred to the Web version of this article.)
Fig. 5
Fig. 5
HIF-1α-BNIP3 signaling pathway mediated H/R-induced mitophagy flux in HK2 cells. A, Representative immunofluorescence images showing the inhibitory effect of HIF-1α siRNA on H/R-induced mitophagy flux in HK2 cells. Cells were stained with mito-Tracker Green, and mitophagy flux was defined as the inhibitory portion of Baf. B, Summarized data showing the inhibitory effect of HIF-1α siRNA on H/R-induced mitophagy flux in HK2 cells. C, Summarized data showing the effect of HIF-1α siRNA on mitochondria mass as indicated by the changes of.mito-Tracker Green fluorescence. n = 5–6. ***P < 0.001 vs control without H/R group; ###P < 0.001 vs siHIF-1α+BNIP3 overexpression with H/R group. (For interpretation of the references to colour in this figure legend, the reader is referred to the Web version of this article.)
Fig. 6
Fig. 6
HIF-1α-BNIP3 signaling pathway attenuated H/R-induced apoptosis and ROS production in HK2 cells. A, Representative immunofluorescence images (upper panel) and summarized data (lower panel) showing the effect of HIF-1α siRNA on H/R-induced tubular apoptosis in TUNEL assay. B, Representative Western blot images (upper panel) and summarized data (lower panel) showing the effect of HIF-1α siRNA on H/R-induced CC3 increase. C, Representative immunofluorescence images (upper panel) and summarized data (lower panel) showing the effect of HIF-1α siRNA on H/R-induced ROS production. D, Representative immunofluorescence images (upper panel) and summarized data (lower panel) showing the effect of BNIP3 overexpression on H/R-induced tubular apoptosis in TUNEL assay. E, Representative Western blot images (upper panel) and summarized data (lower panel) showing the effect of BNIP3 overexpression on H/R-induced CC3 increase. F, Representative immunofluorescence images (upper panel) and summarized data (lower panel) showing the effect of BNIP3 overexpression on H/R-induced ROS production. Bar = 50 μm in A&D, Bar = 100 μm in C&F. n = 9–10. **P < 0.01vs scramble group without H/R; ##P < 0.01, ###P < 0.001 vs scramble group with H/R in A-C. ***P < 0.001 vs vector group without H/R; ###P < 0.001 vs vector group with H/R in D-F.
Fig. 7
Fig. 7
Specific tubular HIF-1α knockout aggravated I/R-induced kidney damage. A, A timeline scheme showing the procedures of I/R. Mice were subjected to 30 min of renal ischemia (clapping bilateral renal pedicles) followed by reperfusion for different periods (2, 6, 12, 24 or 72h). Mice received the same treatment without renal pedicle clamping were used as control. Representative renal H&E staining images (B) (upper panel, 10x, lower panel 40x) and summarized tubular damage score (C) in HIF-1α+/+ and HIF-1α−/- mice with or without ischemia (30min)/reperfusion (2, 6, 12, 24 or 72h). D, Summarized data showing the effect of tubular HIF-1α knockout on the changes of SCr in mice with ischemia (30min)/reperfusion (2, 6, 12, 24 or 72h). Bar = 100 μm n = 6. **P < 0.01, ***P < 0.001 vs HIF-1α+/+ group without I/R; #P < 0.05, ##P < 0.01vs HIF-1α−/- group with the same reperfusion duration in C. *P < 0.05, **P < 0.01, ***P < 0.001 vs other groups with the same reperfusion duration in D.
Fig. 8
Fig. 8
Specific tubular HIF-1α knockout decreased mitophagosome formation in TEM. A, Representative TEM images of kidney tissues in mice with or without ischemia (30min)/reperfusion (2, 6, 12, 24 or 72h). Summarized data showing the effect of tubular HIF-1α knockout on mitophagosome formation (B) and the content of damaged mitochondria (C) in kidney tissue in mice with ischemia (30min)/reperfusion (2, 6, 12, 24 or 72h). Black arrows, normal mitochondria; green arrows, damaged mitochondria; red arrows, cup-like bilayer inclusion body; white arrows, autophagosome; yellow arrows, mitophagosome; purple arrows, apoptotic bodies; blue arrows, remaining vacuoles after digestion by autophagosome. Bar = 1 μm n = 6. ***P < 0.001 vs HIF-1α+/+ group without I/R; ##P < 0.01, ###P < 0.001vs HIF-1α−/- group with the same reperfusion duration. (For interpretation of the references to colour in this figure legend, the reader is referred to the Web version of this article.)
Fig. 9
Fig. 9
I/R induced significant autophagy and mitophagy in mice in Western blot assay. Representative Western blot images (A) and summarized data (B, C, D, E, F, G) showing the time-dependent effect of reperfusion on the expression of HIF-1α, BNIP3, LC3B-II, COX IV and TOMM20, and p62 in the kidney. I, Summarized data showing the time-dependent effect of reperfusion on mtDNA copy number in the kidney. n = 6. *P < 0.05, **P < 0.01, ***P < 0.001 vs control for HIF-1α, BNIP3, LC3B-II, COX IV, TOMM20, and p62.
Fig. 10
Fig. 10
Specific renal tubular HIF-1α knockout decreased mitophagy and aggravated I/R-induced apoptosis. Representative Western blot images (A) and summarized data (B, C, D, E) showing the inhibitory effect of tubular HIF-1α knockout on I/R-induced changes in LC3B, TOMM20 and BNIP3 in the kidney. F, Summarized data showing the inhibitory effect of tubular HIF-1α knockout on I/R-induced changes in mtDNA copy number in the kidney. G, Representative fluorescence images (upper panel) and summarized data (lower panel) showing the inhibitory effect of tubular HIF-1α knockout on I/R-induced mitophagosome formation. H, Representative fluorescence images (upper panel) and summarized data (lower panel) showing the inhibitory effect of tubular HIF-1α knockout on I/R-induced TUNEL in kidney. Bar = 50 μm in G, bar = 100 μm in H. n = 6. **P < 0.01, ***P < 0.001 vs HIF-1α+/+ group without I/R; #P < 0.05, ##P < 0.01vs HIF-1α+/+ group with I/R.
Fig. 11
Fig. 11
BNIP3 overexpression improved renal function and increased mitophagy in tubular HIF-1α knockout mice with I/R. A, Summarized data showing the effect of BNIP3 overexpression on the changes of SCr in tubular HIF-1α knockout mice with I/R. B, Representative H&E images (upper panel) and summarized tubular damage score (lower panel) showing that BNIP3 overexpression reversed the aggravated tubular damage in tubular HIF-1α knockout mice with I/R. C, Representative TEM images (upper panel) and summarized data (middle and lower panels) showing that BNIP3 overexpression increased the mitophagosome formation and decreased the accumulation of damaged mitochondria in kidney from tubular HIF-1α knockout mice with I/R. Representative Western blot images (D) and summarized data (E) showing that BNIP3 overexpression reversed the effect of tubular HIF-1α knockout on the expression of LC3B, COX IV, TOMM20, p62 and CC3 in the kidney from tubular HIF-1α knockout mice with I/R. F, Summarized data showing that BNIP3 overexpression inhibited the enhancing effect of tubular HIF-1α knockout on I/R-induced mtDNA accumulation in the kidney. Representative fluorescence images (G) and summarized data (H) showing that BNIP3 overexpression reversed the enhancing effect of tubular HIF-1α knockout on I/R-induced tubular apoptosis in TUNEL assay. Bar = 100 μm in B, bar = 1 μm in C, bar = 100 μm in J. n = 6. *P < 0.05, **P < 0.01 vs HIF-1α+/+ group without I/R; #P < 0.05 vs HIF-1α+/+ group with I/R.
Fig. 12
Fig. 12
Scheme showing that HIF-1α-BNIP3-mediated mitophagy in tubular cells protects I/R-induced AKD by inhibiting cell apoptosis and ROS production.

References

    1. Bellomo R., Kellum J.A., Ronco C. Acute kidney injury. Lancet. 2012;380(9843):756–766. - PubMed
    1. Sancho-Martinez S.M., Lopez-Novoa J.M., Lopez-Hernandez F.J. Pathophysiological role of different tubular epithelial cell death modes in acute kidney injury. Clin. kidney J. 2015;8(5):548–559. - PMC - PubMed
    1. Duann P., Lianos E.A., Ma J., Lin P.H. Autophagy, innate immunity and tissue repair in acute kidney injury. Int. J. Mol. Sci. 2016;17(5) - PMC - PubMed
    1. Malek M., Nematbakhsh M. Renal ischemia/reperfusion injury; from pathophysiology to treatment. J. Ren. Inj. Prev. 2015;4(2):20–27. - PMC - PubMed
    1. Pastor-Soler N.M., Sutton T.A., Mang H.E., Kinlough C.L., Gendler S.J., Madsen C.S. Muc1 is protective during kidney ischemia-reperfusion injury. Am. J. Physiol. Ren. Physiol. 2015;308(12):F1452–F1462. - PMC - PubMed

Publication types