. 2020 Nov;598(22):5091-5108.
doi: 10.1113/JP280425. Epub 2020 Sep 9.

Distinct features of calcium handling and β-adrenergic sensitivity in heart failure with preserved versus reduced ejection fraction

Affiliations

Distinct features of calcium handling and β-adrenergic sensitivity in heart failure with preserved versus reduced ejection fraction

Peter J Kilfoil et al. J Physiol. 2020 Nov.

Abstract

Key points: Heart failure (HF), the leading cause of death in developed countries, occurs in the setting of reduced (HFrEF) or preserved (HFpEF) ejection fraction. Unlike HFrEF, there are no effective treatments for HFpEF, which accounts for ∼50% of heart failure. Abnormal intracellular calcium dynamics in cardiomyocytes have major implications for contractility and rhythm, but compared to HFrEF, very little is known about calcium cycling in HFpEF. We used rat models of HFpEF and HFrEF to reveal distinct differences in intracellular calcium regulation and excitation-contraction (EC) coupling. While HFrEF is characterized by defective EC coupling at baseline, HFpEF exhibits enhanced coupling fidelity, further aggravated by a reduction in β-adrenergic sensitivity. These differences in EC coupling and β-adrenergic sensitivity may help explain why therapies that work in HFrEF are ineffective in HFpEF.

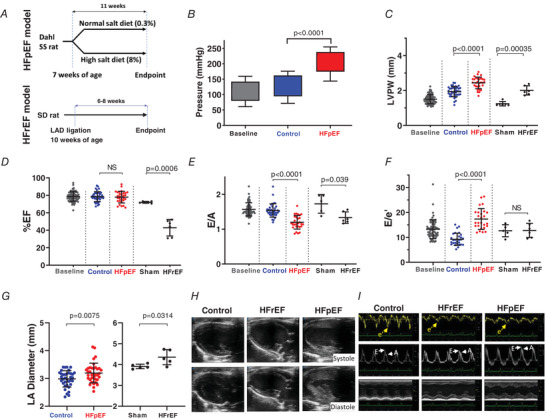
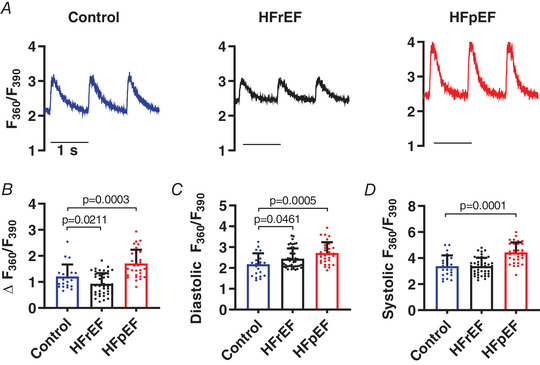
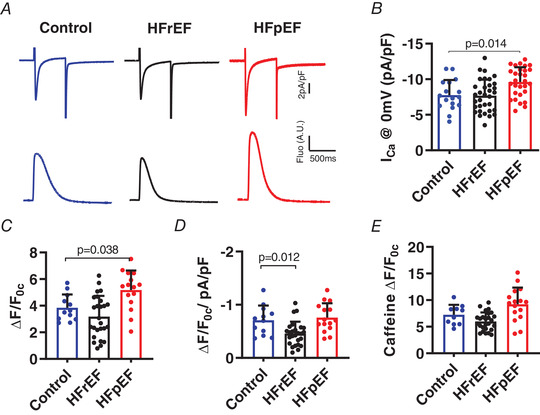
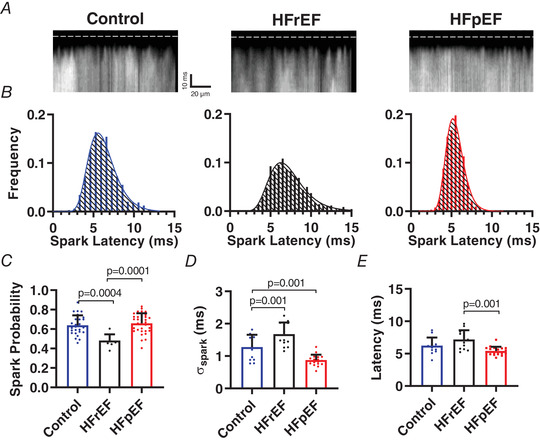
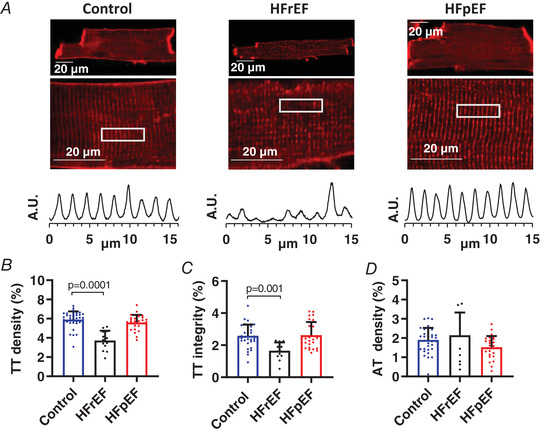
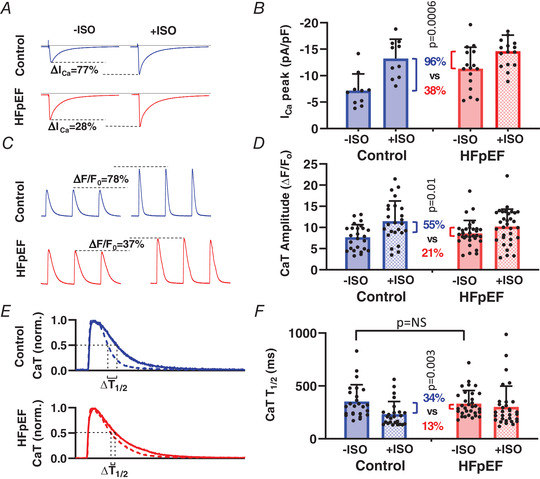
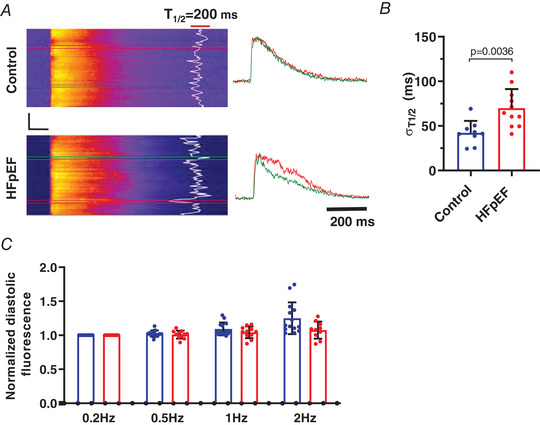
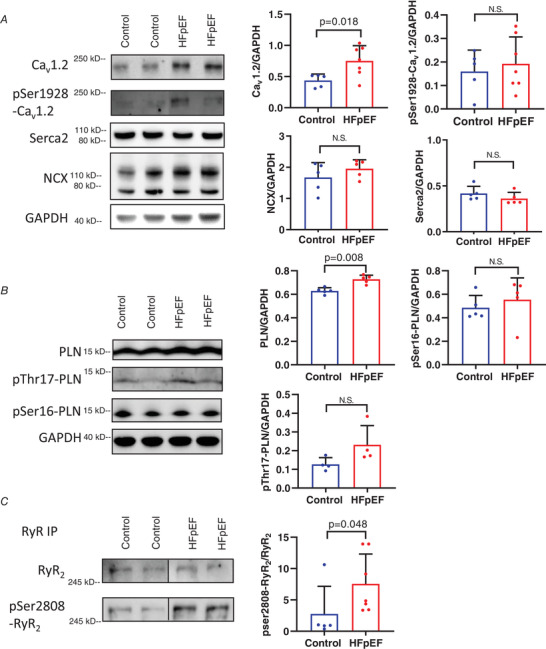
Abstract: Heart failure with reduced or preserved ejection fraction (respectively, HFrEF and HFpEF) is the leading cause of death in developed countries. Although numerous therapies improve outcomes in HFrEF, there are no effective treatments for HFpEF. We studied phenotypically verified rat models of HFrEF and HFpEF to compare excitation-contraction (EC) coupling and protein expression in these two forms of heart failure. Dahl salt-sensitive rats were fed a high-salt diet (8% NaCl) from 7 weeks of age to induce HFpEF. Impaired diastolic relaxation and preserved ejection fraction were confirmed in each animal echocardiographically, and clinical signs of heart failure were documented. To generate HFrEF, Sprague-Dawley (SD) rats underwent permanent left anterior descending coronary artery ligation which, 8-10 weeks later, led to systolic dysfunction (verified echocardiographically) and clinical signs of heart failure. Calcium (Ca2+ ) transients were measured in isolated cardiomyocytes under field stimulation or patch clamp. Ultra-high-speed laser scanning confocal imaging captured Ca2+ sparks evoked by voltage steps. Western blotting and PCR were used to assay changes in EC coupling protein and RNA expression. Cardiomyocytes from rats with HFrEF exhibited impaired EC coupling, including decreased Ca2+ transient (CaT) amplitude and defective couplon recruitment, associated with transverse (t)-tubule disruption. In stark contrast, HFpEF cardiomyocytes showed saturated EC coupling (increased ICa , high probability of couplon recruitment with greater Ca2+ release synchrony, increased CaT) and preserved t-tubule integrity. β-Adrenergic stimulation of HFpEF myocytes with isoprenaline (isoproterenol) failed to elicit robust increases in ICa or CaT and relaxation kinetics. Fundamental differences in EC coupling distinguish HFrEF from HFpEF.

Keywords: HFpEF; calcium; excitation-contraction coupling; β-adrenergic stimulation.


Figures

Figure 1
Figure 1. Generation and characteristics of rat models of HFpEF and HFrEF
A, HFpEF model: Dahl salt‐sensitive (SS) rats were fed a high‐salt diet (8% NaCl) or a normal‐salt diet (0.3% NaCl) starting at 7 weeks of age. We obtained echocardiograms at baseline and 11 weeks later at endpoint immediately before use in experiments. HFrEF model: Sprague‐Dawley (SD) rats underwent permanent ligation of the left anterior descending (LAD) coronary artery or sham procedure. Echocardiograms were performed at baseline and endpoint. B, systolic and diastolic blood pressures measured using tail cuff photoplethysmography. Top of filled bar indicates mean systolic pressure (+ SD), bottom of bar indicates mean diastolic pressure (− SD). C–G, echo‐derived measures including left ventricular (LV) posterior wall thickness at diastole (LVPW), ejection fraction (%EF), E wave to A wave (E/A) ratio, E wave to e′ (E/e′) ratio, and left atrial (LA) diameter in control, sham, HFrEF and HFpEF. H, representative B‐mode echo images showing left ventricular end diastole and end systole in control, HFrEF and HFpEF. I, representative tissue Doppler, pulse‐wave Doppler at mitral annulus and M‐mode echo recordings in control, HFrEF and HFpEF. Results are shown as means ± SD. Statistics are calculated by one‐way ANOVA (BF) and Student's t test (G). [Color figure can be viewed at wileyonlinelibrary.com]
Figure 2
Figure 2. Calcium transients are reduced in HFrEF but enhanced in HFpEF
A, representative fura‐2 Ca2+ transients (F 360/F 390) elicited by field stimulation at 1 Hz in cardiomyocytes isolated from control, HFrEF and HFpEF animals. B–D, pooled data analysing the amplitude (Δ), diastolic and systolic fura‐2 ratios (n = 23, 44 and 32 cells from 3 control, 5 HFrEF and 5 HFpEF rats). Results are shown as means + SD. Statistics are calculated by one‐way ANOVA. [Color figure can be viewed at wileyonlinelibrary.com]
Figure 3
Figure 3. Excitation‐contraction coupling is defective in HFrEF and enhanced in HFpEF
A, simultaneous recordings of I Ca,L (upper) and fluo‐4 CaTs (lower) upon depolarisation to 0 mV. B and C, pooled results for I Ca,L amplitude from 7 control, 6 HFrEF and 9 HFpEF rats (B), and triggered CaT amplitude (ΔF/F 0c) (C). D, EC coupling gain expressed as amplitude of the CaT (ΔF/F 0c) divided by peak I Ca (pA pF−1) at 0 mV. E, summary plots of CaT (ΔF/F 0c) induced by caffeine (10 mm) to assess SR Ca2+ stores. Results are shown as means + SD. Statistics are calculated by one‐way analysis of variance (ANOVA). [Color figure can be viewed at wileyonlinelibrary.com]
Figure 4
Figure 4. Microscopic EC coupling is compromised in HFrEF but enhanced in HFpEF
A, individual Ca2+ sparks triggered by depolarisation to 0 mV resolved using ultra‐high‐speed resonant confocal line scanning in fluo‐4‐loaded patch‐clamped cardiomyocytes. Dashed line indicates onset of depolarisation. B, histograms of spark latencies in control (blue), HFrEF (black) and HFpEF (red). C–E, mean (+ SD) spark probability, spark latency variability (plotted as standard deviation of latency), and spark latency (n = 13, 14 and 19 cells from 6, 3 and 5 control, HFrEF and HFpEF rats, respectively). Statistics are calculated by one‐way ANOVA. [Color figure can be viewed at wileyonlinelibrary.com]
Figure 5
Figure 5. Transverse‐tubules are depleted in HFrEF but intact in HFpEF
A, representative t‐tubule staining with Di‐4‐ANEPPS (upper) and intensity profiles (lower) assessing t‐tubule regularity in the regions outlined by white box. B–D, mean (+ SD) t‐tubule (TT) density, t‐tubule (TT) integrity and axial tubule (AT) density in Di‐4‐Anepps‐loaded cells (n = 36, 13 and 26 cells from three, two and four control, HFrEF and HFpEF animals, respectively). Statistics are calculated by one‐way analysis of variance (ANOVA). [Color figure can be viewed at wileyonlinelibrary.com]
Figure 6
Figure 6. Impaired β‐adrenergic response of I Ca,L and Ca2+ transient kinetics in HFpEF
A and B, representative (A) and mean + SD I Ca,L (B) upon depolarisation to 0 mV, at baseline (−ISO) and after isoprenaline (+ISO), in 10 cells from three control rats and 16 cells from three HFpEF rats. C and D, representative (C) and mean CaT amplitudes (D) elicited by field stimulation before (−ISO) and after (+ISO) isoprenaline in 25 cells from 4 control rats and 32 cells from 5 HFpEF rats. E, normalized CaT before (continuous line) and after (dashed line) ISO indicating measurement of CaT relaxation half‐time (T ½). F, mean (+ SD) Ca2+ uptake rate (T ½) before and after ISO in 25 cells from 4 control rats and 32 cells from 5 HFpEF rats. Statistics are calculated using paired Student's t test to compare the effect of ISO on relative change in I Ca, CaT amplitude and CaT T ½, as shown by the colour‐coded percentage changes accompanied by P values. [Color figure can be viewed at wileyonlinelibrary.com]
Figure 7
Figure 7. Defective local uptake of calcium in HFpEF cells
A, representative confocal line scan (2.5 ms/line) CaTs elicited by field stimulation in cardiomyocytes isolated from control and HFpEF animals; fluorescence transients obtained at colour‐coded boxed locations are plotted to the right. CaT relaxation half‐time (T ½) at individual scan locations is overlaid in white. Black scale bars: vertical = 20 μm, horizontal = 100 ms. B, mean (+ SD) uptake variability, calculated as the standard deviation of localized T ½ at each spatial location along the scan line, n = 9 cells from 3 control rats and 11 cells from three HFpEF rats. C, normalized diastolic fluo‐4 fluorescence measured during action potentials recorded in current clamp at increasing frequencies in 14 cells from 3 control rats (blue bars) and 10 cells from 3 HFpEF rats (red bars). There was no statistically significant elevation in diastolic Ca2+ fluorescence in the HFpEF group compared to 0.2 Hz pacing rate. Statistics are calculated as Student's two‐tailed unpaired t test (B) and two‐way ANOVA (C). [Color figure can be viewed at wileyonlinelibrary.com]
Figure 8
Figure 8. Immunoblots of major Ca2+‐handling proteins in HFpEF
A and B, representative western blots from ventricular cardiomyocytes (left) and pooled data (right) showing mean density relative to GAPDH for major Ca2+‐handling proteins (Cav1.2, SERCA2, NCX and phospholamban (PLN) and assessment of phosphorylation at known sites (pSer1928 Cav1.2, pThr17‐PLN and pSer16‐PLN). C, immunoprecipitation studies of RyR2 and pSer2808 RyR2 showing significant increase in phosphorylation of RyR2 relative to expression of RyR2. Data were normalized to RyR2 in the immunoprecipitated sample. Data expressed as means + SD. Statistics are calculated as Mann‐Whitney rank test. [Color figure can be viewed at wileyonlinelibrary.com]

Comment in

References

    1. Borlaug BA, Olson TP, Lam CS, Flood KS, Lerman A, Johnson BD & Redfield MM (2010). Global cardiovascular reserve dysfunction in heart failure with preserved ejection fraction. J Am Coll Cardiol 56, 845–854. - PMC - PubMed
    1. Borlaug BA & Redfield MM (2011). Diastolic and systolic heart failure are distinct phenotypes within the heart failure spectrum. Circulation 123, 2006‐2014; discussion 2014. - PMC - PubMed
    1. Boularan C & Gales C (2015). Cardiac cAMP: production, hydrolysis, modulation and detection. Front Pharmacol 6, 203. - PMC - PubMed
    1. Bryant SM, Kong CH, Watson J, Cannell MB, James AF & Orchard CH (2015). Altered distribution of I Ca impairs Ca release at the t‐tubules of ventricular myocytes from failing hearts. J Mol Cell Cardiol 86, 23–31. - PMC - PubMed
    1. Cain BS, Meldrum DR, Joo KS, Wang JF, Meng X, Cleveland JC Jr, Banerjee A & Harken AH (1998). Human SERCA2a levels correlate inversely with age in senescent human myocardium. J Am Coll Cardiol 32, 458–467. - PubMed

Publication types