

Imaging Volume Trends and Recovery During the COVID-19 Pandemic: A Comparative Analysis Between a Large Urban Academic Hospital and Its Affiliated Imaging Centers
- PMID: 32830030
- PMCID: PMC7428785
- DOI: 10.1016/j.acra.2020.08.008
Imaging Volume Trends and Recovery During the COVID-19 Pandemic: A Comparative Analysis Between a Large Urban Academic Hospital and Its Affiliated Imaging Centers
Abstract
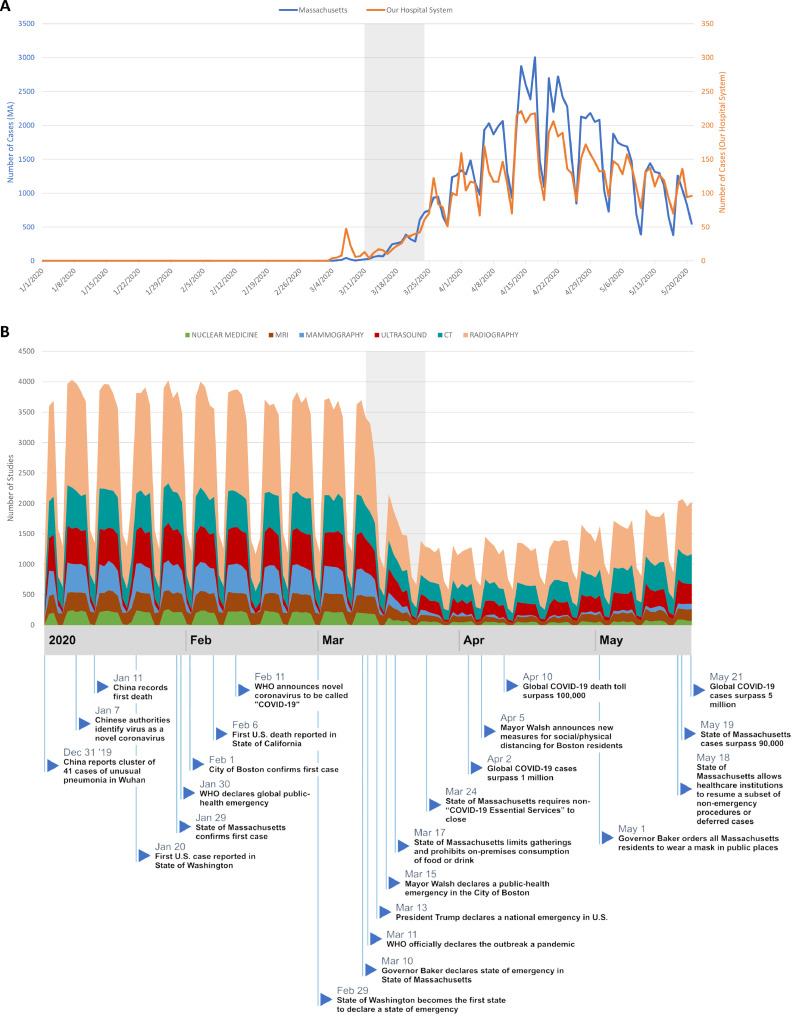
Rationale and objectives: While affiliated imaging centers play an important role in healthcare systems, little is known of how their operations are impacted by the COVID-19 pandemic. Our goal was to investigate imaging volume trends during the pandemic at our large academic hospital compared to the affiliated imaging centers.
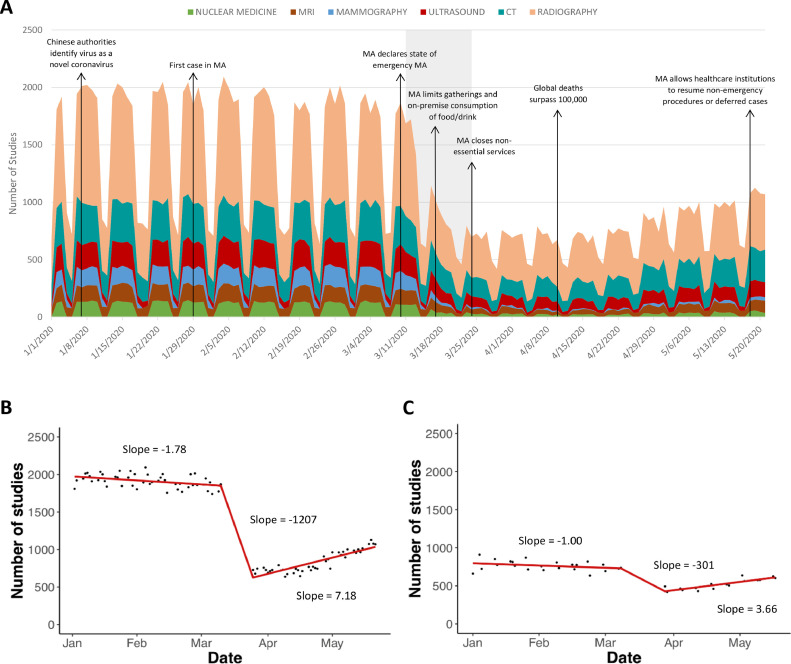
Materials and methods: This was a descriptive retrospective study of imaging volume from an academic hospital (main hospital campus) and its affiliated imaging centers from January 1 through May 21, 2020. Imaging volume assessment was separated into prestate of emergency (SOE) period (before SOE in Massachusetts on March 10, 2020), "post-SOE" period (time after "nonessential" services closure on March 24, 2020), and "transition" period (between pre-SOE and post-SOE).
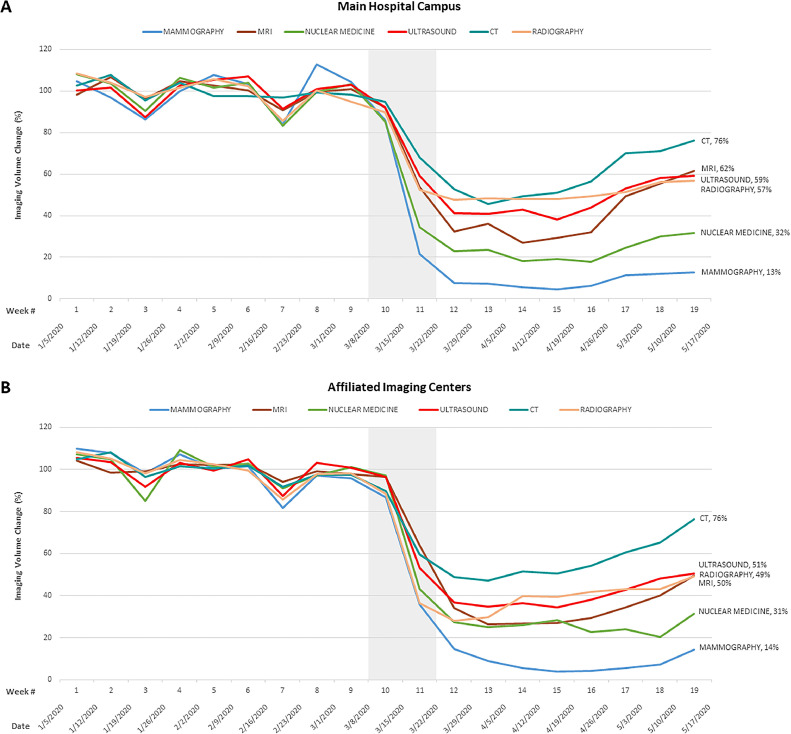
Results: Imaging volume began to decrease on March 11, 2020, after hospital policy to delay nonessential studies. The average weekly imaging volume during the post-SOE period declined by 54% at the main hospital campus and 64% at the affiliated imaging centers. The rate of imaging volume recovery was slower for affiliated imaging centers (slope = 6.95 for weekdays) compared to main hospital campus (slope = 7.18 for weekdays). CT, radiography, and ultrasound exhibited the lowest volume loss, with weekly volume decrease of 41%, 49%, and 53%, respectively, at the main hospital campus, and 43%, 61%, and 60%, respectively, at affiliated imaging centers. Mammography had the greatest volume loss of 92% at both the main hospital campus and affiliated imaging centers.
Conclusion: Affiliated imaging center volume decreased to a greater degree than the main hospital campus and showed a slower rate of recovery. Furthermore, the trend in imaging volume and recovery were temporally related to public health announcements and COVID-19 cases.
Keywords: COVID-19; Imaging volume; Pandemic; Radiology operation; Service locations.
Copyright © 2020 The Association of University Radiologists. Published by Elsevier Inc. All rights reserved.
Figures

References
-
- Pneumonia of unknown cause – China. World Health Organization. Accessed June 1, 2020, Available at: https://www.who.int/csr/don/05-january-2020-pneumonia-of-unkown-cause-ch....)
-
- COVID-19 CORONAVIRUS PANDEMIC. Worldmeter. (Accessed June 1, 2020. Available at: https://www.worldometers.info/coronavirus/)
-
- Jr. DGM . The New York Times; 2020. The U.S. now leads the world in confirmed coronavirus cases. 2020 March 26.
-
- Centers for Disease Control and Prevention; 2020. United States coronavirus (COVID-19) death toll surpasses 100,000.https://www.cdc.gov/media/releases/2020/s0528-coronavirus-death-toll.html Accessed June 1, 2020, Available at:
MeSH terms
LinkOut - more resources
Full Text Sources
