Comparative Study
. 2020 Dec;22(12):e13255.
doi: 10.1111/cmi.13255. Epub 2020 Sep 29.

Novel tumour suppressor roles for GZMA and RASGRP1 in Theileria annulata-transformed macrophages and human B lymphoma cells

Affiliations
Comparative Study

Novel tumour suppressor roles for GZMA and RASGRP1 in Theileria annulata-transformed macrophages and human B lymphoma cells

Zineb Rchiad et al. Cell Microbiol. 2020 Dec.

Abstract

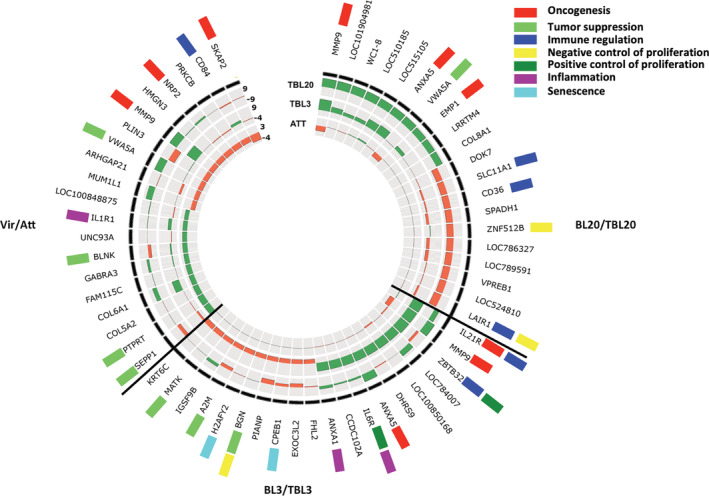
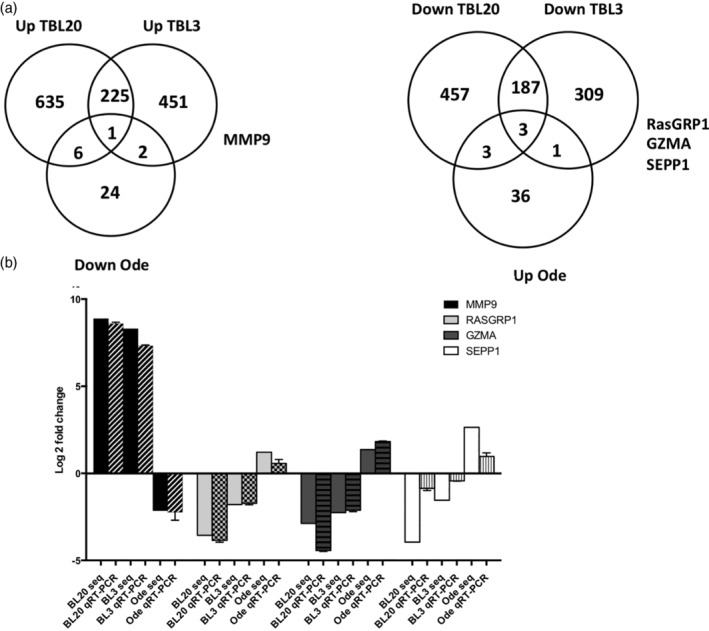
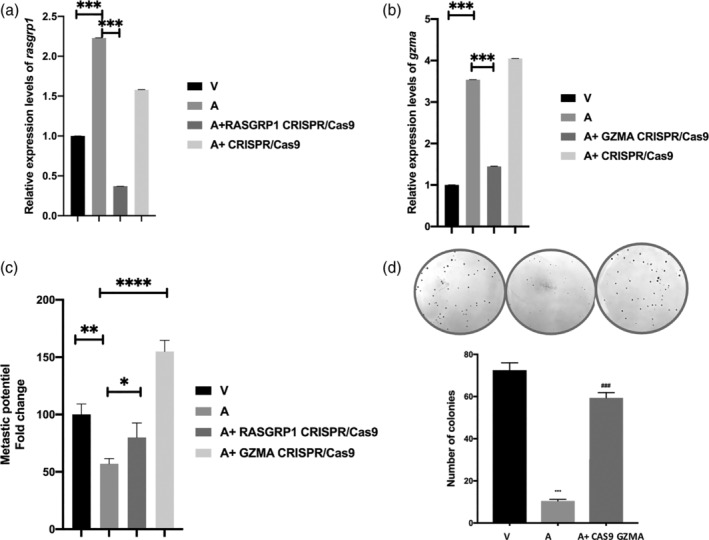
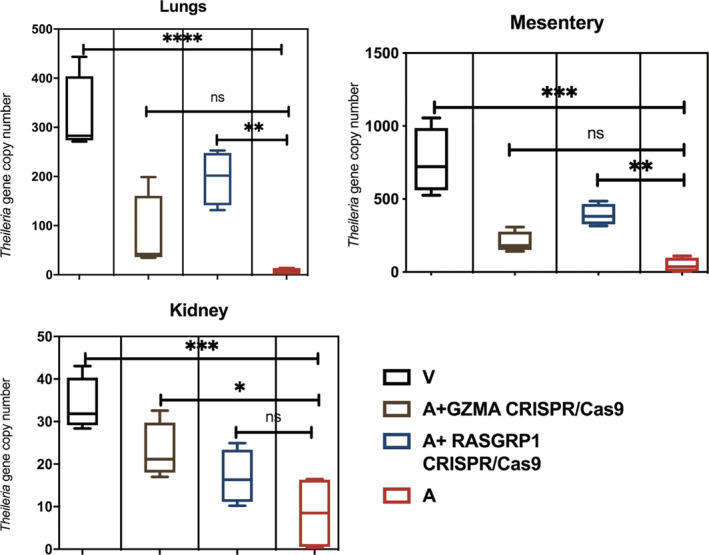
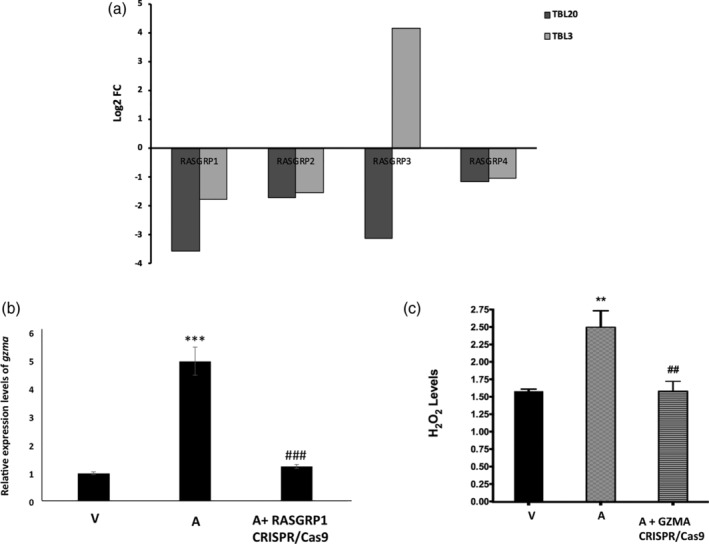
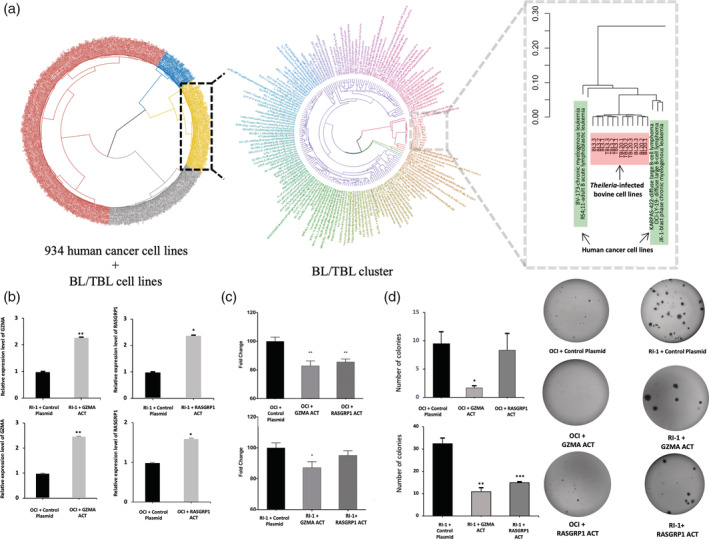
Theileria annulata is a tick-transmitted apicomplexan parasite that infects and transforms bovine leukocytes into disseminating tumours that cause a disease called tropical theileriosis. Using comparative transcriptomics we identified genes transcriptionally perturbed during Theileria-induced leukocyte transformation. Dataset comparisons highlighted a small set of genes associated with Theileria-transformed leukocyte dissemination. The roles of Granzyme A (GZMA) and RAS guanyl-releasing protein 1 (RASGRP1) were verified by CRISPR/Cas9-mediated knockdown. Knocking down expression of GZMA and RASGRP1 in attenuated macrophages led to a regain in their dissemination in Rag2/γC mice confirming their role as dissemination suppressors in vivo. We further evaluated the roles of GZMA and RASGRP1 in human B lymphomas by comparing the transcriptome of 934 human cancer cell lines to that of Theileria-transformed bovine host cells. We confirmed dampened dissemination potential of human B lymphomas that overexpress GZMA and RASGRP1. Our results provide evidence that GZMA and RASGRP1 have a novel tumour suppressor function in both T. annulata-infected bovine host leukocytes and in human B lymphomas.

Keywords: GZMA; RASGRP1; Theileria annulata; human cancer cell atlas; transcriptome; tumour suppressor.


Conflict of interest statement

The authors declare no conflicts of interest.

Figures

FIGURE 1
FIGURE 1
Top 20 DEGs in Theileria‐transformed bovine host cells. Circos plot showing the top 10 up‐ and down‐regulated DEGs in BL3/TBL3, BL20/TBL20 and attenuated versus virulent (Att/Vir) Ode macrophages. The circular heatmap represents the FC of the top DE genes in BL20/TBL20, BL3/TBL3 and Att/Vir Ode in the outer, middle and inner rings, respectively, where green reflects the level of up‐regulation and orange down‐regulation. The genes with biological functions related to tumorigenesis and immune regulation are tagged with coloured rectangles. Genes with no tag are hypothetical genes or have no known function in tumorigenesis and immune regulation. DE, differentially expressed; DEG, differentially expressed gene; FC, fold change
FIGURE 2
FIGURE 2
Inversely DEGs in TBL20, TBL3 and Att Ode leukocytes. (a) Venn diagrams illustrating the genes inversely DE in TBL3, TBL20 and attenuated Ode macrophages. (b) qRT‐PCR confirmation of DEGs potentially playing key roles in leukocyte transformation and dissemination. Seq and qRT‐PCT refer to sequencing and real‐time quantitative reverse transcription PCR, respectively. The reactions were set in three biological replicates and the fold change calculated with the 2ΔΔct method. The error bars represent SEM. DE, differentially expressed; DEG, differentially expressed gene
FIGURE 3
FIGURE 3
Colony formation and invasiveness of Ode macrophages after RASGRP1 and GZMA knockdown. (a,b) qRT‐PCR confirmation of GZMA and RASGRP1 knockdown, respectively. (c) Matrigel chamber assay showing a regain in matrigel traversal after RASGRP1 and GZMA knockdown. (d) Increased colony formation in soft agar following RASGRP1 knockdown. Non‐transfected virulent disseminating Ode macrophages are indicated by V, and non‐transfected poorly disseminating attenuated Ode macrophages by A. Error bars represent SEM of three biological replicates. ****p < .0005, ***p < .001, **p < .005 and *p < .05
FIGURE 4
FIGURE 4
Effect of GZMA and RASGRP1 knockdown on transformed macrophage dissemination in vivo. Panels represent the copy number of the single copy T. annulata gene (ama‐1, TA02980) in the lung, mesentery and left kidney. Transformed macrophages were injected into five Rag2γC immunodeficient mice and plotted values represent the mean of obtained T. annulata‐specific ama1 gene copy number. There was no obvious difference in proliferation rate between transfected cells and control in vitro, and no obvious difference in number of nuclei per schizont between knockdown and control cells. Error bars represent SD of five biological replicates. ***p < .001, **p < .005 and *p < .05 compared to virulent and attenuated Ode macrophages
FIGURE 5
FIGURE 5
RASGRP1 and GZMA knockdown reduces GZMA expression and dampening of H2O2 levels, respectively. (a) Log2FC values of RASGRP1‐4 in TBL3 and TBL20 RNAseq Log2FC values from DESeq2 of TBL3 and TBL20 compared to BL3 and BL20, respectively. (b) Effect of RASGRP1 knockdown on GZMA expression. qRT‐PCR of GZMA in virulent (V), attenuated (A) and attenuated Ode macrophages after CRISPR/Cas9‐mediated RASGRP1 knockdown. Error bars represent SD of three biological replicates *** and ### represent p < .001 compared to virulent and attenuated Ode macrophages, respectively. (c) H2O2 output by virulent (V), attenuated (A), and attenuated Ode macrophages after CRISPR/Cas9‐mediated GZMA knockdown. Error bars represent SD of three biological replicates. ** and ## represent p < .01 compared to virulent and attenuated Ode macrophages, respectively. FC, fold change
FIGURE 6
FIGURE 6
Effect of GZMA and RASGRP1 activation on human B lymphomas. (a) (Left panel) PCA based hierarchical clustering of 934 human cancer cell lines and T. annulata‐transformed bovine B cells and their non‐infected counterparts. The cluster containing bovine cells mainly contains leukaemic human cancer cell lines. The samples are coloured by cluster ID. (Middle cluster) The samples from the BL3/TBL3 and BL20/TBL20 sub‐cluster were reclustered by comparing the similarity of their gene expression profiles. The sample labels are coloured by their similarity to each other. (Right panel) The sub‐cluster containing bovine cell lines and human cancer cell lines with similar gene expression profile. (b) qRT‐PCR determination of GZMA and RASGRP1 expression after CRISPR‐mediated gene activation in RI‐1 (top panel) and OCI‐LY19 (bottom panel). The error bars represent SEM of three biological replicates. (c) Matrigel chamber assay illustrating the dissemination potential of RI‐1 and OCI‐LY19 following activation of RASGRP1 and GZMA transcription. (d) Decrease in colony formation in soft agar of OCI‐LY19 and RI‐1 following GZMA and RASGRP1 activation. Errors bars represent SEM values of three biological replicates *, ** and *** represent student t test p < .05, p < .005 and p < .0005, respectively

References

    1. Adamson, R. , Logan, M. , Kinnaird, J. , Langsley, G. , & Hall, R. (2000). Loss of matrix metalloproteinase 9 activity in Theileria annulata‐attenuated cells is at the transcriptional level and is associated with differentially expressed AP‐1 species. Molecular and Biochemical Parasitology, 106(1), 51–61. - PubMed
    1. Altenhoff, A. M. , Glover, N. M. , Train, C. M. , Kaleb, K. , Warwick Vesztrocy, A. , Dylus, D. , … Dessimoz, C. (2018). The OMA orthology database in 2018: Retrieving evolutionary relationships among all domains of life through richer web and programmatic interfaces. Nucleic Acids Research, 46(D1), D477–D485. - PMC - PubMed
    1. Anders, S. , Pyl, P. T. , & Huber, W. (2015). HTSeq – A python framework to work with high‐throughput sequencing data. Bioinformatics, 31(2), 166–169. - PMC - PubMed
    1. Bolger, A. M. , Lohse, M. , & Usadel, B. (2014). Trimmomatic: A flexible trimmer for Illumina sequence data. Bioinformatics, 30(15), 2114–2120. - PMC - PubMed
    1. Burk, R. F. , Hill, K. E. , Awad, J. A. , Morrow, J. D. , Kato, T. , Cockell, K. A. , & Lyons, P. R. (1995). Pathogenesis of diquat‐induced liver necrosis in selenium‐deficient rats: Assessment of the roles of lipid peroxidation and selenoprotein P. Hepatology, 21(2), 561–569. - PubMed

Publication types