

Effect of vitamin D supplementation on N-glycan branching and cellular immunophenotypes in MS
- PMID: 32830462
- PMCID: PMC7480923
- DOI: 10.1002/acn3.51148
Effect of vitamin D supplementation on N-glycan branching and cellular immunophenotypes in MS
Abstract
Objective: To investigate the effect of cholecalciferol (vitamin D3) supplementation on peripheral immune cell frequency and N-glycan branching in patients with relapsing-remitting multiple sclerosis (RRMS).
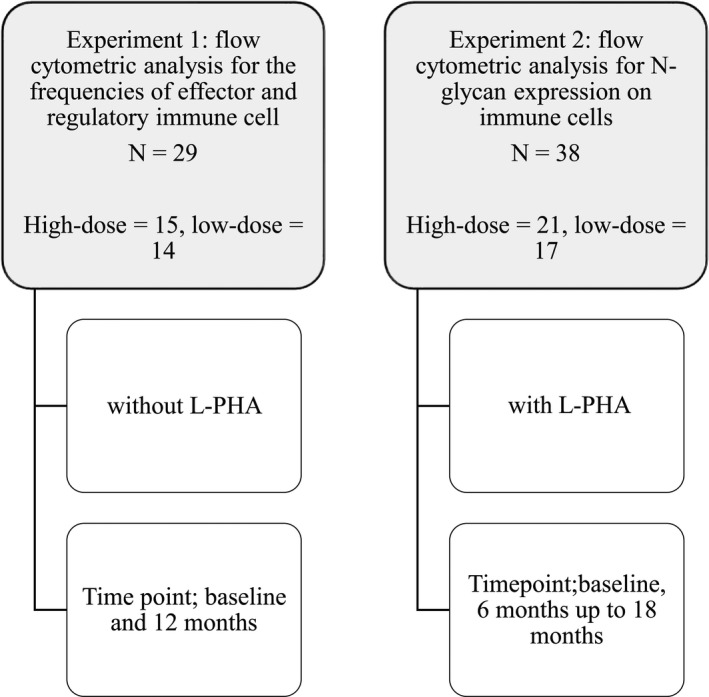
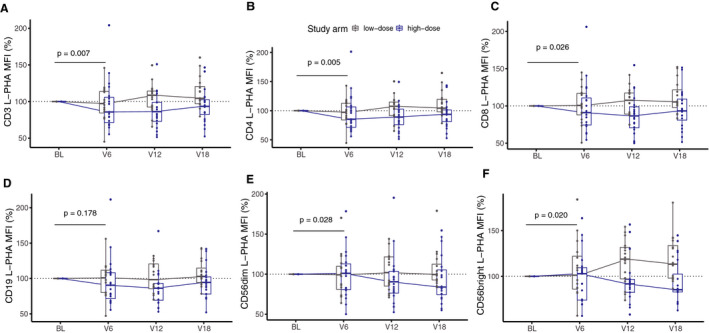
Methods: Exploratory analysis of high-dose (20 400 IU) and low-dose (400 IU) vitamin D3 supplementation taken every other day of an 18-month randomized controlled clinical trial including 38 RRMS patients on stable immunomodulatory therapy (NCT01440062). We investigated cholecalciferol treatment effects on N-glycan branching using L-PHA stain (phaseolus vulgaris leukoagglutinin) at 6 months and frequencies of T-, B-, and NK-cell subpopulations at 12 months with flow cytometry.
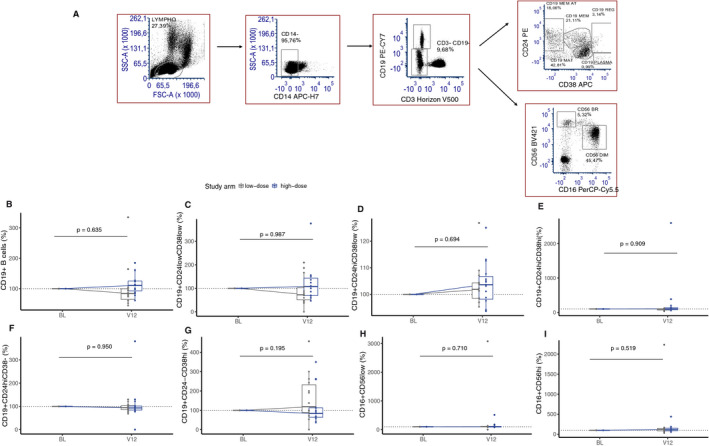
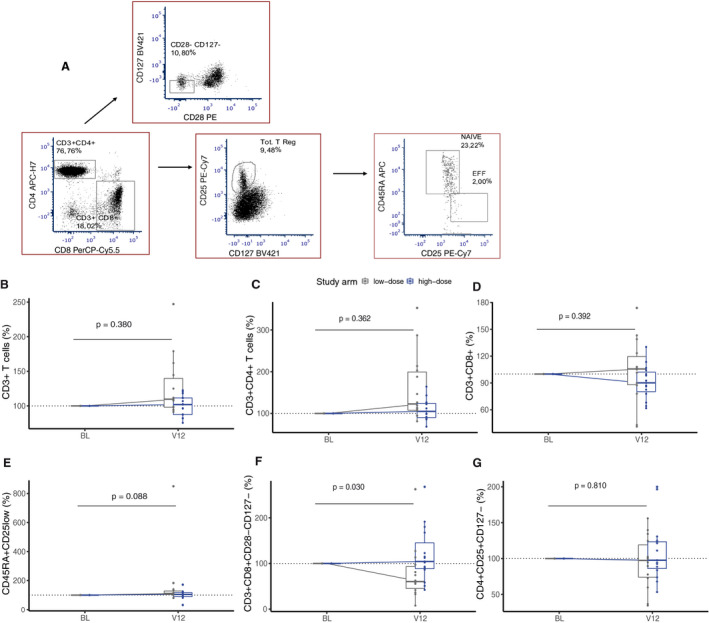
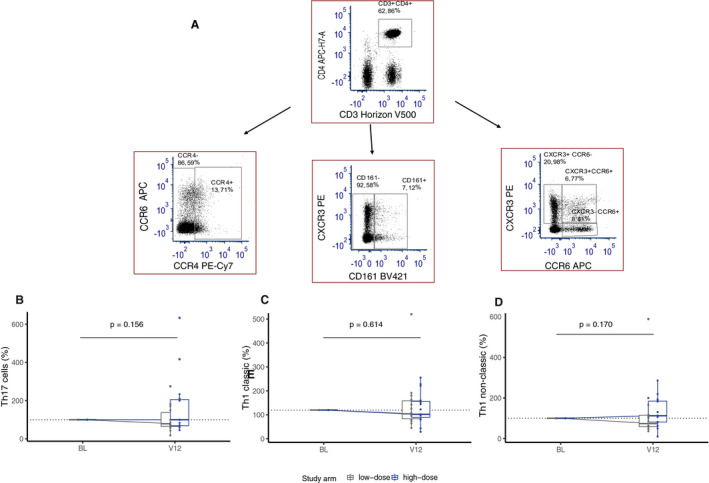
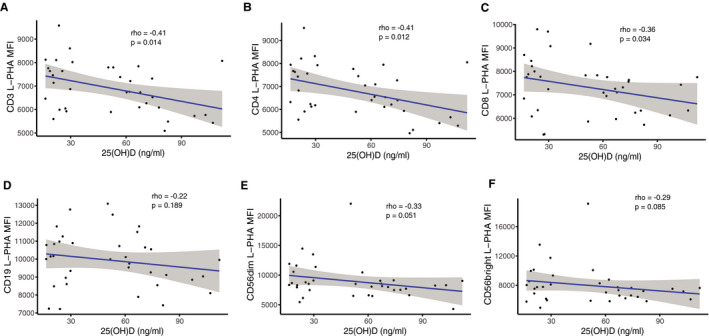
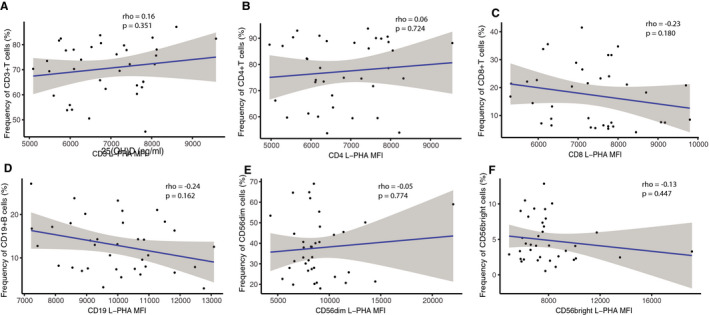
Results: High-dose supplementation did not change CD3+ T cell subsets, CD19+ B cells subsets, and NK cells frequencies, except for CD8+ T regulatory cells, which were reduced in the low-dose arm compared to the high-dose arm at 12 months. High-dose supplementation decreased N-glycan branching on T and NK cells, measured as L-PHA mean fluorescence intensity (MFI). A reduction of N-glycan branching in B cells was not significant. In contrast, low-dose supplementation did not affect N-glycan branching. Changes in N-glycan branching did not correlate with cell frequencies.
Interpretation: Immunomodulatory effect of vitamin D may involve regulation of N-glycan branching in vivo. Vitamin D3 supplementation did at large not affect the frequencies of peripheral immune cells.
© 2020 The Authors. Annals of Clinical and Translational Neurology published by Wiley Periodicals LLC on behalf of American Neurological Association.
Conflict of interest statement
Priscilla Bäcker‐Koduah is a Junior scholar of the Einstein Foundation Berlin. Carmen Duarte‐Infante receives research support from Novartis and Sanofi‐Genzyme and travels support from Novartis. Federico Ivaldi reports no disclosures. Antonio Uccelli has received personal compensation from Novartis, TEVA, Biogen, Merck, Roche, and Genzyme for public speaking and advisory boards. Judith Bellmann‐Strobl received speaking fees and travel grants from Bayer Healthcare, Sanofi Aventis/Genzyme, Biogen and Teva Pharmaceuticals, unrelated to the present scientific work. Klaus‐Dieter Wernecke reports no disclosures. Michael Sy reports no disclosures. Michael Demetriou reports no disclosures. Jan Dörr received research support by Bayer and Novartis, Honoraria for Lectures and Advisory by Bayer, Biogen, Merck Serono, Sanofi‐Genzyme, Novartis, Roche; Travel support by Bayer, Novartis, Merck‐Serono, Biogen. Friedemann Paul served on the scientific advisory boards of Novartis and MedImmune; received travel funding and/or speaker honoraria from Bayer, Novartis, Biogen, Teva, Sanofi‐Aventis/Genzyme, Merck Serono, Alexion, Chugai, MedImmune, and Shire; is an associate editor of Neurology: Neuroimmunology & Neuroinflammation; is an academic editor of PLoS ONE; consulted for Sanofi Genzyme, Biogen, MedImmune, Shire, and Alexion; received research support from Bayer, Novartis, Biogen, Teva, Sanofi‐Aventis/Genzyme, Alexion, and Merck Serono; and received research support from the German Research Council, Werth Stiftung of the City of Cologne, German Ministry of Education and Research, Arthur Arnstein Stiftung Berlin, EU FP7 Framework Pro‐gram, Arthur Arnstein Foundation Berlin, Guthy‐Jackson Charitable Foundation, and NMSS. Alexander Ulrich Brandt is co‐founder and shareholder of Motognosis GmbH and Nocturne GmbH. He is named as an inventor on several patent applications regarding MS serum biomarkers, OCT image analysis and perceptive visual computing.
Figures
Similar articles
-
Immune regulatory effects of high dose vitamin D3 supplementation in a randomized controlled trial in relapsing remitting multiple sclerosis patients receiving IFNβ; the SOLARIUM study.J Neuroimmunol. 2016 Nov 15;300:47-56. doi: 10.1016/j.jneuroim.2016.09.018. Epub 2016 Oct 3. J Neuroimmunol. 2016. PMID: 27806875 Clinical Trial.
-
Safety and immunologic effects of high- vs low-dose cholecalciferol in multiple sclerosis.Neurology. 2016 Jan 26;86(4):382-90. doi: 10.1212/WNL.0000000000002316. Epub 2015 Dec 30. Neurology. 2016. PMID: 26718578 Free PMC article. Clinical Trial.
-
Vitamin D supplementation and systemic inflammation in relapsing-remitting multiple sclerosis.J Neurol. 2015 Dec;262(12):2713-21. doi: 10.1007/s00415-015-7902-5. Epub 2015 Oct 1. J Neurol. 2015. PMID: 26429571 Clinical Trial.
-
High dose vitamin D supplementation does not affect biochemical bone markers in multiple sclerosis - a randomized controlled trial.BMC Neurol. 2017 Apr 4;17(1):67. doi: 10.1186/s12883-017-0851-0. BMC Neurol. 2017. PMID: 28376767 Free PMC article. Clinical Trial.
-
Repopulation of T, B, and NK cells following alemtuzumab treatment in relapsing-remitting multiple sclerosis.J Neuroinflammation. 2020 Jun 15;17(1):189. doi: 10.1186/s12974-020-01847-9. J Neuroinflammation. 2020. PMID: 32539719 Free PMC article. Clinical Trial.
Cited by
-
N-acetylglucosamine drives myelination by triggering oligodendrocyte precursor cell differentiation.J Biol Chem. 2020 Dec 18;295(51):17413-17424. doi: 10.1074/jbc.RA120.015595. J Biol Chem. 2020. PMID: 33453988 Free PMC article.
-
N-Glycan Branching Regulates BTLA Opposite to PD-1 to Limit T Cell Hyperactivity Induced by Branching Deficiency.J Immunol. 2024 Nov 1;213(9):1329-1337. doi: 10.4049/jimmunol.2300568. J Immunol. 2024. PMID: 39269653
-
Vitamin D as a Modulator of Neuroinflammation: Implications for Brain Health.Curr Pharm Des. 2024;30(5):323-332. doi: 10.2174/0113816128281314231219113942. Curr Pharm Des. 2024. PMID: 38303529 Review.
-
N-acetylglucosamine inhibits inflammation and neurodegeneration markers in multiple sclerosis: a mechanistic trial.J Neuroinflammation. 2023 Sep 13;20(1):209. doi: 10.1186/s12974-023-02893-9. J Neuroinflammation. 2023. PMID: 37705084 Free PMC article.
References
-
- Venken K, Hellings N, Broekmans T, et al. Natural naive CD4 + CD25 + CD127 low Regulatory T Cell (Treg) development and function are disturbed in multiple sclerosis patients: recovery of memory treg homeostasis during disease progression. J Immunol 2008;180(9):6411–6420. DOI: 10.4049/jimmunol.180.9.6411 - DOI - PubMed
Publication types
MeSH terms
Substances
Associated data
LinkOut - more resources
Full Text Sources
Medical
Research Materials