OMIP-069: Forty-Color Full Spectrum Flow Cytometry Panel for Deep Immunophenotyping of Major Cell Subsets in Human Peripheral Blood
- PMID: 32830910
- PMCID: PMC8132182
- DOI: 10.1002/cyto.a.24213
OMIP-069: Forty-Color Full Spectrum Flow Cytometry Panel for Deep Immunophenotyping of Major Cell Subsets in Human Peripheral Blood
Abstract
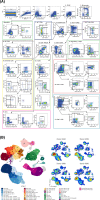
This 40-color flow cytometry-based panel was developed for in-depth immunophenotyping of the major cell subsets present in human peripheral blood. Sample availability can often be limited, especially in cases of clinical trial material, when multiple types of testing are required from a single sample or timepoint. Maximizing the amount of information that can be obtained from a single sample not only provides more in-depth characterization of the immune system but also serves to address the issue of limited sample availability. The panel presented here identifies CD4 T cells, CD8 T cells, regulatory T cells, γδ T cells, NKT-like cells, B cells, NK cells, monocytes and dendritic cells. For each specific cell type, the panel includes markers for further characterization by including a selection of activation and differentiation markers, as well as chemokine receptors. Moreover, the combination of multiple markers in one tube might lead to the discovery of new immune phenotypes and their relevance in certain diseases. Of note, this panel was designed to include only surface markers to avoid the need for fixation and permeabilization steps. The panel can be used for studies aimed at characterizing the immune response in the context of infectious or autoimmune diseases, monitoring cancer patients on immuno- or chemotherapy, and discovery of unique and targetable biomarkers. Different from all previously published OMIPs, this panel was developed using a full spectrum flow cytometer, a technology that has allowed the effective use of 40 fluorescent markers in a single panel. The panel was developed using cryopreserved human peripheral blood mononuclear cells (PBMC) from healthy adults (Table 1). Although we have not tested the panel on fresh PBMCs or whole blood, it is anticipated that the panel could be used in those sample preparations without further optimization. @ 2020 Cytek Biosciences, Inc. Cytometry Part A published by Wiley Periodicals LLC on behalf of International Society for Advancement of Cytometry.
Keywords: Aurora; OMIP; PBMCs; broad immunophenotyping; full spectrum; high-dimensional flow cytometry; spectral.
@ 2020 Cytek Biosciences, Inc. Cytometry Part A published by Wiley Periodicals LLC on behalf of International Society for Advancement of Cytometry.
Conflict of interest statement
Lily Park and Maria C. Jaimes are employees of Cytek Biosciences, Inc., the manufacturer of the Aurora full spectrum flow cytometer used in these studies. Joanne Lannigan is a paid consultant for Cytek Biosciences, Inc.
Figures

References
-
- Aghaeepour N, Chattopadhyay PK, Ganesan A, O'Neill K, Zare H, Jalali A, Hoos HH, Roederer M, Brinkman RR. Early immunologic correlates of HIV protection can be identified from computational analysis of complex multivariate T‐cell flow cytometry assays. Bioinformatics 2012;28:1009–1016. - PMC - PubMed
-
- Chattopadhyay PK, Roederer M. A mine is a terrible thing to waste: High content, single cell technologies for comprehensive immune analysis. Am J Transplant 2015;15:1155–1161. - PubMed
-
- Perfetto SP, Chattopadhyay PK, Roederer M. Seventeen‐colour flow cytometry: Unravelling the immune system. Nat Rev Immunol 2004;4:648–655. - PubMed
MeSH terms
LinkOut - more resources
Full Text Sources
Other Literature Sources
Research Materials

