Orchestration of signaling by structural disorder in class 1 cytokine receptors
- PMID: 32831102
- PMCID: PMC7444064
- DOI: 10.1186/s12964-020-00626-6
Orchestration of signaling by structural disorder in class 1 cytokine receptors
Abstract
Background: Class 1 cytokine receptors (C1CRs) are single-pass transmembrane proteins responsible for transmitting signals between the outside and the inside of cells. Remarkably, they orchestrate key biological processes such as proliferation, differentiation, immunity and growth through long disordered intracellular domains (ICDs), but without having intrinsic kinase activity. Despite these key roles, their characteristics remain rudimentarily understood.
Methods: The current paper asks the question of why disorder has evolved to govern signaling of C1CRs by reviewing the literature in combination with new sequence and biophysical analyses of chain properties across the family.
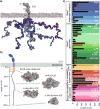
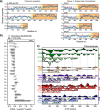
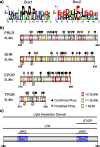
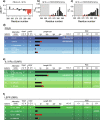
Results: We uncover that the C1CR-ICDs are fully disordered and brimming with SLiMs. Many of these short linear motifs (SLiMs) are overlapping, jointly signifying a complex regulation of interactions, including network rewiring by isoforms. The C1CR-ICDs have unique properties that distinguish them from most IDPs and we forward the perception that the C1CR-ICDs are far from simple strings with constitutively bound kinases. Rather, they carry both organizational and operational features left uncovered within their disorder, including mechanisms and complexities of regulatory functions.
Conclusions: Critically, the understanding of the fascinating ability of these long, completely disordered chains to orchestrate complex cellular signaling pathways is still in its infancy, and we urge a perceptional shift away from the current simplistic view towards uncovering their full functionalities and potential. Video abstract.
Keywords: CIDER; Cytokine receptors; Disorder; IDDomainSpotter; IDPs; IDRs; NMR; SAXS; SLiM; Signaling; Structural biology; Transmembrane receptors.
Conflict of interest statement
The authors declare that they have no competing interests.
Figures


Similar articles
-
Functions of intrinsic disorder in transmembrane proteins.Cell Mol Life Sci. 2017 Sep;74(17):3205-3224. doi: 10.1007/s00018-017-2562-5. Epub 2017 Jun 10. Cell Mol Life Sci. 2017. PMID: 28601983 Free PMC article. Review.
-
Conservation and coevolution determine evolvability of different classes of disordered residues in human intrinsically disordered proteins.Proteins. 2022 Mar;90(3):632-644. doi: 10.1002/prot.26261. Epub 2021 Oct 14. Proteins. 2022. PMID: 34626492
-
On the Potential of Machine Learning to Examine the Relationship Between Sequence, Structure, Dynamics and Function of Intrinsically Disordered Proteins.J Mol Biol. 2021 Oct 1;433(20):167196. doi: 10.1016/j.jmb.2021.167196. Epub 2021 Aug 12. J Mol Biol. 2021. PMID: 34390736 Review.
-
Short linear motifs in intrinsically disordered regions modulate HOG signaling capacity.BMC Syst Biol. 2018 Jul 3;12(1):75. doi: 10.1186/s12918-018-0597-3. BMC Syst Biol. 2018. PMID: 29970070 Free PMC article.
-
The Myotubularin Related Proteins and the Untapped Interaction Potential of Their Disordered C-Terminal Regions.Proteins. 2025 Apr;93(4):831-854. doi: 10.1002/prot.26774. Epub 2024 Nov 30. Proteins. 2025. PMID: 39614773 Free PMC article.
Cited by
-
Structures of highly flexible intracellular domain of human α7 nicotinic acetylcholine receptor.Nat Commun. 2022 Feb 10;13(1):793. doi: 10.1038/s41467-022-28400-x. Nat Commun. 2022. PMID: 35145092 Free PMC article.
-
On the roles of intrinsically disordered proteins and regions in cell communication and signaling.Cell Commun Signal. 2021 Aug 30;19(1):88. doi: 10.1186/s12964-021-00774-3. Cell Commun Signal. 2021. PMID: 34461937 Free PMC article.
-
The thrombopoietin receptor: revisiting the master regulator of platelet production.Platelets. 2021 Aug 18;32(6):770-778. doi: 10.1080/09537104.2021.1925102. Epub 2021 Jun 7. Platelets. 2021. PMID: 34097561 Free PMC article. Review.
-
Improved predictions of phase behaviour of intrinsically disordered proteins by tuning the interaction range.Open Res Eur. 2023 Jan 17;2:94. doi: 10.12688/openreseurope.14967.2. eCollection 2022. Open Res Eur. 2023. PMID: 37645312 Free PMC article.
-
The molecular basis for cellular function of intrinsically disordered protein regions.Nat Rev Mol Cell Biol. 2024 Mar;25(3):187-211. doi: 10.1038/s41580-023-00673-0. Epub 2023 Nov 13. Nat Rev Mol Cell Biol. 2024. PMID: 37957331 Free PMC article. Review.
References
-
- Wright PE, Dyson HJ. Intrinsically unstructured proteins: re-assessing the protein structure-function paradigm. J Mol Biol. 1999;293:321–331. - PubMed
-
- Sigler PB. Acid blobs and negative noodles. Nature. 1988;333:210–212. - PubMed
-
- Ward JJ, Sodhi JS, McGuffin LJ, Buxton BF, Jones DT. Prediction and functional analysis of native disorder in proteins from the three kingdoms of life. J Mol Biol. 2004;337:635–645. - PubMed
-
- Mitrea DM, Yoon M-K, Ou L, Kriwacki RW. Disorder-function relationships for the cell cycle regulatory proteins p21 and p27. Biol Chem. 2012;393:259–274. - PubMed
Publication types
MeSH terms
Substances
LinkOut - more resources
Full Text Sources
Research Materials

