Comment
. 2020 Oct 1;130(10):5127-5141.
doi: 10.1172/JCI137723.

CBFB-MYH11 fusion neoantigen enables T cell recognition and killing of acute myeloid leukemia

Affiliations
Comment

CBFB-MYH11 fusion neoantigen enables T cell recognition and killing of acute myeloid leukemia

Melinda A Biernacki et al. J Clin Invest. .

Abstract

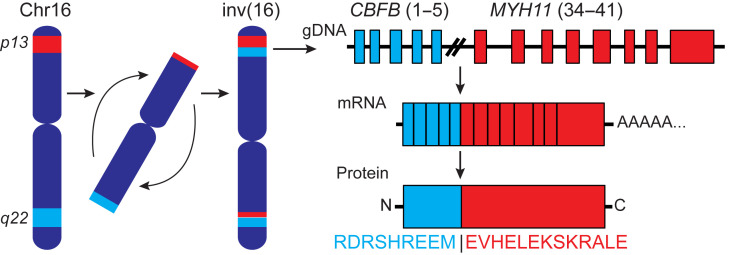
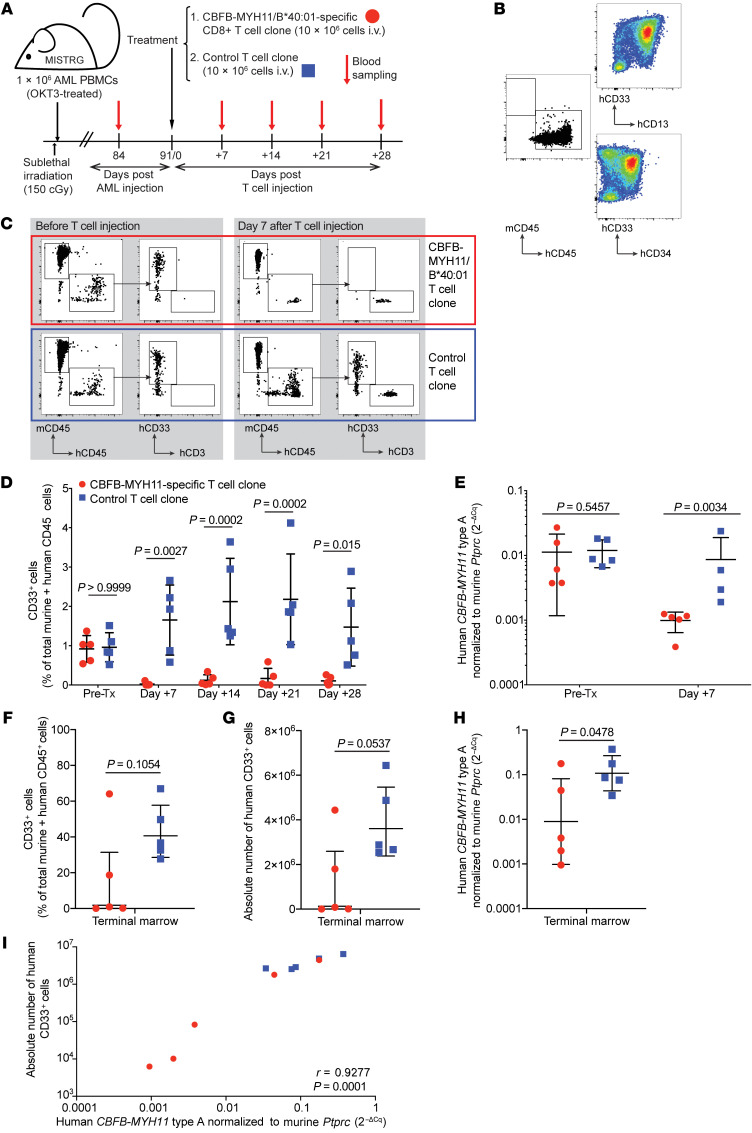
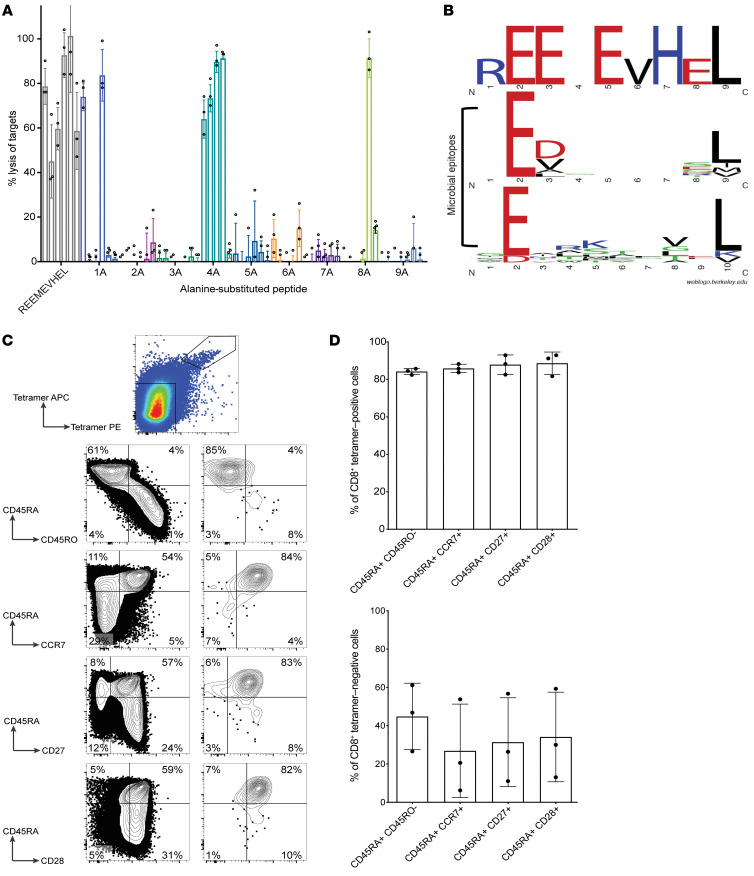
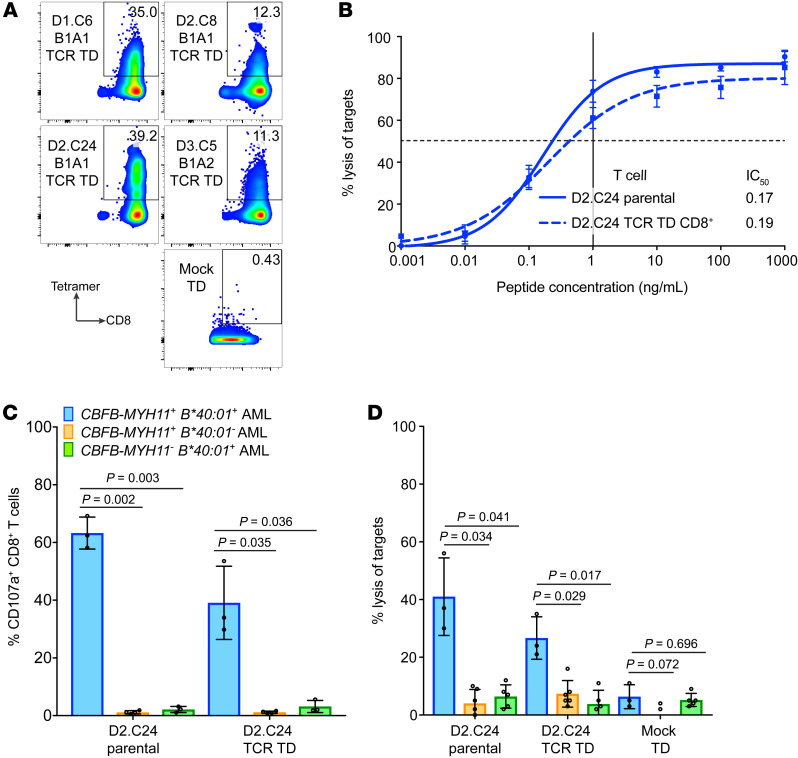
Proteins created from recurrent fusion genes like CBFB-MYH11 are prevalent in acute myeloid leukemia (AML), often necessary for leukemogenesis, persistent throughout the disease course, and highly leukemia specific, making them attractive neoantigen targets for immunotherapy. A nonameric peptide derived from a prevalent CBFB-MYH11 fusion protein was found to be immunogenic in HLA-B*40:01+ donors. High-avidity CD8+ T cell clones isolated from healthy donors killed CBFB-MYH11+ HLA-B*40:01+ AML cell lines and primary human AML samples in vitro. CBFB-MYH11-specific T cells also controlled CBFB-MYH11+ HLA-B*40:01+ AML in vivo in a patient-derived murine xenograft model. High-avidity CBFB-MYH11 epitope-specific T cell receptors (TCRs) transduced into CD8+ T cells conferred antileukemic activity in vitro. Our data indicate that the CBFB-MYH11 fusion neoantigen is naturally presented on AML blasts and enables T cell recognition and killing of AML. We provide proof of principle for immunologically targeting AML-initiating fusions and demonstrate that targeting neoantigens has clinical relevance even in low-mutational frequency cancers like fusion-driven AML. This work also represents a first critical step toward the development of TCR T cell immunotherapy targeting fusion gene-driven AML.

Keywords: Cancer immunotherapy; Immunology; Leukemias; Oncology; T cells.


Conflict of interest statement

Conflict of interest: M. Bleakley is a founder and Scientific Advisory Board member of HighPassBio and a Scientific Advisory Board member of Orca Bio, and has also received compensation from Miltenyi Biotec for presentations at conferences and corporate symposia. The Fred Hutchinson Cancer Research Center has filed a provisional patent application (62/616,261) and a PCT application (PCT/US2019/013323) naming M. Bleakley and MAB as inventors, covering applications of T cell immunotherapy for CBF acute myeloid leukemia. Both applications have lapsed, and as a result, the TCRs are no longer subject to patent rights. RGD and MEC are currently employed by Kite Pharmaceuticals

Figures

Figure 1
Figure 1. Schematic of the type A CBFB-MYH11 fusion resulting from an inversion in chromosome 16.
In the type A fusion, exon 5 of CBFB is fused to exon 34 of MYH11, creating a fusion protein with the junctional amino acid sequence depicted.
Figure 2
Figure 2. Highly avid CD8+ T cells recognizing an HLA-B*40:01–restricted epitope of CBFB-MYH11 can be isolated from healthy donors.
(A) Percentage specific lysis of peptide-pulsed targets for individual wells of CD8+ T cell lines after in vitro peptide stimulation of 2 HLA-B*40:01+ donors. Percent specific lysis was calculated as percent lysis of peptide-pulsed targets minus percent lysis of no-peptide targets to remove nonspecific reactivity to autologous target cells alone. Gray circles indicate wells with no peptide-specific reactivity. The single-peptide specificity of T cells in wells with peptide-specific lysis was subsequently determined: red triangles, REEMEVHEL-specific T cells; black triangles, T cells specific for control (known immunogenic, non–CBFB-MYH11) epitopes. Each plot depicts a single experiment. (B) Percentage lysis of HLA-B*40:01+ LCL targets with REEMEVHEL peptide (circles), pooled additional predicted HLA-B*40:01–binding peptides (squares), or no exogenous peptide (triangles) by REEMEVHEL-specific CD8+ T cell clones isolated from 3 healthy donors in 4-hour CRA. (C) Percentage lysis of HLA-B*40:01+ LCL targets with either REEMEVHEL peptide (circles), known HLA-B*40:01–binding peptide KECVLHDDL (diamonds), or no exogenous peptide (triangles) by REEMEVHEL-specific CD8+ T cell clones in 4-hour CRA. For B and C, peptides were used at 1000 ng/mL each; error bars are SD of 3 biological replicates. (D) Percentage lysis of targets pulsed with various concentrations of REEMEVHEL peptide by REEMEVHEL-specific CD8+ T cell clones. Mean and SEM of 3 technical replicates are shown. (E) Representative flow plots (from 3 experiments) of CBFB-MYH11/HLA-B*40:01 pHLA tetramer staining of REEMEVHEL-specific T cell clones and an irrelevant clone specific for an epitope (IPRAHNRLV) presented on HLA-B*07:02 (negative control). Cells are gated on live single CD4CD8+ cells. (F) Percentage lysis of REEMEVHEL-pulsed LCLs (1000 ng/mL) with varying HLA types (including all class I HLA types of the 3 donors) by 6 REEMEVHEL-specific T cell clones.
Figure 3
Figure 3. T cells specific for the HLA-B*40:01–restricted CBFB-MYH11 epitope kill AML cell lines.
(A) Absolute cell number of viable NB-4 cells either CBFB-MYH11–transduced (TD) (solid line) or mock-TD (dashed line) after coculture with high-avidity REEMEVHEL-specific clone D2.C24 from a representative experiment. (B) Representative flow plots for experiments shown in A and C, depicting viable single cells at time points after coculture. (C) Percentage survival of NB-4 cells, either WT (left) or transduced to express the full-length CBFB-MYH11 type A fusion (right), at time points after coculture with the D2.C24 T cell clone. (D) Absolute cell number of viable ME-1 cells either HLA-B*40:01–TD (solid line) or mock-TD (dashed line) and cocultured with clone D2.C24 from a representative experiment. (E) Representative flow plots for experiments shown in D and F, depicting viable single cells at time points after coculture. (F) Percentage survival of ME-1 cells, either WT (left) or transduced to express HLA-B*40:01 (right), at time points after coculture with the D2.C24 T cell clone. Viable cell numbers were assessed at varying time points by flow cytometry and percent survival calculated as described in Supplemental Methods. For C and F, colored bars indicate mean and error bars SD for 3–10 technical replicate samples. Two-sample unpaired 2-tailed t tests were performed to compare 0 hours with each subsequent time point.
Figure 4
Figure 4. The HLA-B*40:01–restricted CBFB-MYH11 epitope is a bona fide AML antigen.
Four high-avidity T cell clones were tested for recognition of CBFB-MYH11+ HLA-B*40:01+ primary AML, as well as primary AML lacking either the fusion or restricting HLA genotype. (A) Degranulation of T cell clones in response to primary AML was determined by measurement of T cell CD107a presentation in response to stimulation with primary AML (blue bars, CBFB-MYH11+ HLA-B*40:01+, n = 3 different primary AML samples; orange bars, CBFB-MYH11+ HLA-B*40:01, n = 7; green bars, CBFB-MYH11 HLA-B*40:01+, n = 6). (B) Representative flow plots from one CD107a degranulation experiment are shown from left to right: CBFB-MYH11+ HLA-B*40:01+ AML (blue background), negative control stimulators CBFB-MYH11+ HLA-B*40:01 AML (orange background), and CBFB-MYH11 HLA-B*40:01+ AML (green background). (C) Lysis of primary AML by T cell clones was tested in a 4-hour CRA with effector/target (E:T) ratio of 20:1 (blue bars, CBFB-MYH11+ HLA-B*40:01+, n = 3; orange bars, CBFB-MYH11+ HLA-B*40:01, n = 6; green bars, CBFB-MYH11 HLA-B*40:01+, n = 5). For A and C, mean and SD for each clone are shown are from a single experiment with 3–7 biological replicates for each group of AML samples. Statistics were calculated using unpaired 2-tailed t tests with Welch’s correction.
Figure 5
Figure 5. CBFB-MYH11/B*40:01–specific T cells control AML in vivo in a PDX murine model.
(A) Experiment overview: Newborn, preconditioned MISTRG mice were injected intrahepatically with 1 × 10⁶ PBMCs (OKT3-pretreated to prevent xenogeneic graft-versus-host disease) from HLA-B*40:01+ patients with active CBFB-MYH11+ AML. After 12 weeks of AML engraftment, mice received 10 × 106 CD8+ T cells i.v., either D2.C24 clone (high-avidity, CBFB-MYH11/B*40:01–specific) or a control clone (specific for a candidate neoantigen epitope, IPRAHNRLV, presented by HLA-B*07:02, for which this AML was genotypically negative), then were monitored by weekly PB sampling. (B) Primary AML PBMCs (AML1, 81% blasts) before OKT3 treatment and injection into mice were stained for myeloid markers using AML tracking in mice. (C) Representative flow plots of mice PB pretreatment (left) and 7 days after injection (right) with either CBFB-MYH11/B40:01–specific (red box) or control (blue box) T cell clones. (D) Summary of PB disease burden by flow cytometry after CBFB-MYH11/B40:01–specific (red circles) or control (blue squares) T cell treatment. Statistics were calculated using repeated-measures 2-way ANOVA. (E) Human CBFB-MYH11 type A transcript expression, normalized to murine CD45 (Ptprc) as 2–ΔCq, was assessed before and 7 days after administration of CBFB-MYH11/B40:01–specific or control T cells. (FH) AML burden in terminal bone marrow as percentage (F) or absolute number (G) of human CD33+ cells, and relative CBFB-MYH11 type A transcript expression (H). (I) Correlation between marrow disease burden as measured by flow cytometry and real-time qPCR was determined by calculation of Pearson correlation coefficient. For all groups and time points, n = 5, except for control T cell–treated mice on day 7 (n = 4) owing to poor RNA yield from 1 sample. Except where noted, statistics were calculated using unpaired 2-tailed parametric t tests. Mean and SD are shown.
Figure 6
Figure 6. CBFB-MYH11/B*40:01–specific CD8+ T cells recognize a unique epitope and have a naive phenotype in healthy donors.
(A) Percentage lysis by REEMEVHEL-specific T cell clones of HLA-B*40:01+ LCLs pulsed with individual peptides (at 1000 ng/mL) with alanine substitution at each position. Each bar represents percentage lysis of targets by one T cell clone from 3 technical replicate experiments with mean and SD shown. (B) Sequence logo of critical residues of the CBFB-MYH11/B*40:01 epitope for T cell clones compared with residues shared among known HLA-B*40:01–restricted microbial epitopes from IEDB. (C) Phenotypic evaluation of epitope-specific T cells isolated in healthy donors by CBFB-MYH11/B*40:01 tetramer enrichment of PBMCs from healthy donors and surface marker staining. Representative flow plots of viable CD8+ single cells from tetramer enrichment of donor D1 are shown (of 3 biological replicate experiments summarized in D). (D) Summary of phenotypic evaluation from C across 3 biological replicates (donors D1–D3); mean and SD are shown.
Figure 7
Figure 7. TCRs specific for the CBFB-MYH11/B*40:01 epitope confer antileukemic activity.
(A) Expression of transgenic TCRs in CD8+ T cells transduced (TD) with D1.C6 B1A1, D2.C8 B1A1, D2.C24 B1A1, and D3.C5 B1A2 TCR constructs or mock-TD is shown by staining with CBFB-MYH11/B*40:01 tetramer from a single experiment. (B) HLA-B*40:01+ LCLs pulsed with REEMEVHEL peptide at various concentrations were lysed in CRA by D2.C24 TCR-TD CD8+ T cells (dashed line) and D2.C24 parental clone (solid line). Mean and SEM for 3 technical replicates are shown. (C) Degranulation of D2.C24 TCR-TD CD8+ T cells and D2.C24 parental clone in response to primary AML was determined by measurement of T cell CD107a presentation in response to stimulation with primary AML (blue bars, CBFB-MYH11+ HLA-B*40:01+, n = 3 different primary AML samples; orange bars, CBFB-MYH11+ HLA-B*40:01, n = 3; green bars, CBFB-MYH11 HLA-B*40:01+, n = 4). (D) Lysis of primary AML by D2.C24 TCR-TD CD8+ T cells, D2.C24 parental clone, and mock-TD CD8+ T cells was evaluated in a standard 4-hour CRA with E:T of 20:1 (CBFB-MYH11+ HLA-B*40:01+, n = 3 different AML samples; CBFB-MYH11+ HLA-B*40:01, n = 6; CBFB-MYH11 HLA-B*40:01+, n = 5). For C and D, mean and SD are shown. Statistics were calculated using unpaired 2-tailed t tests with Welch’s correction.

Comment on

References

    1. Bolouri H, et al. The molecular landscape of pediatric acute myeloid leukemia reveals recurrent structural alterations and age-specific mutational interactions. Nat Med. 2018;24(1):103–112. doi: 10.1038/nm.4439. - DOI - PMC - PubMed
    1. Speck NA, Gilliland DG. Core-binding factors in haematopoiesis and leukaemia. Nat Rev Cancer. 2002;2(7):502–513. doi: 10.1038/nrc840. - DOI - PubMed
    1. Yarchoan M, Johnson BA, Lutz ER, Laheru DA, Jaffee EM. Targeting neoantigens to augment antitumour immunity. Nat Rev Cancer. 2017;17(4):209–222. doi: 10.1038/nrc.2016.154. - DOI - PMC - PubMed
    1. Coulie PG, Van den Eynde BJ, van der Bruggen P, Boon T. Tumour antigens recognized by T lymphocytes: at the core of cancer immunotherapy. Nat Rev Cancer. 2014;14(2):135–146. doi: 10.1038/nrc3670. - DOI - PubMed
    1. Biernacki MA, Bleakley M. Neoantigens in hematologic malignancies. Front Immunol. 2020;11:121. - PMC - PubMed

Publication types