. 2019 Feb 1;871(2):161.
doi: 10.3847/1538-4357/aaf71f. Epub 2019 Jan 29.

Simultaneous X-Ray and Infrared Observations of Sagittarius A*'s Variability

Affiliations

Simultaneous X-Ray and Infrared Observations of Sagittarius A*'s Variability

H Boyce et al. Astrophys J. .

Abstract

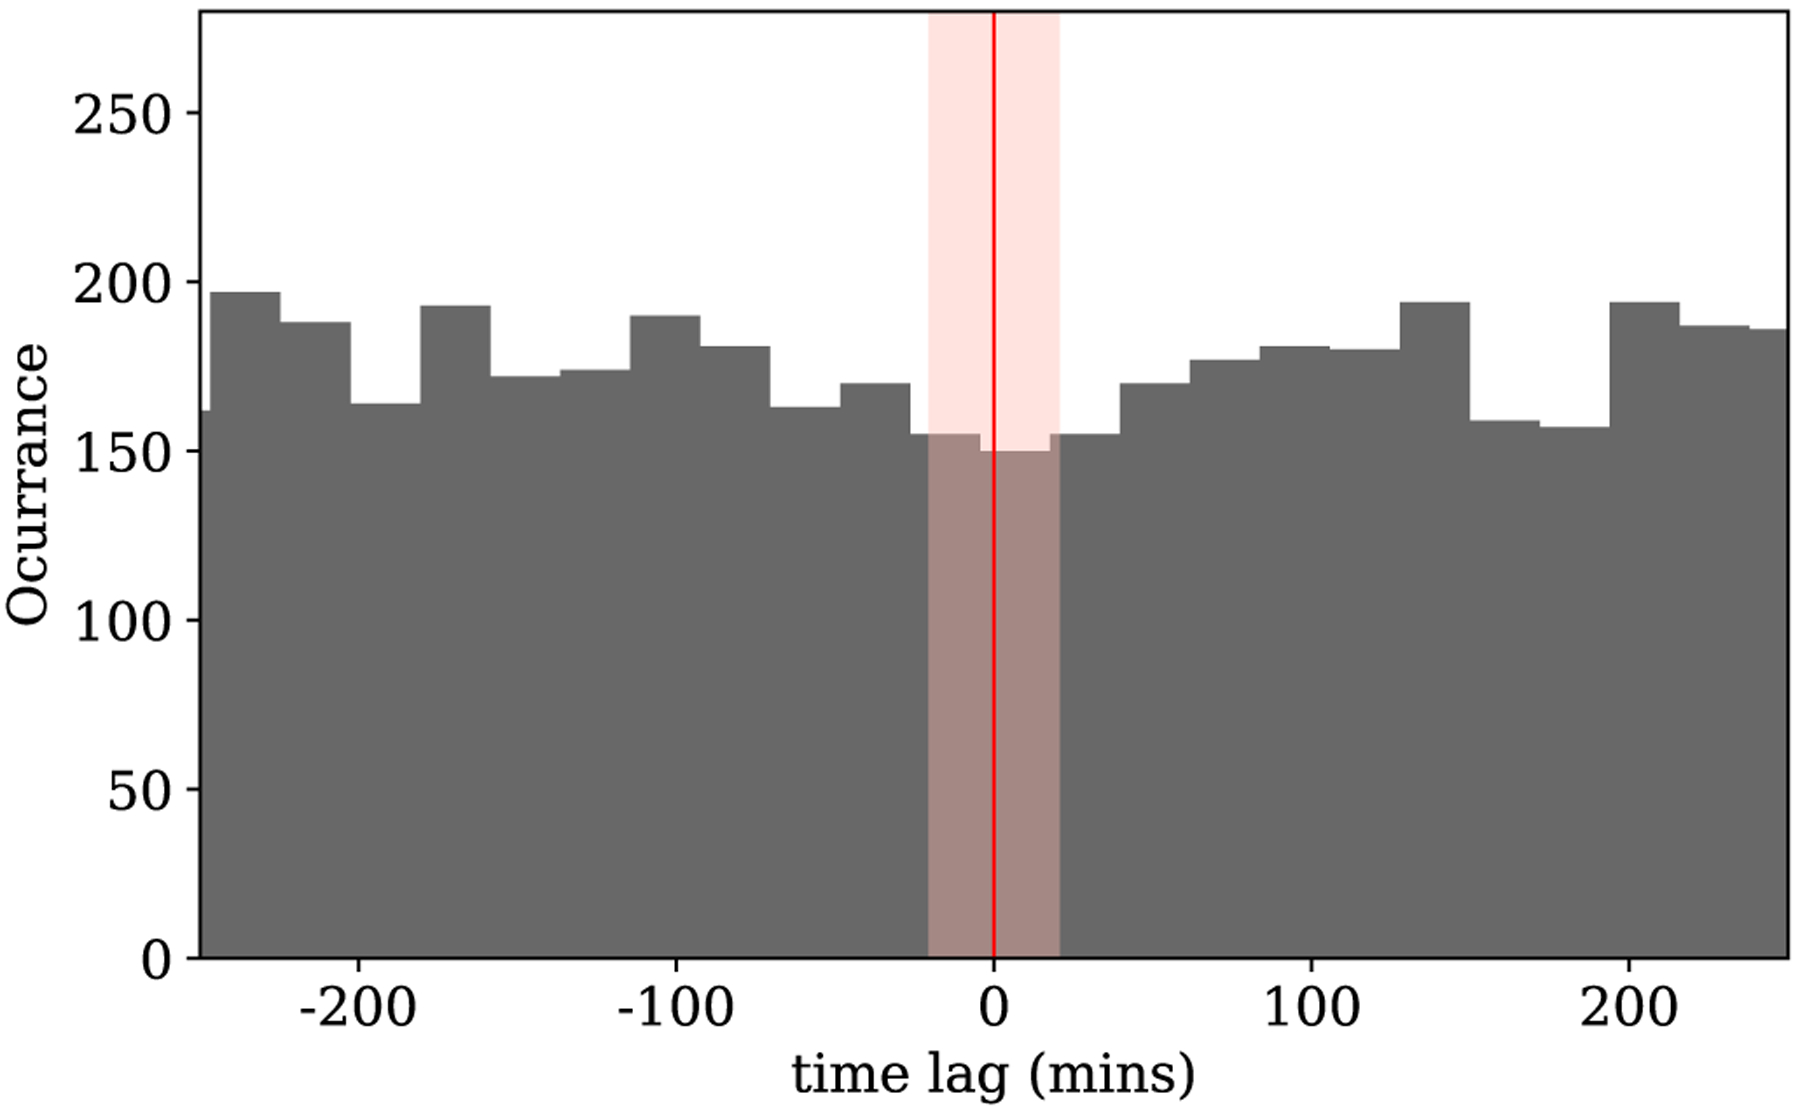
Emission from Saggitarius A* is highly variable at both X-ray and infrared (IR) wavelengths. Observations over the last ~20 yr have revealed X-ray flares that rise above a quiescent thermal background about once per day, while faint X-ray flares from Sgr A* are undetectable below the constant thermal emission. In contrast, the IR emission of Sgr A* is observed to be continuously variable. Recently, simultaneous observations have indicated a rise in IR flux density around the same time as every distinct X-ray flare, while the opposite is not always true (peaks in the IR emission may not be coincident with an X-ray flare). Characterizing the behavior of these simultaneous X-ray/IR events and measuring any time lag between them can constrain models of Sgr A*'s accretion flow and the flare emission mechanism. Using 100+ hours of data from a coordinated campaign between the Spitzer Space Telescope and the Chandra X-ray Observatory, we present results of the longest simultaneous IR and X-ray observations of Sgr A* taken to date. The cross-correlation between the IR and X-ray light curves in this unprecedented data set, which includes four modest X-ray/IR flares, indicates that flaring in the X-ray may lead the IR by approximately 10-20 min with 68% confidence. However, the 99.7% confidence interval on the time-lag also includes zero, i.e., the flaring remains statistically consistent with simultaneity. Long-duration and simultaneous multi-wavelength observations of additional bright flares will improve our ability to constrain the flare timing characteristics and emission mechanisms, and must be a priority for Galactic Center observing campaigns.

Keywords: Galaxy: center; accretion, accretion disks; black hole physics; radiation mechanisms: non-thermal.


Figures

Figure 1.
Figure 1.
Simultaneous IR and X-ray light curves of Sgr A*. Plotted in gray/red is the excess flux density (mJy) of the pixel containing Sgr A* from Spitzer 4.5 μm observations (see Section 2.1 of Witzel et al. 2018). Times for each epoch are relative to the beginning of the Spitzer observations, measured in Heliocentric Modified Julian Date. Gray dots are the flux densities of each 6.4 s BCD coadd, while the red line shows the data binned over 3.5 min. Chandra light curves of Sgr A* at 2–8 keV are plotted in purple with 300 s binning. The p0 = 0.05 Bayesian Blocks results are overplotted on the X-ray curves in orange. Labels 1–4 indicate the four IR flux peaks associated with significant X-ray activity.
Figure 2.
Figure 2.
Results from running the ZDCF on the three epochs that have X-ray flaring activity. The top row shows the data zoomed in on the portions of the light curves where we see significant X-ray activity. Labels 1–4 indicate the four IR peaks associated with this activity and also marked in Figure 1. X-ray data are displayed in purple with 5 min bins, and IR is displayed in red with 3.5 min bins. Their respective envelopes show the 95% range of the 10,000 Monte Carlo (MC) realizations of the light curves. The third panel (2017 July 15) zooms in on two sections of the light curve. The bottom row shows results of running the z-transform discrete correlation function (ZDCF) on the entire ~24 hr light curves for each of the dates in the top panels. The blue envelope is the 95% range of results from running the MC realizations of the X-ray and IR light curves through the ZDCF, while the gray envelope is the 95% range of the results of running the IR MC realizations through the ZDCF with 10,000 realizations of simulated Poisson noise consistent with the characteristics of the X-ray quiescent emission (no flares). The time lag and 68% confidence interval from running PLIKE on the 10,000 MC ZDCF results is displayed in the top left corner of these panels. The negative values for the position of the peaks indicate that the X-ray leads the IR.
Figure 3.
Figure 3.
Histogram of all the time lags measured in our 6000 simulations. The pink shaded region marks the range from −20 to +20 min and the thin red line marks zero time-lag.
Figure 4.
Figure 4.
Time lags between IR and X-ray flares as reported in this work and in the literature. Plotted in black are the time lags from the three epochs in this work with significant X-ray and IR activity and their 68% confidence intervals determined from the distribution of 10,000 time lags measured from our MC realizations of our light curves. Plotted in solid gray are the results of the cross-correlation of the isolated sections of the 2017 July 15 light curve containing IR flares 3 and 4. Regions marked with dashed lines come from works that describe the flares to be “simultaneous to within x minutes” but quote no uncertainties (Eckart et al. 2004, 2006a, 2008, 2012; Hornstein et al. 2007; Dodds-Eden et al. 2009; Ponti et al. 2017). For example, Eckart et al. (2004) report an X-ray and IR flare that are simultaneous to within 15 min, so we mark that with a line symmetric around zero ranging from −15 min to 15 min. Several other works report simultaneity between the X-ray and IR peaks, but do not report a time frame within which that claim can be considered valid (Yusef-Zadeh et al. 2006, 2009; Trap et al. 2011). The upper limit from Hornstein et al. (2007) indicates an X-ray flare whose peak occurred 36 min before IR observations began. Yusef-Zadeh et al. (2012) is the only work to report any time lag between the X-ray and IR with error bars. We re-analyze the seven flares presented in their work and plot the results of our re-analysis here. Five of these flares come from previously reported data sets (color coded as green, blue, magenta, and orange for Eckart et al. 2006a, ; Dodds-Eden et al. 2009, and Yusef-Zadeh et al. 2009 respectively) and two come from a previously unreported data set (plotted in gray). The significance of the X-ray flares in these last two data sets is very low (see Section 4.3).
Figure 5.
Figure 5.
X-ray and IR light curves discussed in Yusef-Zadeh et al. (2012) and the cross-correlations we find in our MC analysis. First and third row panels display the light curves along with the 95% envelopes of our MC realizations generated by drawing from a normal distribution centered around the true data with a standard deviation proportional to the errors on the light curves. Symbols and line styles are identical to those in Figure 2. For this visualization, the y-scales are arbitrary, and the black line in the upper right of each white panel indicates a 30 min interval. The results of the ZDCF on the real light curves are displayed in black in the corresponding lower panels, while the MC envelope from which the time lags are measured is displayed in blue. The resulting time lags and confidence intervals are reported in column five of Table 3 and plotted in Figure 4. Table 3 lists the dates, original papers, and facilities from which the IR and X-ray light curves come. All X-ray light curves were binned at 300 s except for F and G, which were binned at 1500 s. IR light curves A, B, and C were binned at 140 s, while light curves D and E were binned at 144 s and light curves F and G were binned at 120 s.
Figure 6.
Figure 6.
Sgr A* X-ray light curves extracted from Chandra ObsID 9169 (light curve F) and ObsID 9173 (light curve G). Top: light curves with 300 s binning. Orange displays the Bayesian Blocks results with p0 = 0.1. Bottom: light curves with 1500 s (25 min) binning. Gray dashed lines indicate the same interval analyzed by Yusef-Zadeh et al. (2012).

References

    1. Alexander T 1997, in Astronomical Time Series, Vol 218, ed. Maoz D, Sternberg A, & Leibowitz EM (Dordrecht: Kluwer; ), 163
    1. Alexander T 2013, arXiv:13021508
    1. Baganoff FK, Bautz MW, Brandt WN, et al. 2001, Natur, 413, 45 - PubMed
    1. Baganoff FK, Maeda Y, Morris M, et al. 2003, ApJ, 591, 891
    1. Ball D, Özel F, Psaltis D, & Chan C-K 2016, ApJ, 826, 77