. 2019 Aug:141:35-46.
doi: 10.1016/j.ijengsci.2019.05.014. Epub 2019 May 31.

Computational Modeling Predicts Immuno-Mechanical Mechanisms of Maladaptive Aortic Remodeling in Hypertension

Affiliations

Computational Modeling Predicts Immuno-Mechanical Mechanisms of Maladaptive Aortic Remodeling in Hypertension

Marcos Latorre et al. Int J Eng Sci. 2019 Aug.

Abstract

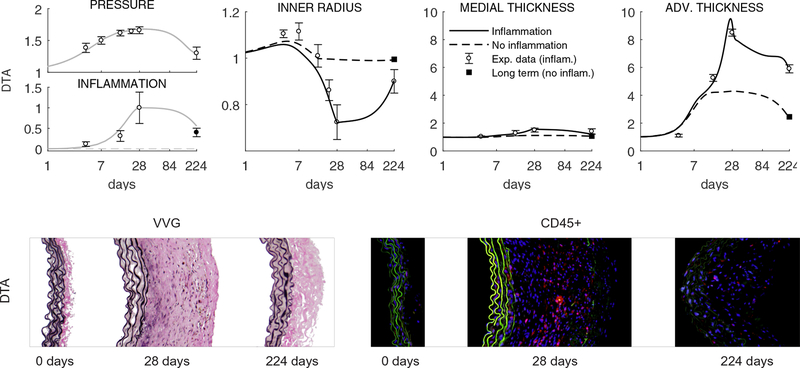
Uncontrolled hypertension is a major risk factor for myriad cardiovascular diseases. Among its many effects, hypertension increases central artery stiffness which in turn is both an initiator and indicator of disease. Despite extensive clinical, animal, and basic science studies, the biochemomechanical mechanisms by which hypertension drives aortic stiffening remain unclear. In this paper, we show that a new computational model of aortic growth and remodeling can capture differential effects of induced hypertension on the thoracic and abdominal aorta in a common mouse model of disease. Because the simulations treat the aortic wall as a constrained mixture of different constituents having different material properties and rates of turnover, one can gain increased insight into underlying constituent-level mechanisms of aortic remodeling. Model results suggest that the aorta can mechano-adapt locally to blood pressure elevation in the absence of marked inflammation, but large increases in inflammation drive a persistent maladaptive phenotype characterized primarily by adventitial fibrosis. Moreover, this fibrosis appears to occur via a marked increase in the rate of deposition of collagen having different material properties in the absence of a compensatory increase in the rate of matrix degradation. Controlling inflammation thus appears to be key to reducing fibrosis, but therapeutic strategies should not compromise the proteolytic activity of the wall that is essential to mechanical homeostasis.

Keywords: aorta; blood pressure; constrained mixture; inflammation; wall stress.


Conflict of interest statement

Conflict of Interest The authors declare no conflict of interest, financial or otherwise.

Figures

Figure 1:
Figure 1:
Columns one and two: Nonlinear regressions of mean pressure-diameter (at in vivo axial stretch and during unloading) and axial force-length (at luminal pressure of 100 mmHg and during unloading) experimental data (symbols), for the IAA (first row) and DTA (second row), computed with associated rate-independent G&R models (cf. Appendix 1 in Latorre and Humphrey 2018b). Albeit not shown, experimental tests at 7 and 21 days, as well as pressure-diameter tests at 0.95- and 1.05-fold axial stretches and force-length tests at 60 and 140 mmHg, were also included in the regression, with similar outcomes. Columns three and four: Evolution of best-fit model parameters in tension c1α+ and c2α+ for collagen (α = c, solid line) and smooth muscle (α = m, dashed line) as a function of the inflammatory cell burden Δϱφ, as given by a progressive nonlinear regression. Note that c1,2α+(0)=c1,2oα+ and c1,2α+(1)=c1,2hα+, consistent with original (o) and evolved homeostatic (h) values in Table 1.
Figure 2:
Figure 2:
Model predictions of evolving passive biaxial mechanical responses with (second and fourth rows) or without (first and third rows) inclusion of the measured extents of inflammation. Pressure-diameter responses at individual values of in vivo axial stretch (first column) and axial force-length responses at a fixed luminal pressure of 100 mmHg (second column), as well as associated circumferential (third column) and axial (fourth column) Cauchy stress-stretch behaviors, for the IAA (first and second rows) and DTA (third and fourth rows) at baseline (0 days) and after 7, 14, 21, and 28 days of AngII infusion (cf. Figure S3 in Bersi et al. 2017).
Figure 3:
Figure 3:
Model predictions of geometric (bilayered, with all quantities normalized to values at time 0 prior to AngII infusion) properties for the IAA (first row) and DTA (second row) following a rapid 1.68-fold increase in systolic pressure that persists up to s = 28 days (grey lines, model inputs). Predictions are shown with (black solid) or without (black dashed) inclusion of inflammatory effects, the former with a modest 4.9-fold increase in the IAA but a marked 67.6-fold increase in the DTA (respective grey lines, additional model inputs). Shown, too, are mean ± SEM experimental values (open circles with error bars) extracted from Bersi et al. (2017), as well as the associated mechanobiologically equilibrated (fully relaxed, at s > 28 days for IAA, but at s ≈ 14 days for DTA) solution for the case with no inflammation and P/Po = 1.68 (solid black square). Note a similar wall thickening in both cases in the IAA, although the luminal radius tends to return to normal in the simulation without inflammatory effects; note, too, a dramatic increase in adventitial versus medial thickening in the DTA after 14 days consistent with a delayed but exuberant production of inflammatory collagen within the adventitia.
Figure 4:
Figure 4:
Evolving geometric, material and structural properties for the IAA (first and third rows) and DTA (second and fourth rows). Model predictions, with (solid) and without (dashed) inclusion of inflammatory effects, of (from left to right and top to bottom) wall thickness in unloaded traction-free configuration htf (μm), in-vivo axial stretch λziv, circumferential σθθand axial σzz stress (kPa), circumferential cθθθθ and axial czzzz stiffness (MPa−1), stored energy density per unit current volume relative to its value at time 0 prior to AngII infusion W − Wo (to enable proper comparisons between energy functions with different referential values, cf. Eq. (S1) in Bersi et al., 2017), and distensibility D (MPa1) computed over time throughout AngII infusion at time-dependent systolic pressures (Figure 3). Symbols and error bars represent mean ± SEM experimental values (with inflammatory cell infiltration) at six times throughout the evolution: baseline (0 days), 4, 7, 14, 21 and 28 days (cf. Figure 1 in Bersi et al., 2017).
Figure 5:
Figure 5:
Top row: Model results for long-term responses – up to 196 days after terminating the AngII infusion at 28 days – of normalized geometric (bilayered) properties for the DTA following a 1.68-fold increase in systolic pressure (grey line, model input) that persists up to s = 28 days but drops to P/Po = 1.26 during the subsequent 196 days (note the logarithmic scale starting at s = 1 day as well as the non-monotonic change in prescribed inflammation and computed geometry at s = 28 days). Predictions are shown with (black solid line) and without (black dashed line) inclusion of inflammatory effects that were measured up to 28 days (respective grey lines, additional model inputs). Shown, too, are mean ± SEM experimental values (open circles with error bars) extracted from Bersi et al. (2017), as well as the associated mechanobiologically equilibrated (adaptive, fully relaxed) solution for the case with no inflammation and P/Po = 1.26 (solid black square). Note that the model predicted that some inflammatory effects needed to remain in order to describe the observed long-term, persistent maladaptive, response at 224 days. Bottom row: Based on this prediction, we examined available but previously unanalyzed histological sections (Verhoeff Van Gieson, or VVG, staining shows elastic fibers in black and collagen in pink; note the dramatic adventitial thickening due mainly to excessive collagen) and indeed found a continuing presence of inflammatory cells at 224 days (red immunostained CD45+ cells, a pan-inflammatory marker), which was quantified and is shown by the solid circle with error bar. This correspondence served as a further validation of the predictive capability of the model.

References

    1. Agianniotis A, Stergiopulos N (2012) Wall properties of the apolipoprotein E-deficient mouse aorta. Atherosclerosis 223(2):314–320 - PubMed
    1. Alonso F, Krattinger N, Mazzolai L, Simon A, Waeber G, Meda P, Haefliger JA (2010) An angiotensin II- and NF-B-dependent mechanism increases connexin 43 in murine arteries targeted by renin-dependent hypertension. Cardiovascular research 87(1):166–176 - PMC - PubMed
    1. Asanuma K, Magid R, Johnson C, Nerem RM, Galis ZS (2003) Uniaxial strain upregulates matrix-degrading enzymes produced by human vascular smooth muscle cells. American Journal of Physiology-Heart and Circulatory Physiology 284(5):H1778–H1784 - PubMed
    1. Bardy N, Merval R, Benessiano J, Samuel JL, Tedgui A (1996) Pressure and angiotensin II synergistically induce aortic fibronectin expression in organ culture model of rabbit aorta: evidence for a pressure-induced tissue renin-angiotensin system. Circulation Research 79(1):70–78 - PubMed
    1. Bellini C, Bersi MR, Caulk AW, Ferruzzi J, Milewicz DM, Ramirez F, Rifkin DB, Tellides G, Yanagisawa H, Humphrey JD (2017) Comparison of 10 murine models reveals a distinct biomechanical phenotype in thoracic aortic aneurysms. Journal of The Royal Society Interface 14(130):20161036 - PMC - PubMed