. 2020;216(5):103.
doi: 10.1007/s11214-020-00721-7. Epub 2020 Jul 30.

The ELFIN Mission

V Angelopoulos  1   2 E Tsai  1   2 L Bingley  1   2 C Shaffer  1   3 D L Turner  1   4 A Runov  1   2 W Li  1   2   5 J Liu  1   2 A V Artemyev  1   2 X-J Zhang  1   2 R J Strangeway  1   2 R E Wirz  6 Y Y Shprits  1   7 V A Sergeev  8 R P Caron  1   2 M Chung  1   4 P Cruce  1   9 W Greer  1   2 E Grimes  1   2 K Hector  1   2   10 M J Lawson  1   2 D Leneman  1   2 E V Masongsong  1   2 C L Russell  1   2 C Wilkins  1   2 D Hinkley  11 J B Blake  11 N Adair  1   12   2 M Allen  1   2   9 M Anderson  1   13   2 M Arreola-Zamora  1   2 J Artinger  1   2   14 J Asher  1   2   4 D Branchevsky  1   11   2 M R Capitelli  1   12   2 R Castro  1   2   10 G Chao  1   15   2 N Chung  1   16   2 M Cliffe  1   17   2 K Colton  1   18   2 C Costello  1   19   2 D Depe  1   20   2 B W Domae  1   20   2 S Eldin  1   20   2 L Fitzgibbon  1   2   3 A Flemming  1   2   9 I Fox  1   2   6 D M Frederick  1   12   2 A Gilbert  1   20   2 A Gildemeister  1   2   9 A Gonzalez  1   17   2 B Hesford  1   21   2 S Jha  1   19   2 N Kang  1   12   2 J King  1   19   2 R Krieger  1   2   22 K Lian  1   2   9 J Mao  1   2   23 E McKinney  1   2   24 J P Miller  1   19   2 A Norris  1 M Nuesca  1   19   2 A Palla  1   19   2 E S Y Park  1   2   25 C E Pedersen  1   2   6 Z Qu  1   2   6 R Rozario  1   17   2 E Rye  1   20   2 R Seaton  1   2   6 A Subramanian  1   2   9 S R Sundin  1   2   3 A Tan  1   2   26 W Turner  1   2   14 A J Villegas  1   2   14 M Wasden  1   2   6 G Wing  1   19   2 C Wong  1   2   14 E Xie  1   20   2 S Yamamoto  1   2   6 R Yap  1   2   27 A Zarifian  1   21   2 G Y Zhang  1   2   28
Affiliations

The ELFIN Mission

V Angelopoulos et al. Space Sci Rev. 2020.

Abstract

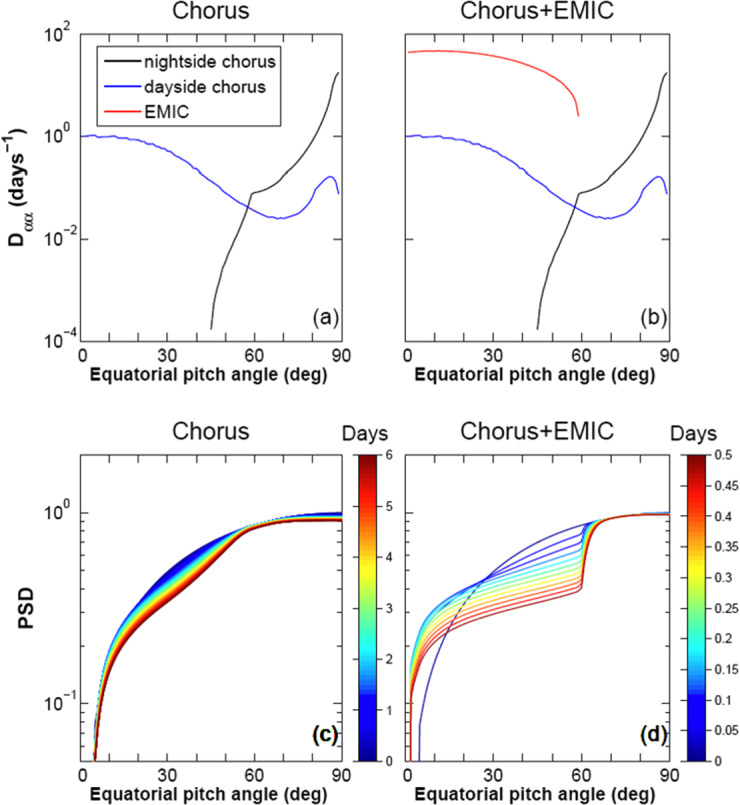
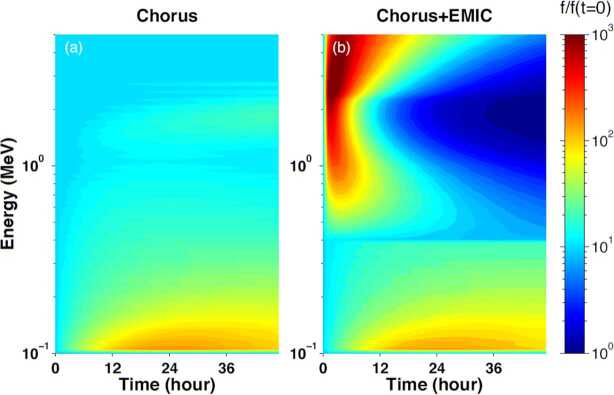
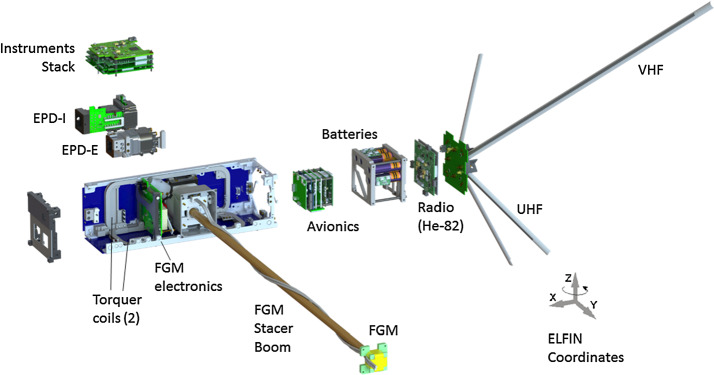
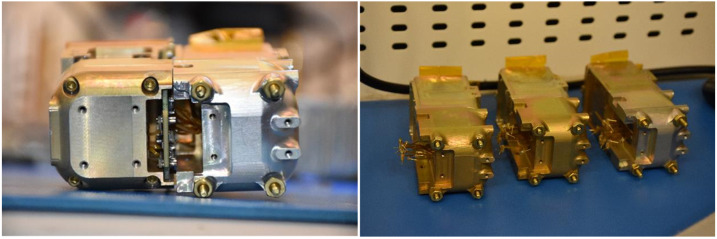
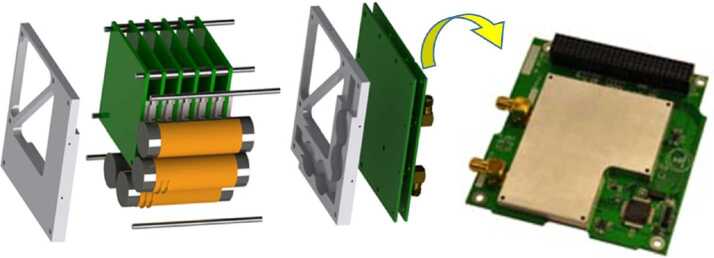
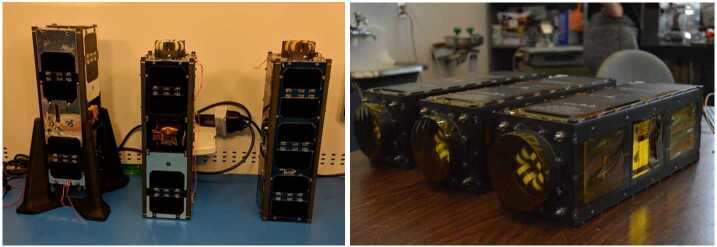
The Electron Loss and Fields Investigation with a Spatio-Temporal Ambiguity-Resolving option (ELFIN-STAR, or heretoforth simply: ELFIN) mission comprises two identical 3-Unit (3U) CubeSats on a polar (∼93 inclination), nearly circular, low-Earth (∼450 km altitude) orbit. Launched on September 15, 2018, ELFIN is expected to have a >2.5 year lifetime. Its primary science objective is to resolve the mechanism of storm-time relativistic electron precipitation, for which electromagnetic ion cyclotron (EMIC) waves are a prime candidate. From its ionospheric vantage point, ELFIN uses its unique pitch-angle-resolving capability to determine whether measured relativistic electron pitch-angle and energy spectra within the loss cone bear the characteristic signatures of scattering by EMIC waves or whether such scattering may be due to other processes. Pairing identical ELFIN satellites with slowly-variable along-track separation allows disambiguation of spatial and temporal evolution of the precipitation over minutes-to-tens-of-minutes timescales, faster than the orbit period of a single low-altitude satellite (Torbit ∼ 90 min). Each satellite carries an energetic particle detector for electrons (EPDE) that measures 50 keV to 5 MeV electrons with Δ E/E < 40% and a fluxgate magnetometer (FGM) on a ∼72 cm boom that measures magnetic field waves (e.g., EMIC waves) in the range from DC to 5 Hz Nyquist (nominally) with <0.3 nT/sqrt(Hz) noise at 1 Hz. The spinning satellites (Tspin 3 s) are equipped with magnetorquers (air coils) that permit spin-up or -down and reorientation maneuvers. Using those, the spin axis is placed normal to the orbit plane (nominally), allowing full pitch-angle resolution twice per spin. An energetic particle detector for ions (EPDI) measures 250 keV - 5 MeV ions, addressing secondary science. Funded initially by CalSpace and the University Nanosat Program, ELFIN was selected for flight with joint support from NSF and NASA between 2014 and 2018 and launched by the ELaNa XVIII program on a Delta II rocket (with IceSatII as the primary). Mission operations are currently funded by NASA. Working under experienced UCLA mentors, with advice from The Aerospace Corporation and NASA personnel, more than 250 undergraduates have matured the ELFIN implementation strategy; developed the instruments, satellite, and ground systems and operate the two satellites. ELFIN's already high potential for cutting-edge science return is compounded by concurrent equatorial Heliophysics missions (THEMIS, Arase, Van Allen Probes, MMS) and ground stations. ELFIN's integrated data analysis approach, rapid dissemination strategies via the SPace Environment Data Analysis System (SPEDAS), and data coordination with the Heliophysics/Geospace System Observatory (H/GSO) optimize science yield, enabling the widest community benefits. Several storm-time events have already been captured and are presented herein to demonstrate ELFIN's data analysis methods and potential. These form the basis of on-going studies to resolve the primary mission science objective. Broad energy precipitation events, precipitation bands, and microbursts, clearly seen both at dawn and dusk, extend from tens of keV to >1 MeV. This broad energy range of precipitation indicates that multiple waves are providing scattering concurrently. Many observed events show significant backscattered fluxes, which in the past were hard to resolve by equatorial spacecraft or non-pitch-angle-resolving ionospheric missions. These observations suggest that the ionosphere plays a significant role in modifying magnetospheric electron fluxes and wave-particle interactions. Routine data captures starting in February 2020 and lasting for at least another year, approximately the remainder of the mission lifetime, are expected to provide a very rich dataset to address questions even beyond the primary mission science objective.

Keywords: Auroral; CubeSat; EMIC; Electron; Energetic particle detector; Fluxgate magnetometer; Ionosphere; Loss cone; Magnetosphere; Particle precipitation; Pitch angle scattering; UCLA; Van Allen radiation belts; electromagnetic ion cyclotron waves.


Figures

Fig. 1
Fig. 1
Details of the three types of radiation belt responses to storm-time ring current enhancements. (a) A strong increase in relativistic electron fluxes in response to the January 1997 geomagnetic storm. (b) A dramatic and permanent loss of electrons throughout the outer belt in May 1999. (c) A 100 nT storm in February 1998 with post-storm fluxes similar to pre-storm
Fig. 2
Fig. 2
SAMPEX data (from Bortnik et al. 2006) showing examples of precipitation bands (PBs) on 20 November 2003 at (a) the beginning of the storm and (b) during the storm main phase. The SAMPEX flux at the same location, but on the previous day (19 November 2003), is shown in gray
Fig. 3
Fig. 3
Evolution of normalized 1 MeV electron phase space density as a function of pitch angle at L=4.5 using the wave-scattering model in Li et al. (2007) Top: Bounce-averaged pitch-angle scattering rates caused by chorus only (left) and chorus plus EMIC waves (right). Bottom: Evolution of phase space density (color coded by time in days) due to chorus only (left) and chorus plus EMIC waves (right). EMIC waves are even more effective at energies >1 MeV
Fig. 4
Fig. 4
ELFIN with its deployed fluxgate magnetometer boom and spin axis, S, which will be nominally positioned near the orbit normal
Fig. 5
Fig. 5
Equatorial versus local pitch angle (at the anticipated life-time average ELFIN altitude) of h=400 km, at various L-shells (in color). Dashed horizontal lines indicate the equatorial loss cone
Fig. 6
Fig. 6
Phase space density (f) evolution near the loss cone (normalized to f at t=0), using the wave model of Li et al. ; and Shprits et al. and assuming scattering by chorus only (left) and chorus plus EMIC waves (right) at L=4.5
Fig. 7
Fig. 7
Energy vs. pitch-angle spectra, at 400 km (L=4.5) normalized by the trapped flux (at local pitch angle α=90) after 12 hrs of interaction, using the wave model in Fig. 6 (adapted from Shprits et al. 2008)
Fig. 8
Fig. 8
ELFIN exploded view after boom deployment
Fig. 9
Fig. 9
ELFIN instruments in ELFIN’s 3U volume in CAD fashion (with magnetometer boom shown deployed) and as an image after instrument integration into the spacecraft. The instrument stack boards shown atop the EPD are the Switching Instrument Power Supply (receiving raw power and conditioning and distributing it to the two instruments), the Instrument Data Processing Unit (discussed in the text), and two digital processing EPD boards, D1 and D2, which interface with the IDPU on the one side and the Electronics Front End (EFE) and Preamplifier (Preamp) boards of the EPD instrument on the other. The latter two boards are not visible here but will be discussed in the EPD paper. Additionally the Fluxgate Magnetometer Electronics (FGE) board is shown in the schematic and after mission integration. It hosts all electronics needed to operate the FGM and interfaces directly with the IDPU. Nearly all of the FGM electronics have been integrated into the Multi-Chip Module (gold, most sizeable component). To avoid drum-heading, a Delrin strap (visible in the picture on top of the MRM) was attached to an H-brace at the back of the FGE late in the program. The FGM sensor was blanketed prior to flight (orange blankets evident in the image were not included in the CAD schematic). The FGM stacer boom (FGB), coiled inside a canister in the stowed configuration, was deployed by the tension release initiated by a shaped memory alloy actuator, a lug attached to (but external to) the FGB, visible in both the schematic and the picture between FGE and FGB
Fig. 10
Fig. 10
A table-top view of all the satellite subsystems, including instruments, bus avionics, torquecoils and structure, is seen prior to spacecraft integration and environmental tests. The picture zooms into the Flight Model 2 (FM2) components (encompassed by the white dashed parallelogram). Components for FM1 and the highest fidelity engineering model (EM3) are also depicted on its two sides
Fig. 11
Fig. 11
ELFIN’s flight FGM sensors before integration to the spacecraft (left) and after FGM flight-unit boom deployment tests (right)
Fig. 12
Fig. 12
Schematic of ELFIN’s EPD detector comprising an ion and electron head. The bias and front-end electronics modules are in a board sandwiched between the two heads; while the preamp board is behind the shorter ion head
Fig. 13
Fig. 13
Pictures of integrated EPD sensor heads: Left: view (from back) of both ion and electron heads (+Z is down, electron head is on the right), showing the front-end electronics module. Right: two FMs and one EM of electron detector heads after integration with detectors
Fig. 14
Fig. 14
Bus components on the avionics side. The stack contains six avionics boards and four batteries provided by The Aerospace Corporation, plus two boards: the Big etcetera (BETC) board, and the radio board, a “Helium-82” radio by AstroDev (VHF up/UHF down). A top-down view of the radio is shown on the right. The stack is encapsulated in shielding material and blankets to ensure good thermal isolation and control of the batteries, and electromagnetic noise isolation from the instruments. The integrated stack is shown prior to bus integration in Fig. 10
Fig. 15
Fig. 15
Bus mechanical structure
Fig. 16
Fig. 16
Left: Integrated ELFIN spacecraft (from left to right: two FMs and one EM). Right: Spacecraft inside PPODs, showing how antenna tuna-can takes advantage of the extra volume available for launch
Fig. 17
Fig. 17
Left: UCLA’s Knudsen North station with four UHF yagi antennas (downlink) and two VHF yagis (uplink, using power 10 W). The spacing between UHF antennas is 6 feet on each side, and the spacing between VHF antennas is 10 feet. Right: Knudsen South station is a two VHF yagi providing higher output power (100 W). Both stations can be used simultaneously and provide flexibility when both ELFIN satellites are within view
Fig. 18
Fig. 18
ELFIN’s Mission Operations Center at UCLA
Fig. 19
Fig. 19
ELFIN’s orbit plots (example taken from: https://elfin.igpp.ucla.edu/ → Science Overview → Summary Plots) depict definitive position (orbit projected at 100 km) and attitude (tabulated as an insert at the top left and bottom left of the plot), as well as future position information, allowing scientific event selection and future science operations planning of conjunctions with other missions. This tool complements SPDF’s TIPSOD program (a 4D orbit viewer) that is applied on the same orbit dataset, released to SPDF daily
Fig. 20
Fig. 20
ELFIN’s summary plots routinely produced by science operations depict the primary dataset (EPDE energy and pitch-angle spectrograms) along with information on loss cone and field direction. Shown is an example of a science zone crossing (ascending North, post-midnight sector). A key on the web-site provides detailed information on the various panels. The top four spectrograms are energy spectrograms of the electron number flux (omni-directional, anti-parallel, perpendicular and parallel to the magnetic field, respectively). The bottom four spectrograms are pitch-angle spectrograms of electron energies [[50.,160.],[160.,345.],[345.,900.],[900.,7000.]]. The pitch-angle spectrograms also contain a solid line at 90, and a second solid line demarcating the loss cone based on the IGRF magnetic field given the spacecraft location and attitude. The dashed line is the anti-loss cone direction (complement of the loss cone). The bottom panel is the IGRF magnetic field in local magnetic coordinates: North (horizontal), East, and Down (vertical)
Fig. 21
Fig. 21
ELFIN EPDE plot produced using nominal data analysis by the ELFIN software (a SPEDAS plug-in). The analysis tools will be released together with the data once routine collections commence with sufficient volume through the ELFIN website. The event shown, a subset of Fig. 20, demonstrates the scientific potential of the mission. A: energy spectrogram of perpendicular electron fluxes (trapped). B: energy spectrogram of parallel (down-going or precipitating) electron fluxes. C: ratio of parallel to perpendicular fluxes. D: ratio of anti-parallel (upward-moving or backscattered) fluxes. E: pitch-angle spectrogram of 50-160 keV electron number flux (in #/(s cm2 str MeV)); F: same as E but for 345-900 keV; G: Earth’s IGRF model magnetic field in local magnetic coordinates: North (horizontal magnetic North), East (horizontal magnetic East), and Down (vertical)

References

    1. Albert J.M. J. Geophys. Res. 2003;108(A6):1249. doi: 10.1029/2002JA009792. - DOI
    1. Angelopoulos V. Space Sci. Rev. 2008;141(1–4):5–34. doi: 10.1007/s11214-008-9336-1. - DOI
    1. Angelopoulos V., Cruce P., Drozdov A., Grimes E.W., et al. Space Sci. Rev. 2019;215(1):9. doi: 10.1007/s11214-018-0576-4. - DOI - PMC - PubMed
    1. Aseev N.A., Shprits Y.Y., Drozdov A.Y., Kellerman A.C., et al. Signatures of ultrarelativistic electron loss in the heart of the outer radiation belt measured by Van Allen Probes. J. Geophys. Res. Space Phys. 2017;122:10,102–10,111. doi: 10.1002/2017JA024485. - DOI
    1. Auslander D., Cermenska J., Dalton G., de la Pena M., et al. Space Sci. Rev. 2008;141(1–4):185–211. doi: 10.1007/s11214-008-9386-4. - DOI