. 2020 Aug 5:2020:8908901.
doi: 10.1155/2020/8908901. eCollection 2020.

The Effects of Alpha-Linolenic Acid on the Secretory Activity of Astrocytes and β Amyloid-Associated Neurodegeneration in Differentiated SH-SY5Y Cells: Alpha-Linolenic Acid Protects the SH-SY5Y cells against β Amyloid Toxicity

Affiliations

The Effects of Alpha-Linolenic Acid on the Secretory Activity of Astrocytes and β Amyloid-Associated Neurodegeneration in Differentiated SH-SY5Y Cells: Alpha-Linolenic Acid Protects the SH-SY5Y cells against β Amyloid Toxicity

Anna Litwiniuk et al. Oxid Med Cell Longev. .

Abstract

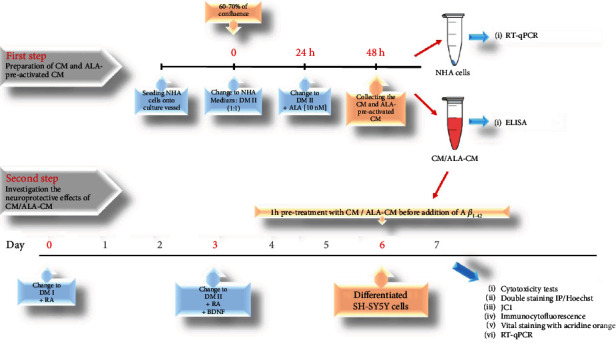
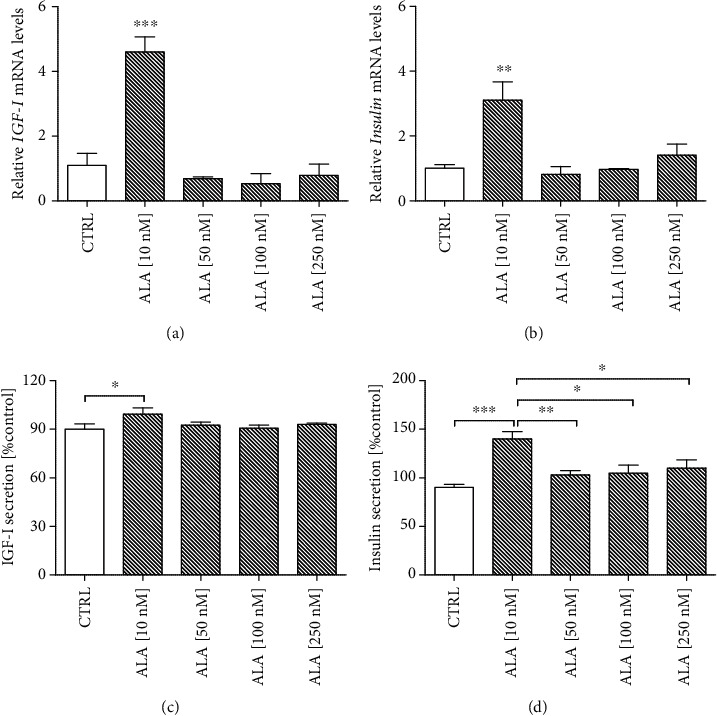
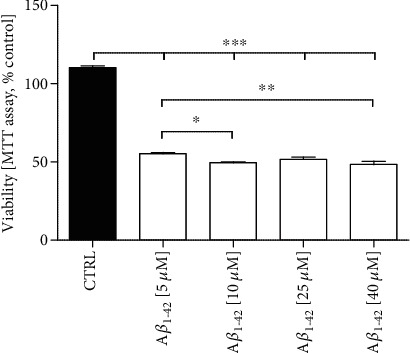
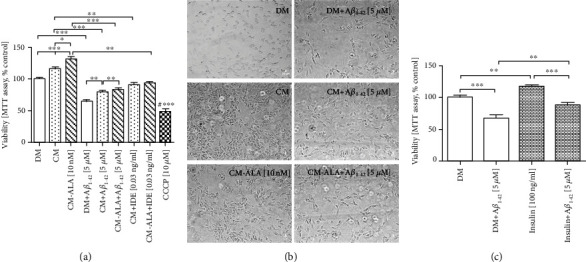
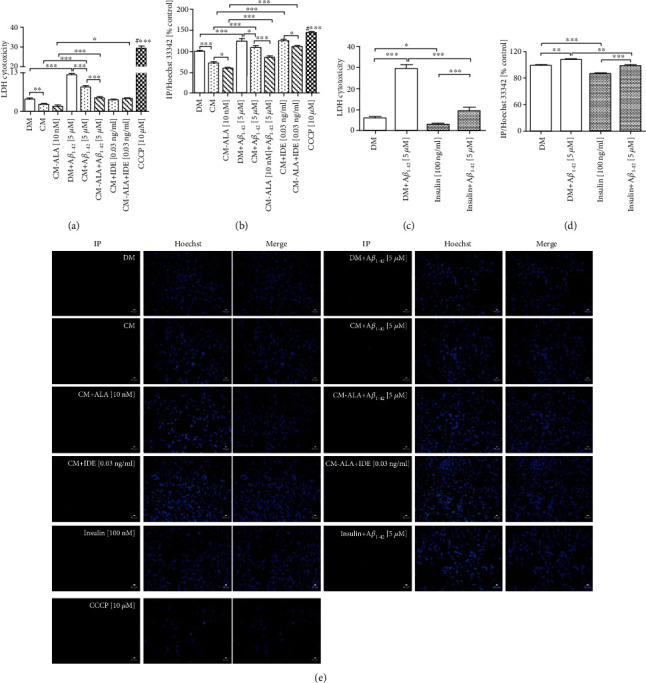
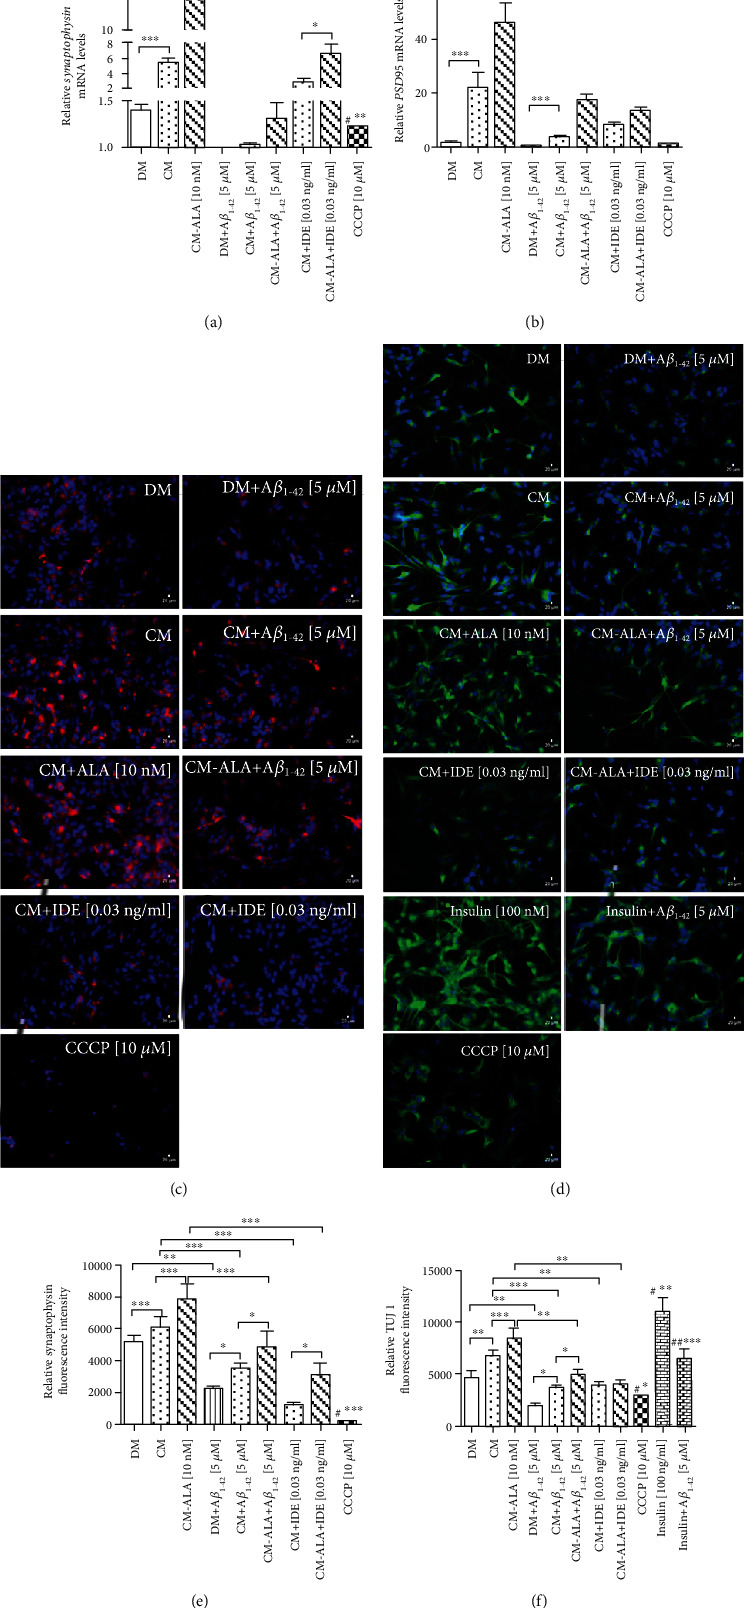
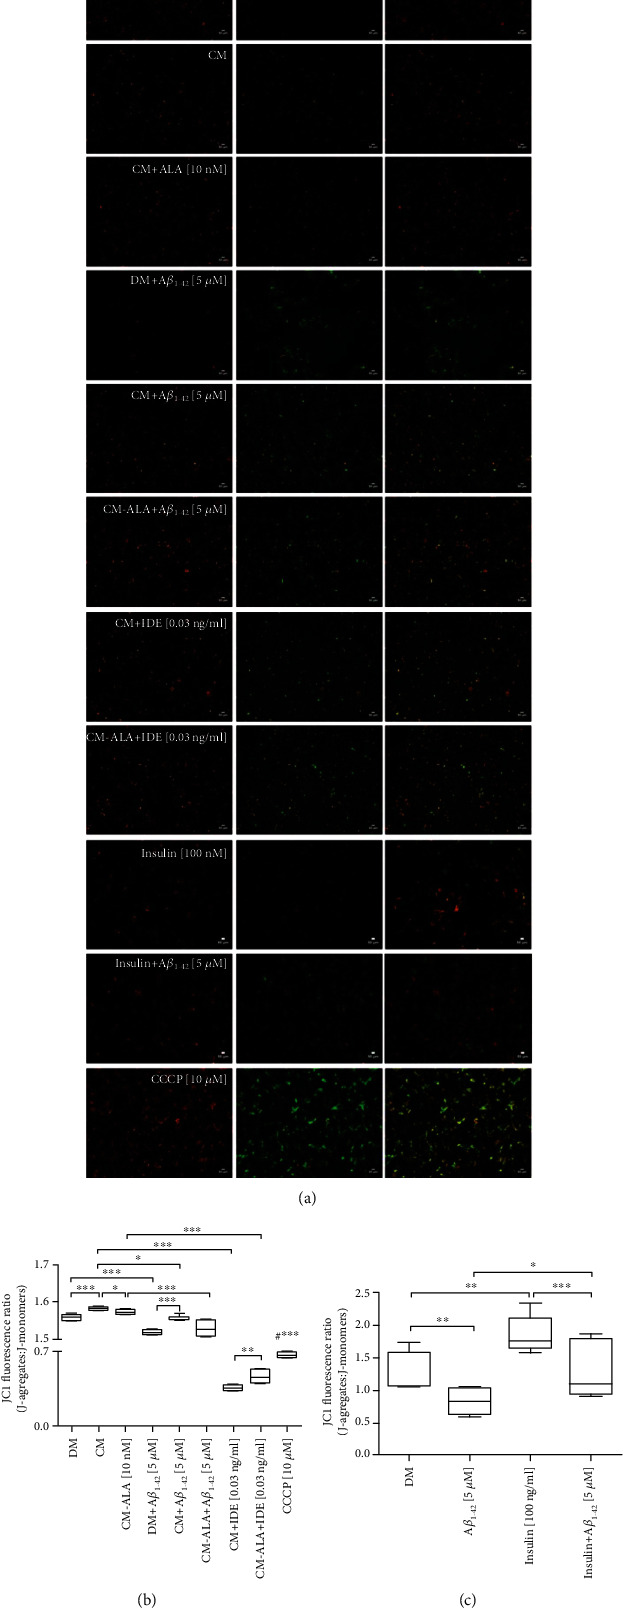
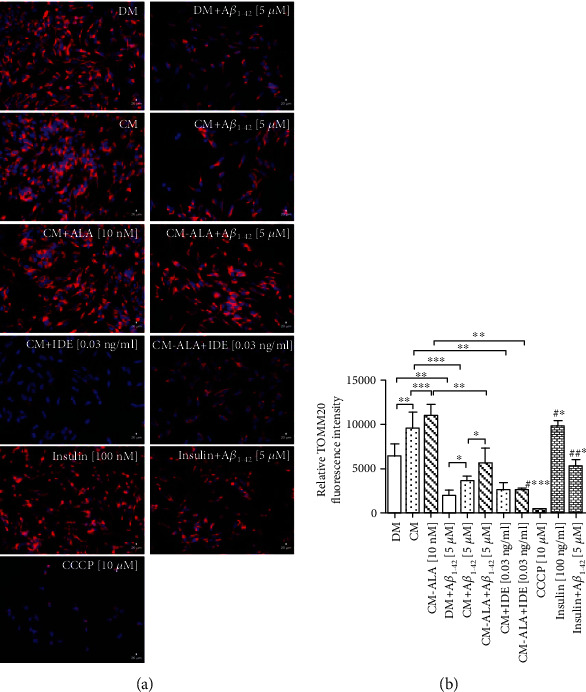
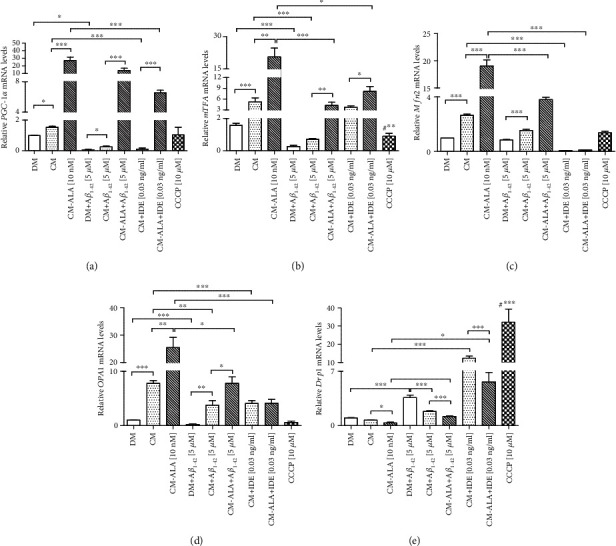
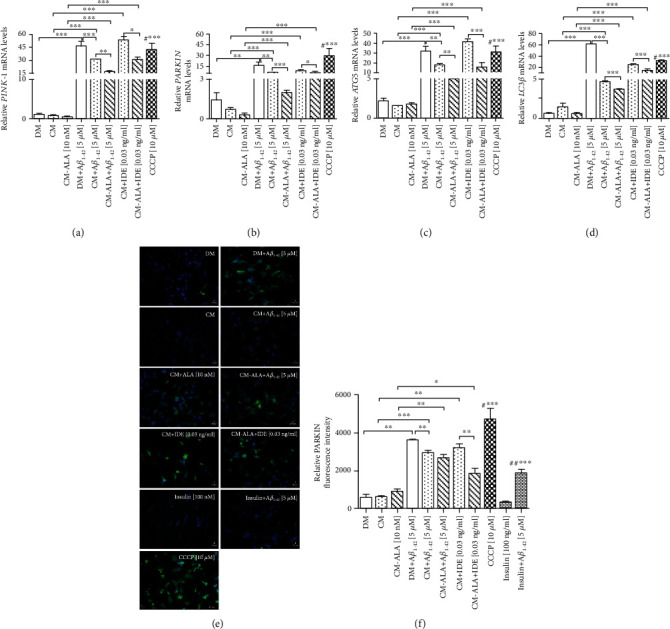
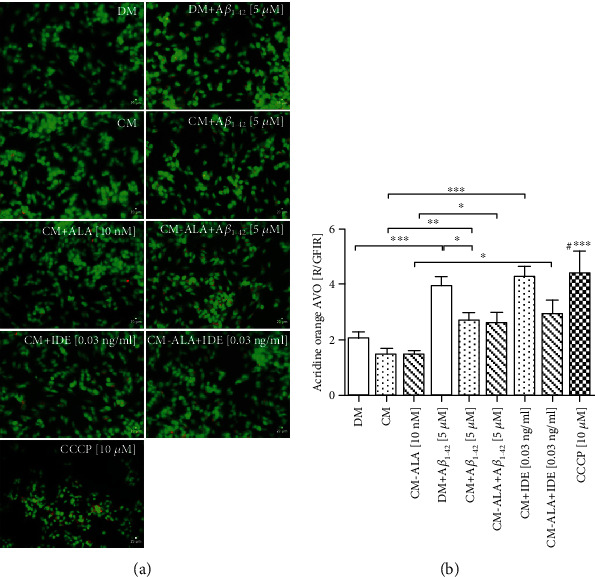
Alzheimer's disease (AD) is the most common neurodegenerative disorder. Amyloid β- (Aβ-) induced mitochondrial dysfunction may be a primary process triggering all the cascades of events that lead to AD. Therefore, identification of natural factors and endogenous mechanisms that protect neurons against Aβ toxicity is needed. In the current study, we investigated whether alpha-linolenic acid (ALA), as a natural product, would increase insulin and IGF-I (insulin-like growth factor I) release from astrocytes. Moreover, we explored the protective effect of astrocytes-derived insulin/IGF-I on Aβ-induced neurotoxicity, with special attention paid to their impact on mitochondrial function of differentiated SH-SY5Y cells. The results showed that ALA induced insulin and IGF-I secretion from astrocytes. Our findings demonstrated that astrocyte-derived insulin/insulin-like growth factor I protects differentiated SH-SY5Y cells against Aβ 1-42-induced cell death. Moreover, pretreatment with conditioned medium (CM) and ALA-preactivated CM (ALA-CM) protected the SH-SY5Y cells against Aβ 1-42-induced mitochondrial dysfunction by reducing the depolarization of the mitochondrial membrane, increasing mitochondrial biogenesis, restoring the balance between fusion and fission processes, and regulation of mitophagy and autophagy processes. Our study suggested that astrocyte-derived insulin/insulin-like growth factor I suppresses Aβ 1-42-induced cytotoxicity in the SH-SY5Y cells by protecting against mitochondrial dysfunction. Moreover, the neuroprotective effects of CM were intensified by preactivation with ALA.


Conflict of interest statement

The authors declare no conflicts of interest.

Figures

Figure 1
Figure 1
Scheme of the experimental procedures. The first step of the research involved the preparation of astrocyte-conditioned medium (CM) and Alpha-linolenic acid-preactivated CM (ALA-CM). The Normal Human Astrocytes (NHA) cells were allowed to grow until 60-70% confluence. Then, NHA cells were grown in the medium containing NHA-Medium and neurobasal medium (the phase II differentiation medium DM II) (1 : 1). After 24 h, the medium was replaced with DM II medium alone or with 10 nM ALA for the next 24 h incubation to obtain CM and ALA-preactivated-CM. The second step included the evaluation of the neuroprotective effect of CM and ALA-CM on Amyloid β1-42- (Aβ1-42-) induced neurodegeneration of differentiated SH-SY5Y cells. On the day 6th, the SH-SY5Y cells (differentiated) were pretreated for 1 h with CM or ALA-CM before the addition of 5 μM Aβ1-42.
Figure 2
Figure 2
Effect of Alpha-linolenic acid (ALA) on the viability of the Normal Human Astrocytes (NHA). The viability of the NHA cells was increased in 10 nM and 50 nM ALA treatments. The NHA cells were exposed for 24 h to ALA at different doses (10 nM, 50 nM, 100 nM, and 250 nM). The obtained results are presented as a percentage of the control value. One-way ANOVA test for viability followed by Tukey's multiple comparisons was used to analyse the data. Results are presented as means ± SEM (n = 6 − 12). Statistical differences between the treated cells and untreated control cells are indicated by asterisks ( for P < 0.05; ∗∗ for P < 0.01; ∗∗∗ for P < 0.001).
Figure 3
Figure 3
Effect of Alpha-linolenic acid (ALA) on mRNA and protein expression of Insulin and Insulin-Like Growth Factor I (IGF-I). Quantitative reverse transcriptase PCR (RT-qPCR) results indicated that 10 nM ALA treatment significantly increased the mRNA expression of IGF-I and Insulin in the NHA cells (a, b). Moreover, the ELISA analysis showed that 10 nM ALA significantly increased the release of IGF-I and insulin from the NHA cells to the medium (c, d). The NHA cells were exposed for 24 h to ALA at different doses (10 nM, 50 nM, 100 nM, and 250 nM). One-way ANOVA followed by Tukey's multiple comparisons test at the 0.05 level was used to determine differences between treated cells and untreated control cells. Results are presented as means ± SEM (n = 3 − 8). RT-qPCR fold increase was calculated according to the formula described in the Materials and Methods section. Statistical differences between treated cells and untreated control cells are indicated by asterisks ( for P < 0.05; ∗∗ for P < 0.01; ∗∗∗ for P < 0.001).
Figure 4
Figure 4
Effect of Amyloid β1-42 (Aβ1-42) treatment on differentiated SH-SY5Y cell viability. Aβ1-42 treatment significantly inhibited the cell viability of differentiated SH-SY5Y cells in a dose-dependent manner as compared with the control. Differentiated SH-SY5Y cells (on the day 6th) were exposed for 24 h to Aβ1-42 at different doses (5 μM, 10 μM, 25 μM, 40 μM). The obtained results are presented as a percentage of the control value. One-way ANOVA test for viability followed by Tukey's multiple comparisons was used to analyse the data. Results are presented as means ± SEM (n = 7 − 8). Statistical differences between the treated and untreated control cells are indicated by asterisks ( for P < 0.05; ∗∗ for P < 0.01; ∗∗∗ for P < 0.001).
Figure 5
Figure 5
CM and ALA-CM reversed the effects of Amyloid β1-42 (Aβ1-42) treatment on differentiated SH-SY5Y cell viability. The results showed that the CM and ALA-CM pretreatment significantly increased the viability of differentiated SH-SY5Y cells and restored Aβ1-42-induced reduction of the cell viability (a). Insulin Degrading Enzyme (IDE) treatment of CM and ALA-CM reduced this effect. On the day 6th, the SH-SY5Y cells (differentiated) were pretreated for 1 h with CM or ALA-CM before the addition of 5 μM Aβ1-42 for the next 24 h. The SH-SY5Y cells were also exposed to cotreatment of CM and ALA-CM with IDE to check whether insulin and IGF-I presence in CM and ALA-CM was responsible for the neuroprotective effect. Positive controls were the SH-SY5Y cells treated with insulin (c) and carbonyl-cyano-m-chlorophenylhydrazone-CCCP (10 μM). The obtained results are presented as a percentage of the control value. One-way ANOVA test for viability followed by Tukey's multiple comparisons was used to analyse data. Statistical differences between the treated cells and untreated control cells are indicated by asterisks ( for P < 0.05; ∗∗ for P < 0.01; ∗∗∗ for P < 0.001; #∗∗∗ versus the control group). Results are means ± SEM of three independent experiments. Cell morphology was observed under a microscope (b). Scale bar is 20 μm.
Figure 6
Figure 6
The CM and ALA-CM pretreatment reversed the Amyloid β1-42- (Aβ1-42-) induced cytotoxicity in differentiated SH-SY5Y cells. The LDH assay (a, c) and double-stained with Hoechst 33342 and propidium iodide (PI) (b, d, e) results indicated that Aβ1-42 significantly increased cell death of differentiated SH-SY5Y cells. Whereas, the CM pretreatment decreased cell death in the SH-SY5Y cells treated with Aβ1-42. Besides, ALA preactivated CM significantly intensified the protective effect of CM. In contrast, Insulin Degrading Enzyme (IDE) significantly attenuated the protective effect of CM and ALA-CM. The insulin pretreatment reversed the Aβ1-42-induced cytotoxicity in differentiated SH-SY5Y cells. On the day 6th, the SH-SY5Y cells (differentiated) were pretreated for 1 h with CM or ALA-CM before the addition of 5 μM Aβ1-42 for the next 24 h. The SH-SY5Y cells were also exposed to cotreatment of CM and ALA-CM with IDE to check whether insulin and IGF-I presence in CM and ALA-CM was responsible for the neuroprotective effect. Positive controls were the SH-SY5Y cells treated with Insulin and carbonyl-cyano-m-chlorophenylhydrazone-CCCP (10 μM). Next, cells were subjected to vital double staining with PI and Hoechst 33342 (see Materials and Methods section). The PI/Hoechst ratio was calculated by dividing the PI by Hoechst Relative fluorescence units (RFUs). One-way ANOVA test for cytotoxicity followed by Tukey's multiple comparisons was used to analyse data. Statistical differences between the treated cells and untreated control cells are indicated by asterisks ( for P < 0.05; ∗∗ for P < 0.01; ∗∗∗ for P < 0.001; #∗∗∗ versus the control group). Results are means ± SEM of three independent experiments. The vital double staining cells were also analyzed in inverted fluorescence microscopy (see Materials and Methods section). Scale bar is 50 μm.
Figure 7
Figure 7
The CM and ALA-CM pretreatment reversed Amyloid β- (Aβ1-42-) induced synaptic toxicity in differentiated SH-SY5Y cells. On the day 6th, the SH-SY5Y cells (differentiated) were pretreated for 1 h with CM or ALA-CM before the addition of 5 μM Aβ1-42 for the next 24 h. The SH-SY5Y cells were also exposed to the cotreatment of CM and ALA-CM with Insulin Degrading Enzyme (IDE) to check whether insulin and IGF-I presence in CM and ALA-CM was responsible for the neuroprotective effect. Positive controls were the SH-SY5Y cells treated with insulin and carbonyl-cyano-m-chlorophenylhydrazone-CCCP (10 μM). RT-qPCR results indicated that Aβ1-42 significantly decreased mRNA levels of Synaptophysin (a) and PSD95 (b), well-known synaptic markers. The CM and ALA-CM pretreatment reversed the effect of Aβ1-42 when compared with DM + Aβ1−42 group. The IDE treatment of CM and ALA-CM reduced this effect. The immunocytofluorescence staining showed that the Aβ1-42 treated cells had a decreased Synaptophysin (c, e) and TUJ 1 (β3-Tubulin) (d, f) fluorescence intensity and increased neurites fragmentation. Moreover, results showed that the CM and ALA-CM pretreatment reversed the Aβ1-42–induced synaptic toxicity in differentiated SH-SY5Y cells. A similar effect of TUJ 1 fluorescence intensity was observed after the treatment of differentiated SH-SY5Y cells with insulin (d, f). The IDE treatment of CM and ALA-CM reduced this effect. The cells were subjected to immunocytofluorescence staining with antibodies against Synaptophysin and TUJ 1. TUJ 1 was used as a marker to stain differentiated SH-SY5Y cells (show as green signals). Synaptophysin was used to stain synaptic in differentiated SH-SY5Y cells (show as red signals). Hoechst 33342 was used to stain nuclei (show as blue signals) (see Materials and Methods section). Bar graphs (e, f) showed the relative fluorescence intensity of Synaptophysin and TUJ 1. Scale bar is 20 μm. One-way ANOVA followed by Tukey's multiple comparisons test at the 0.05 level was used to determine differences between the treated cells and untreated control cells. Results are presented as means ± SEM (n = 3 − 8). RT-qPCR fold increase and the fluorescence intensity were calculated according to the formula described in the Materials and Methods section. Statistical differences between the treated group and untreated control cells are indicated by asterisks ( for P < 0.05; ∗∗ for P < 0.01; ∗∗∗ for P < 0.001; #∗∗∗ versus the control group; ##∗∗∗ versus DM + Aβ1−42 group).
Figure 8
Figure 8
The CM and ALA-CM pretreatment inhibits Amyloid β- (Aβ1-42-) induced depolarization of the mitochondrial membrane in differentiated SH-SY5Y cells. Representative fluorescence microscopy images of 5,5,6,6′-tetrachloro-1,1′,3,3′ tetraethylbenzimi-dazoylcarbocyanine iodide (JC-1) staining (a) and the ratio of fluorescence intensity of J-aggregates to the fluorescence intensity of monomers (b, c) was used to measure mitochondrial membrane potential (ΔΨm) of differentiated SH-SY5Y cells. Results showed that Aβ1-42 treatment decreased the ΔΨm of differentiated SH-SY5Y cells. The CM and ALA-CM pretreatment reversed the effect of Aβ1-42 compared with DM + Aβ1−42 group. The Insulin Degrading Enzyme (IDE) treatment of CM and ALA-CM reduced this effect. On the day 6th, the SH-SY5Y cells (differentiated) were pretreated for 1 h with CM or ALA-CM before the addition of 5 μM Aβ1-42 for the next 24 h. The SH-SY5Y cells were also exposed to cotreatment of CM and ALA-CM with IDE to check whether insulin and IGF-I presence in CM and ALA-CM was responsible for the neuroprotective effect. Carbonyl cyanide 3-chlorophenylhydrazone (CCCP) was used as a mitochondrial membrane potential disruptor. Insulin was used as a positive control. Next, cells were subjected to JC-1 staining (see Materials and Methods section). Fluorescence of JC-1 was measured by a fluorescence microscope and microplate reader. One-way ANOVA followed by Tukey's multiple comparisons test at the 0.05 level was used to determine differences between the treated cell and untreated control cells. Results are presented as means ± SEM (n = 4 − 6). The ratio of fluorescence intensity of J-aggregates (shown as red signals) to the fluorescence intensity of monomers (shown as green signals) was calculated according to the formula described in the Materials and Methods section. Statistical differences between the treated cells and untreated control cells are indicated by asterisks ( for P < 0.05; ∗∗ for P < 0.01; ∗∗∗ for P < 0.001; #∗∗∗ versus the control group). Scale bar is 50 μm.
Figure 9
Figure 9
The CM and ALA-CM pretreatment reversed Amyloid β (Aβ1-42) induced a reduction in mitochondrial mass in differentiated SH-SY5Y cells. The fluorescence intensity indicating mitochondrial mass was calculated by immunocytofluorescence staining of the translocase of outer mitochondrial membrane 20 (TOMM20) in differentiated SH-SY5Y cells. Representative fluorescence images (a) and the relative fluorescence intensity of TOMM20 (b) showed that Aβ1-42 induced a reduction of TOMM20 fluorescence intensity. However, the decrease in TOMM20 fluorescence intensity was improved by the CM pretreatment of differentiated SH-SY5Y cells before Aβ1-42 exposure. Besides, ALA-preactivated CM intensified this effect. In contrast, cotreatment of CM and ALA-CM with Insulin Degrading Enzyme (IDE) markedly decreased the immunoreactivity of TOMM20-positive mitochondrial. On the day 6th, the SH-SY5Y cells (differentiated) were pretreated for 1 h with CM or ALA-CM before the addition of 5 μM Aβ1-42 for the next 24 h. The SH-SY5Y cells were also exposed to cotreatment of CM and ALA-CM with IDE to check whether insulin and IGF-I presence in CM and ALA-CM was responsible for the neuroprotective effect. Carbonyl cyanide 3-chlorophenylhydrazone (CCCP) was used as a mitochondrial membrane potential disruptor. Insulin was used as a positive control. Next, cells were subjected to immunocytofluorescence staining with antibodies against TOMM20 (see Materials and Methods section). TOMM20 was used to stain mitochondria in differentiated SH-SY5Y cells (shown as red signals). Hoechst 33342 was used to stain nuclei (shown as blue signals). Bar graph showed the relative fluorescence intensity of TOMM20. The fluorescence intensity of TOMM20 was calculated according to the formula described in the Materials and Methods section. Statistical differences between the treated cells and untreated control cells are indicated by asterisks ( for p < 0.05; ∗∗ for p < 0.01; ∗∗∗ for p < 0.001; #∗∗∗, # versus the control group; ##; versus DM + Aβ1-42 group). Scale bar is 20 μm.
Figure 10
Figure 10
The CM and ALA-CM pretreatment regulated the mitochondrial biogenesis and dynamics in differentiated SH-SY5Y cells. RT-qPCR results indicated that Amyloid β (Aβ1-42) significantly decreased mRNA levels of PGC-1α (a), mTFA (b), Mfn2 (c), and OPA1 (d), and increased levels of Drp1 (e). Amyloid β (Aβ) Aβ1-42-induced reduction on mitochondrial biogenesis was restored by CM and ALA-preactivated CM. Moreover, the CM and ALA-CM pretreatment regulated the balance between fission and fusion processes. Cotreatment of CM and ALA-CM with Insulin Degrading Enzyme (IDE) decreased mRNA expression of genes involved in mitochondrial biogenesis and promoted the elevation of mRNA levels of Drp1, a fission gene. On the day 6th, the SH-SY5Y cells (differentiated) were pretreated for 1 h with CM or ALA-CM before the addition of 5 μM Aβ1-42 for the next 24 h. The SH-SY5Y cells were also exposed to cotreatment of CM and ALA-CM with IDE to check whether insulin and IGF-I presence in CM and ALA-CM was responsible for the neuroprotective effect. The positive control was the SH-SY5Y cells treated with carbonyl-cyano-m-chlorophenylhydrazone-CCCP (10 μM). One-way ANOVA followed by Tukey's multiple comparisons test at the 0.05 level was used to determine differences between the treated cells and untreated control cells. Results are presented as means ± SEM (n = 3 − 8). RT-qPCR fold increase was calculated according to the formula described in the Materials and Methods section. Statistical differences between the treated cells and untreated control cells are indicated by asterisks ( for p < 0.05; ∗∗ for p < 0.01; ∗∗∗ for p < 0.001; #∗∗ versus the control; #∗∗∗ versus the control group).
Figure 11
Figure 11
The CM and ALA-CM pretreatment modulates Amyloid β- (Aβ1-42-) induced effects on mitophagy and autophagy. On the day 6th, the SH-SY5Y cells (differentiated) were pretreated for 1 h with CM or ALA-CM before the addition of 5 μM Aβ1-42 for the next 24 h. The SH-SY5Y cells were also exposed to the cotreatment of CM and ALA-CM with Insulin Degrading Enzyme (IDE) to check whether insulin and IGF-I presence of CM and ALA-CM was responsible for the neuroprotective effect. Positive controls were the SH-SY5Y cells treated with insulin and carbonyl-cyano-m-chlorophenylhydrazone-CCCP (10 μM). RT-qPCR results showed that Aβ1-42 significantly increased mRNA levels of markers of mitophagy (PINK-1 (a), PARKIN (b)), and autophagy (ATG5 (c) and LC3β (d)). Whereas pretreatment with CM of the SH-SY5Y cells exposed to Aβ1-42 significantly decreased expression of mitophagy and autophagy markers. IDE increased levels of mitophagy and autophagy markers. The immunocytofluorescence staining showed that the Aβ1-42 treated cells had an increased PARKIN fluorescence intensity, a well-known marker of mitophagy (e, f). Whereas pretreatment with CM and ALA-CM of the SH-SY5Y cells exposed to Aβ1-42 significantly decreased PARKIN fluorescence intensity. A similar effect was observed after the insulin treatment. IDE increased PARKIN fluorescence intensity. Bar graph showed the relative fluorescence intensity of PARKIN. Antibody against PARKIN was used to stain marker of mitophagy in differentiated SH-SY5Y cells (shown as green signals). Hoechst 33342 was used to stain nuclei (shown as blue signals). Scale bar is 20 μm. The results showed that Aβ1-42 exposure has a similar effect to CCCP suggesting that Aβ1-42 induce mitophagy and autophagy. One-way ANOVA followed by Tukey's multiple comparisons test at the 0.05 level was used to determine differences between the treated cells and untreated control cells. Results are presented as means ± SEM (n = 3 − 8). RT-qPCR fold increase and the fluorescence intensity were calculated according to the formula described in the Materials and Methods section. Statistical differences between the treated cells and untreated control cells are indicated by asterisks ( for P < 0.05; ∗∗ for P < 0.01; ∗∗∗ for P < 0.001; #∗∗∗ versus the control group; ##∗∗∗ versus DM + Aβ1−42 group).
Figure 12
Figure 12
The CM and ALA-CM pretreatment reduced acidic vesicular organelles (AVOs) production in the SH-SY5Y cells treated with Amyloid β (Aβ1-42). Representative fluorescence microscopy images of acridine orange (AO) staining (a) and the ratio of red to green fluorescence intensity ratio (R/GFIR) (b) were used to measure the late state of autophagy, which is characterized by AVOs production. On the day 6th, the SH-SY5Y cells (differentiated) were pretreated for 1 h with CM or ALA-CM before the addition of 5 μM Aβ1-42 for the next 24 h. The SH-SY5Y cells were also exposed to the cotreatment of CM and ALA-CM with Insulin Degrading Enzyme (IDE) to check whether insulin and IGF-I presence in CM and ALA-CM was responsible for the neuroprotective effect. The positive control was the SH-SY5Y cells treated with carbonyl-cyano-m-chlorophenylhydrazone-CCCP (10 μM). Next, the SH-SY5Y cells were subjected to vital staining with AO (see Materials and Methods section). Red to green fluorescence intensity ratio (R/GFIR) was calculated in at least 10 replicates for each treatment and nontreated controls. One-way ANOVA followed by Tukey's multiple comparisons test at the 0.05 level was used to determine differences between the treated cells and untreated control cells. Results are presented as means ± SEM. Statistical differences between the treated cells and untreated control cells are indicated by asterisks ( for P < 0.05; ∗∗ for P < 0.01; ∗∗∗ for P < 0.001; #∗∗∗ versus the control group).

Similar articles

Cited by

References

    1. Selkoe D. J., Hardy J. The amyloid hypothesis of Alzheimer’s disease at 25 years. EMBO Molecular Medicine. 2016;8(6):595–608. doi: 10.15252/emmm.201606210. - DOI - PMC - PubMed
    1. Villemagne V. L., Burnham S., Bourgeat P., et al. Amyloid β deposition, neurodegeneration, and cognitive decline in sporadic Alzheimer's disease: a prospective cohort study. The Lancet Neurology. 2013;12(4):357–367. doi: 10.1016/S1474-4422(13)70044-9. - DOI - PubMed
    1. Obulesu M., Lakshmi M. J. Apoptosis in Alzheimer's disease: an understanding of the physiology, pathology and therapeutic avenues. Neurochemical Research. 2014;39(12):2301–2312. doi: 10.1007/s11064-014-1454-4. - DOI - PubMed
    1. Itoh K., Nakamura K., Iijima M., Sesaki H. Mitochondrial dynamics in neurodegeneration. Trends in Cell Biology. 2013;23(2):64–71. doi: 10.1016/j.tcb.2012.10.006. - DOI - PMC - PubMed
    1. Cadonic C., Sabbir M. G., Albensi B. C. Mechanisms of mitochondrial dysfunction in Alzheimer’s disease. Molecular Neurobiology. 2016;53(9):6078–6090. doi: 10.1007/s12035-015-9515-5. - DOI - PubMed

MeSH terms