

Intrauterine growth restriction alters growth performance, plasma hormones, and small intestinal microbial communities in growing-finishing pigs
- PMID: 32832077
- PMCID: PMC7437023
- DOI: 10.1186/s40104-020-00490-x
Intrauterine growth restriction alters growth performance, plasma hormones, and small intestinal microbial communities in growing-finishing pigs
Abstract
Background: The interaction of the gut microbiota with key metabolic and physiological processes may be associated with poor growth outcomes in animals born with intrauterine growth restriction (IUGR).
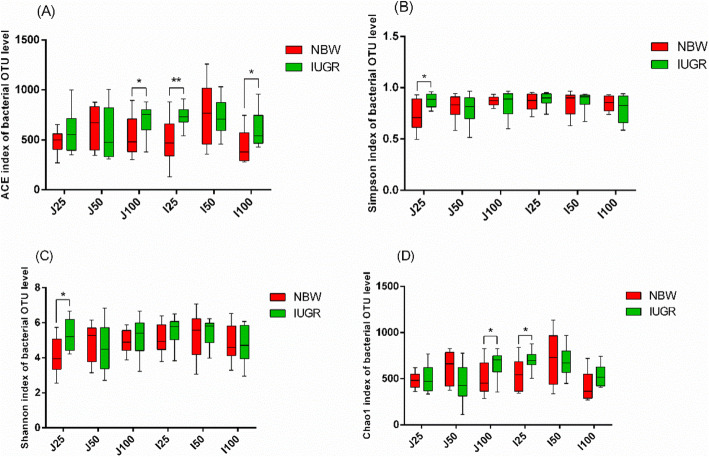
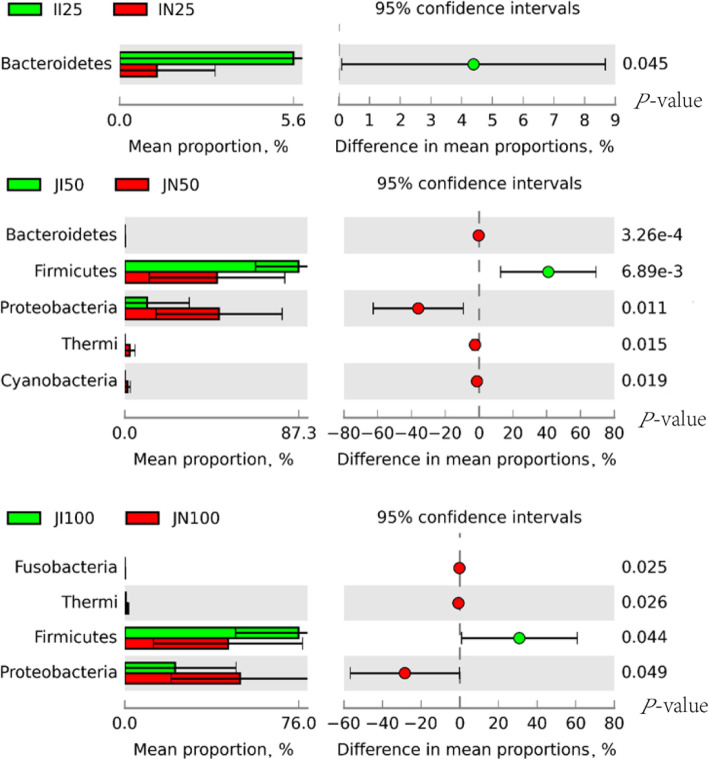
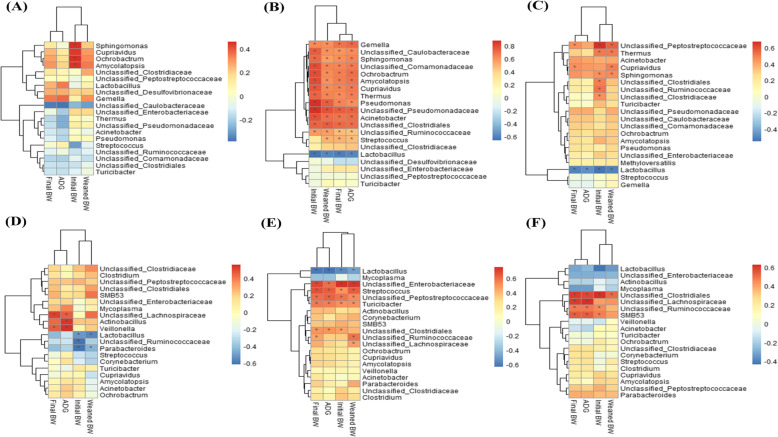
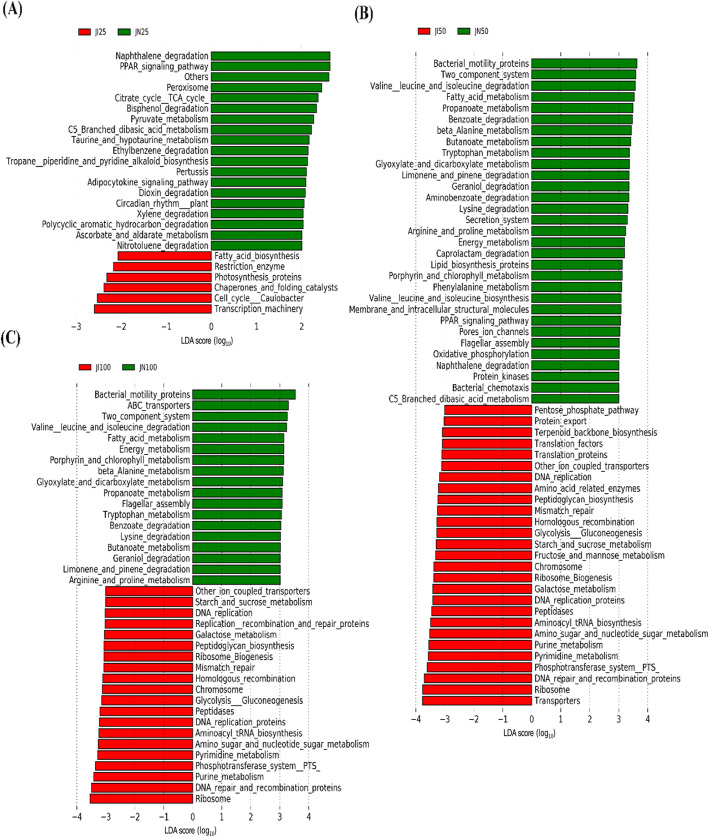
Results: Growth performance, plasma hormone concentrations, and intestinal microbiota composition were analyzed in IUGR pigs and in normal birth weight (NBW) pigs when the NBW pigs reached 25, 50, and 100 kg of body weight (BW). Compared to NBW pigs, IUGR pigs had lower initial, weaned, and final BW, and lower average daily gain and average daily feed intake in all the considered time points. In the 25 kg BW group, IUGR pigs had higher concentrations of plasma ghrelin and pancreatic polypeptide (PP), but lower insulin concentration than NBW pigs, while the situation was reversed in the 50 kg BW group. As compared to NBW pigs, IUGR pigs had higher microbial alpha diversity in the jejunum and ileum; in the 50 and 100 kg BW groups, IUGR pigs had higher Firmicutes abundance but lower Proteobacteria abundance in the jejunum, and lower Lactobacillus abundance in the jejunum and ileum; in the 25 kg BW group, IUGR pigs showed higher unclassified Ruminococcaceae abundance in the ileum; and in 25 and 50 kg BW groups, IUGR pigs showed lower Ochrobactrum abundance in the jejunum. Spearman's correlation revealed that Lactobacillus was negatively correlated with growth performance, while unclassified Ruminococcaceae was positively correlated. Predictive metagenomic analysis detected significantly different expression of genes in the intestinal microbiota between IUGR and NBW pigs, suggesting different metabolic capabilities between the two groups.
Conclusions: Growing-finishing IUGR pigs showed lower growth performance, higher microbial alpha diversity, and differences in plasma hormone concentrations compared to NBW pigs. Alterations in the abundance of Firmicutes, Proteobacteria, Ruminococcaceae, Lactobacillus, and Ochrobactrum in the small intestine may be associated with IUGR, and may therefore serve as a future target for gut microbiota intervention in growing-finishing IUGR pigs.
Keywords: Growing-finishing pigs; Growth performance; Intrauterine growth restriction; Microbial community; Small intestine.
© The Author(s) 2020.
Conflict of interest statement
Competing interestsThe authors declare that no competing interests exist. The manuscript has not been published previously.
Figures
 IUGR) pigs and normal birth weight (
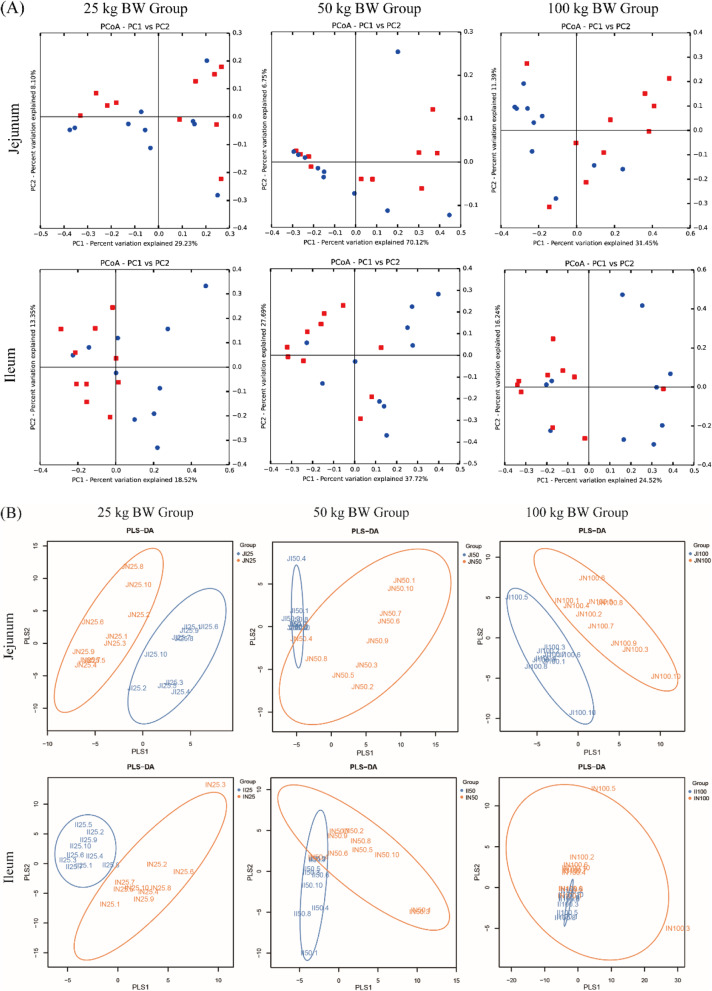
  NBW) pigs in the 25, 50, and 100 kg BW groups, and each symbol represents the intestinal microbiota of one pig. The data presented are obtained from 10 animals in each group (n = 10). a Principal coordinate analysis (PCoA) along the axes IUGR and NBW. b Partial least square discriminant analysis (PLS-DA) based on an unweighted UniFrac distances score plot of jejunum and ileum microbiota. Each point represents the microbial community of one pig


Similar articles
-
Intrauterine growth retardation affects liver bile acid metabolism in growing pigs: effects associated with the changes of colonic bile acid derivatives.J Anim Sci Biotechnol. 2022 Nov 2;13(1):117. doi: 10.1186/s40104-022-00772-6. J Anim Sci Biotechnol. 2022. PMID: 36320049 Free PMC article.
-
Dietary bile acid supplementation alters plasma biochemical and hormone indicators, intestinal digestive capacity, and microbiota of piglets with normal birth weight and intrauterine growth retardation.Front Microbiol. 2022 Nov 10;13:1053128. doi: 10.3389/fmicb.2022.1053128. eCollection 2022. Front Microbiol. 2022. PMID: 36439828 Free PMC article.
-
Intrauterine Growth Restriction Affects Colonic Barrier Function via Regulating the Nrf2/Keap1 and TLR4-NF-κB/ERK Pathways and Altering Colonic Microbiome and Metabolome Homeostasis in Growing-Finishing Pigs.Antioxidants (Basel). 2024 Feb 26;13(3):283. doi: 10.3390/antiox13030283. Antioxidants (Basel). 2024. PMID: 38539817 Free PMC article.
-
Gut microbiota of newborn piglets with intrauterine growth restriction have lower diversity and different taxonomic abundances.J Appl Microbiol. 2019 Aug;127(2):354-369. doi: 10.1111/jam.14304. Epub 2019 Jun 7. J Appl Microbiol. 2019. PMID: 31077497 Free PMC article.
-
Maternal imprinting of the neonatal microbiota colonization in intrauterine growth restricted piglets: a review.J Anim Sci Biotechnol. 2019 Nov 11;10:88. doi: 10.1186/s40104-019-0397-7. eCollection 2019. J Anim Sci Biotechnol. 2019. PMID: 31737268 Free PMC article. Review.
Cited by
-
Intrauterine growth retardation affects liver bile acid metabolism in growing pigs: effects associated with the changes of colonic bile acid derivatives.J Anim Sci Biotechnol. 2022 Nov 2;13(1):117. doi: 10.1186/s40104-022-00772-6. J Anim Sci Biotechnol. 2022. PMID: 36320049 Free PMC article.
-
Dietary Epidermal Growth Factor Supplementation Alleviates Intestinal Injury in Piglets with Intrauterine Growth Retardation via Reducing Oxidative Stress and Enhancing Intestinal Glucose Transport and Barrier Function.Animals (Basel). 2022 Aug 30;12(17):2245. doi: 10.3390/ani12172245. Animals (Basel). 2022. PMID: 36077965 Free PMC article.
-
An Ensemble Learning Method Based on an Evidential Reasoning Rule considering Combination Weighting.Comput Intell Neurosci. 2022 Mar 7;2022:1156748. doi: 10.1155/2022/1156748. eCollection 2022. Comput Intell Neurosci. 2022. PMID: 35295274 Free PMC article.
-
Integrated Bacterial and Fungal Diversity Analysis Reveals the Gut Microbial Alterations in Diarrheic Giraffes.Front Microbiol. 2021 Aug 12;12:712092. doi: 10.3389/fmicb.2021.712092. eCollection 2021. Front Microbiol. 2021. PMID: 34475863 Free PMC article.
-
Gut Microbiota, Inflammation, and Probiotic Supplementation in Fetal Growth Restriction-A Comprehensive Review of Human and Animal Studies.Life (Basel). 2023 Nov 21;13(12):2239. doi: 10.3390/life13122239. Life (Basel). 2023. PMID: 38137841 Free PMC article. Review.
References
-
- Wu G, Bazer FW, Cudd TA, Meininger CJ, Spencer TE. Maternal nutrition and fetal development. J Nutr. 2004;134:2169–2172. - PubMed
-
- Pallotto EK, Kilbride HW. Perinatal outcome and later implications of intrauterine growth restriction. Clin Obstet Gynecol. 2006;49:257–269. - PubMed
-
- Wu G, Bazer FW, Wallace JM, Spencer TE. Board-invited review: intrauterine growth retardation: implications for the animal sciences. J Anim Sci. 2006;84:2316–2337. - PubMed
-
- Aw TY. Intestinal glutathione: determinant of mucosal peroxide transport, metabolism, and oxidative susceptibility. Toxicol Appl Pharmacol. 2005;204:320–328. - PubMed
-
- Xu RJ, Mellor DJ, Birtles MJ, Reynolds GW, Simpson HV. Impact of intrauterine growth retardation on the gastrointestinal tract and the pancreas in newborn pigs. J Pediatr Gastroenterol Nutr. 1994;18:231–240. - PubMed
LinkOut - more resources
Full Text Sources
Research Materials
Miscellaneous
