. 2020 Jun 5;9(7):10.
doi: 10.1167/tvst.9.7.10. eCollection 2020 Jun.

Optical Coherence Tomography Angiography Projection Artifact Removal: Impact on Capillary Density and Interaction with Diabetic Retinopathy Severity

Affiliations

Optical Coherence Tomography Angiography Projection Artifact Removal: Impact on Capillary Density and Interaction with Diabetic Retinopathy Severity

Mohamed Ashraf et al. Transl Vis Sci Technol. .

Abstract

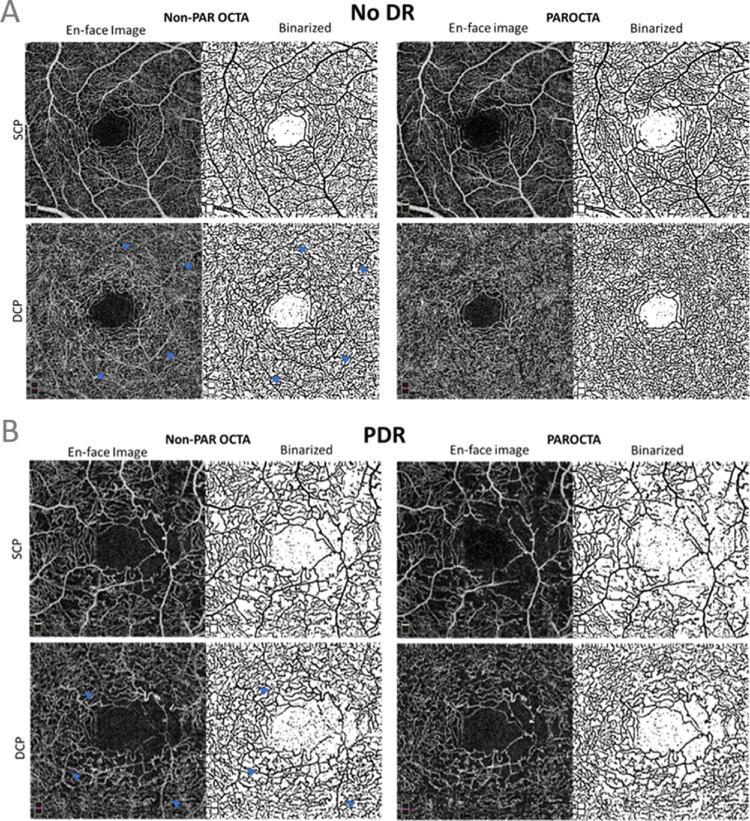
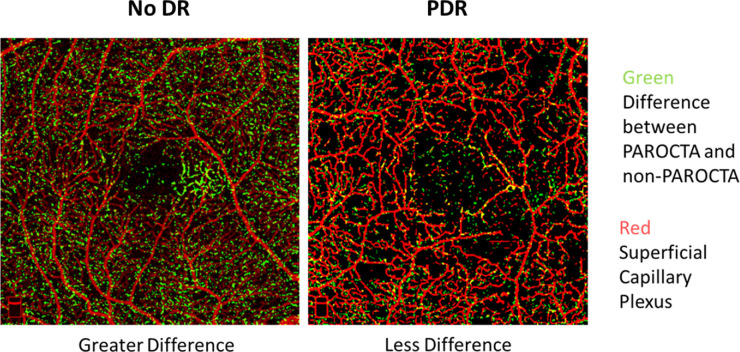
Purpose: The purpose of this study was to assess how projection artifact removal (PAR) alters optical coherence tomography angiography (OCTA) assessment of superficial capillary plexus (SCP) and deep capillary plexus (DCP) in eyes of patients with diabetes.

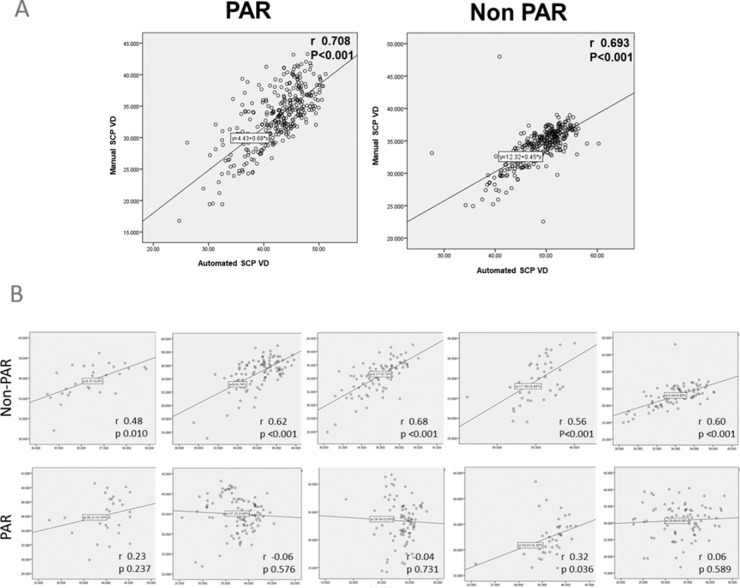
Methods: We acquired 3 × 3 mm scans with RTVue-XR Avanti (Optovue, Inc., Fremont, CA), which were analyzed with PAR software (PAROCTA) and without (non-PAROCTA). SCP, DCP, and full thickness retina vascular density (VD) and vessel linear density (VLD) were manually calculated using ImageJ (version 1.51). Adjusted flow index (AFI) was manually assessed for full thickness images.

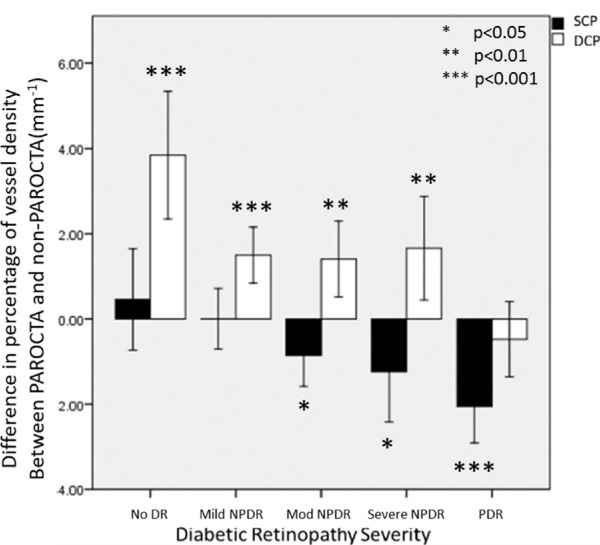
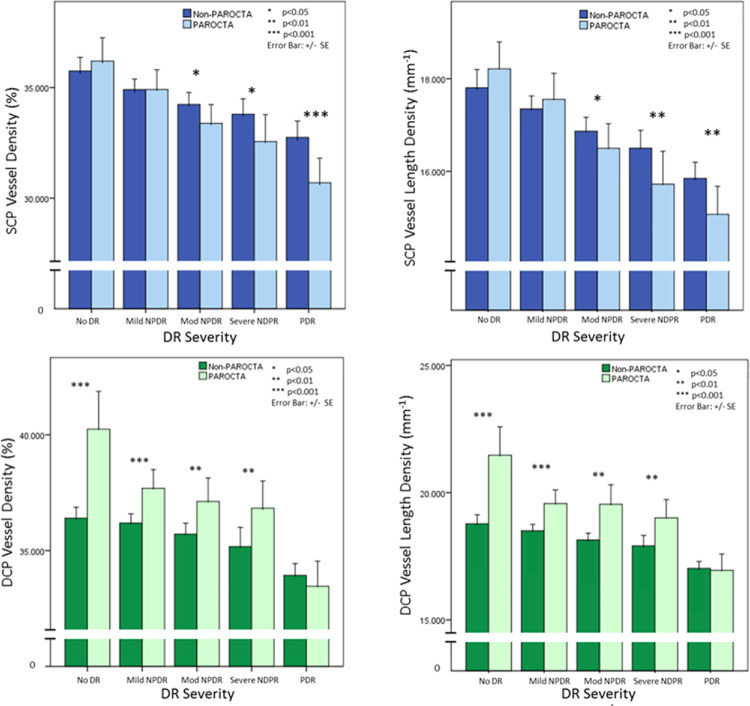
Results: Among 323 eyes of 194 patients (no diabetic retinopathy [DR]: 28 eyes; mild nonproliferative DR (NPDR): 96 eyes; moderate: 82 eyes; severe: 32 eyes; and proliferative DR [PDR]: 81 eyes), SCP VD and VLD were lower with PAROCTA than with non-PAROCTA only in eyes with moderate (VD: P = 0.017; VLD: P = 0.046), severe (P = 0.016; P = 0.009), and PDR (P < 0.001; P = 0.002). DCP VD and VLD were higher with PAROCTA as compared to non-PAROCTA only in eyes with no DR (VD and VLD: P < 0.001), mild (VD and VLD: P < 0.001), moderate (VD: P = 0.005; and VLD: P < 0.001), and severe (VD: P = 0.009; VLD: P < 0.001). Full thickness PAROCTA and non-PAROCTA VD and VLD differed only in eyes with no DR where PAROCTA estimates were higher (VD: P = 0.009; VLD: P = 0.02). PAROCTA AFI was lower than non-PAROCTA AFI for all DR severity levels (P < 0.001) except no DR.

Conclusions: Although differential effects of PAROCTA software are expected on SCP versus DCP measurements, these findings also suggest an interaction between PAROCTA and DR severity on assessment of VD. Conclusions from previous studies that have not corrected VD with PAR software should be carefully reviewed with regard to the role of specific vascular layers in DR.

Translational relevance: Previous OCTA studies that have not corrected VD with PAR software should be carefully reviewed with regard to the role of individual vascular layers in differing severity levels of DR.

Keywords: diabetic retinopathy imaging; optical coherence tomography angiography; retina.


Conflict of interest statement

Disclosure: M. Ashraf, None; K. Sampani, None; O. Abu-Qamar, None; J. Cavallerano, None; P.S. Silva, None; L.P. Aiello, None; J.K. Sun, Optovue (F)

Figures

Figure 1.
Figure 1.
Identifying differences in the deep capillary plexus (DCP) between projection artifact removal (PAROCTA) and non-PAROCTA processed eyes. (A, B) Binarized images of the DCP using PAROCTA and non-PAROCTA versions of the software. (C) Pixels exclusive to PAROCTA obtained by subtracting the non-PAROCTA image from the PAROCTA image. (D) Pixels exclusive to non-PAROCTA obtained by subtracting the PAROCTA image from the non-PAROCTA image. (E, F) Pixels unique to each version of the software (green) overlaid on the superficial capillary plexus (SCP) (Red) with common pixels shown in yellow, demonstrating that differences unique to non-PAROCTA are mainly projection artifacts from the SCP while those exclusive from PAROCTA originate from the DCP. (G) Pixels unique to PAROCTA (green) when overlaid on the non-PAROCTA DCP (red) demonstrate “recovery” of finer capillaries not previously visualized on non-PAROCTA.
Figure 2.
Figure 2.
Differences between PAROCTA and non-PAROCTA vessel density measurements in superficial (SCP) and deep capillary plexus (DCP) across different DR severity levels.
Figure 3.
Figure 3.
Bar graphs demonstrating the differences between PAROCTA and non-PAROCTA in different diabetic retinopathy (DR) severity levels. The upper row illustrates changes in the SCP demonstrating that with increasing DR severity levels vessel density (VD) and vessel length density (VLD) decreases in both versions of the software. PAROCTA measurements are lower for both the VD and VLD, with increasing disparity with higher DR severity levels. The lower row illustrates changes in the DCP demonstrating similar trends to the SCP. However, PAROCTA measurements are greater for both the VD and VLD, with greater disparity in milder DR.
Figure 4.
Figure 4.
(A) Figure illustrating differences in the superficial capillary plexus (SCP) and deep capillary plexus (DCP) between projection artifact removal optical coherence tomography angiography (PAROCTA) and non-PAROCTA in an eye with no DR. The SCP appears to have similar vessel density in both PAR and non-PAROCTA images. The DCP using non-PAROCTA has many projection artifacts (blue arrowheads) and appears less dense compared to the PAROCTA image. (B) Image showing the difference between projection artifact removal optical coherence tomography angiography (PAROCTA) and non-PAROCTA in an eye with proliferative diabetic retinopathy (PDR) showing decreased vessel density (VD) in the superficial capillary plexus (SCP) with similar VD in the deep capillary plexus (DCP). Due to a decrease in SCP VD, fewer projection artifacts (blue arrowheads) are visible in the DCP in this eye with PDR compared to the eye with no DR.
Figure 5.
Figure 5.
(A) Correlation between superficial (SCP) and deep capillary plexus (DCP) vessel density across all DR severity levels. (B) Correlation between automatic and manual superficial capillary plexus vessel density in eyes with DR.
Figure 6.
Figure 6.
Image demonstrating that pixels unique to projection artifact removal optical coherence tomography angiography (PAROCTA) (green) overlaid on the superficial capillary plexus (SCP) (red) for orientation, demonstrating that there are significantly greater differences in eyes with no diabetic retinopathy (DR) (left hand image) compared to eyes with proliferative diabetic retinopathy (PDR) (right hand image).

References

    1. Jia Y, Tan O, Tokayer J, et al. .. Split-spectrum amplitude-decorrelation angiography with optical coherence tomography. Optics Express. 2012; 20: 4710–4725. - PMC - PubMed
    1. Dimitrova G, Chihara E, Takahashi H, Amano H, Okazaki K. Quantitative retinal optical coherence tomography angiography in patients with diabetes without diabetic retinopathy. Invest Ophthalmol Vis Sci. 2017; 58: 190–196. - PubMed
    1. Vujosevic S, Muraca A, Alkabes M, et al. .. Early microvascular and neural changes in patients with type 1 and type 2 diabetes mellitus without clinical signs of diabetic retinopathy. Retina. 2019; 39: 435–445. - PubMed
    1. Spaide RF, Fujimoto JG, Waheed NK. Image artifacts in optical coherence tomography angiography. Retina. 2015; 35: 2163–2180. - PMC - PubMed
    1. Spaide RF, Fujimoto JG, Waheed NK, Sadda SR, Staurenghi G. Optical coherence tomography angiography. Prog Retin Eye Res. 2018; 64: 1–55. - PMC - PubMed

Publication types